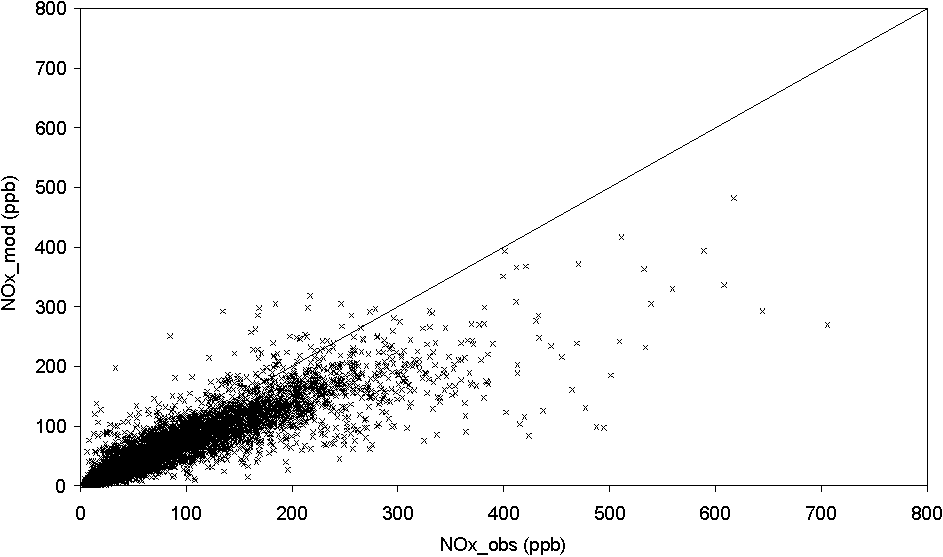
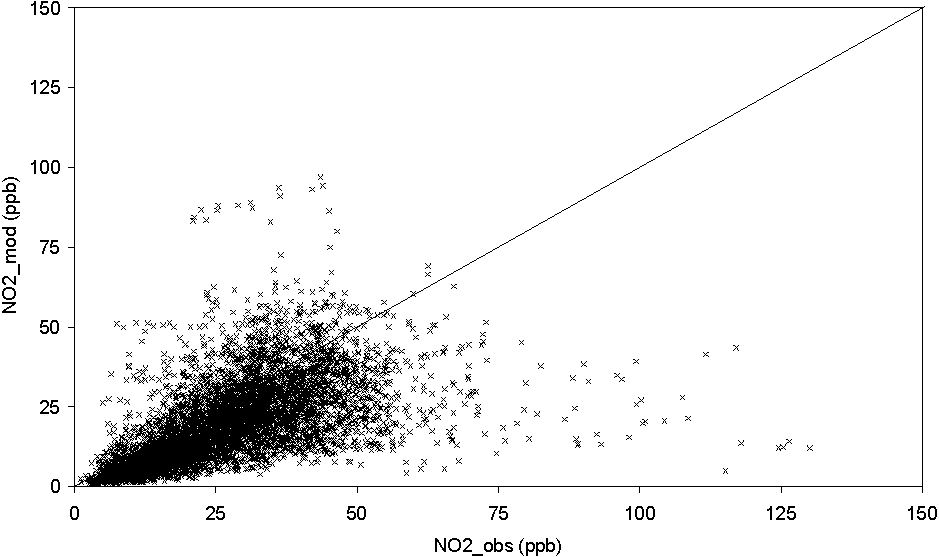
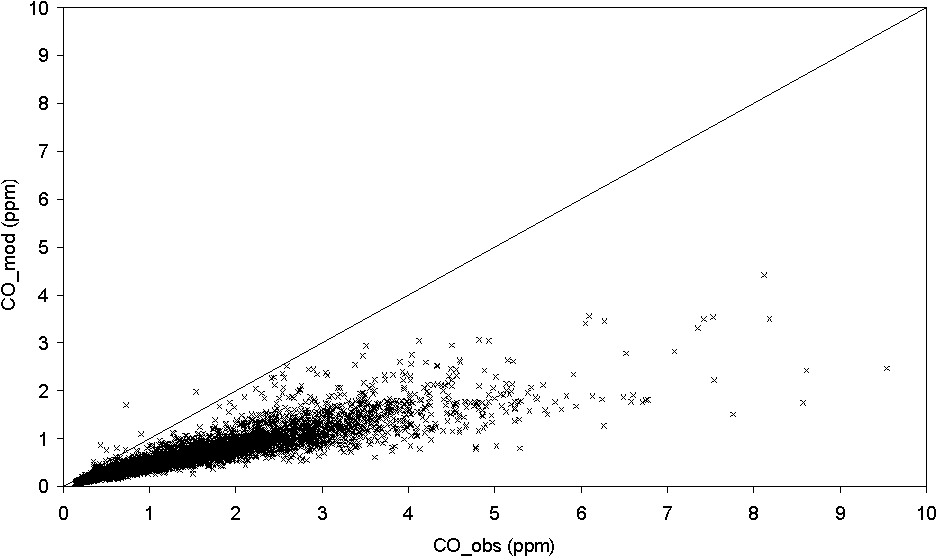
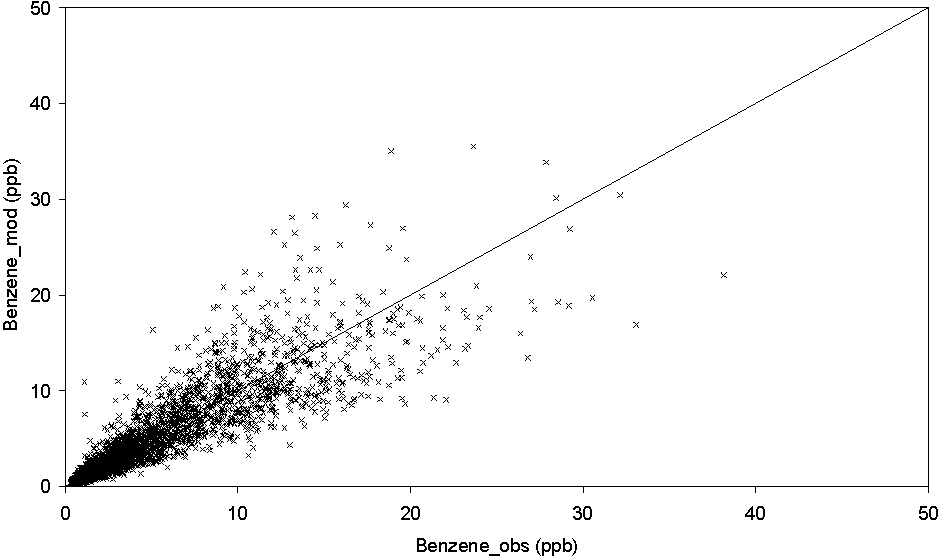
Scatter plots of modelled and observed NOx, NO2, CO and benzene hourly concentrations in Jagtvej, Copenhagen. One to one lines are also drawn.


[Back]
_______________________________
Future Air Quality in Danish cities |
|
|||
| Figure 6.1 Scatter plots of modelled and observed NOx, NO2, CO and benzene hourly concentrations in Jagtvej, Copenhagen. One to one lines are also drawn.
[Back] |