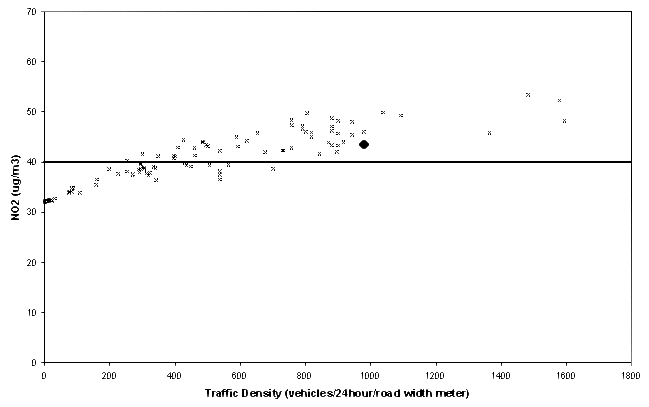
Model calculations for annual mean of NO2 in 2000 for 103 Copenhagen streets with the OSPM model. Jagtvej is marked with a bold dot. The new EU limit value for 2010 is also shown.
[Back]
_______________________________
Future Air Quality in Danish cities |
|
|||
| Figure 6.3 Model calculations for annual mean of NO2 in 2000 for 103 Copenhagen streets with the OSPM model. Jagtvej is marked with a bold dot. The new EU limit value for 2010 is also shown.
[Back] |