Development of a Nordic system for measuring the inactivation of pathogens during composting
2. Indicator organisms for human and animal pathogens
2.1 Purpose
The purpose of this part of the investigation was to:
- Check that the inoculum added to the raw material can be recovered by the applied analytic methods.
- Investigate the resistance of the inoculated organisms under standard conditions.
- Compare results obtained with different methods (NMKL and DS methods).
2.2 Materials and Methods
2.2.1 Origin of samples
In the full-scale investigation, composting of three raw materials are investigated: Yard waste, sewage sludge, and household waste. Therefore, the behaviour of the inoculated organisms was analysed in the different types of raw materials.
Shredded yard waste was obtained from a composting plant at Dragør, Copenhagen. Also, the raw material prepared for composting of sewage sludge was obtained at Dragør, which consisted of a mixture of sewage sludge (40%) and shredded yard waste (60%). The raw material prepared for composting of household waste was sampled at AFAV, Frederikssunds. This material consisted of household waste (mixed with 6% paper) treated by a 2-3 day drum pre-composting process mixed in a 1:1 ratio with shredded yard waste from Dragør. For each type of raw material, three composite samples were taken representing different places of the heap.
2.2.2 Production of inoculum cultures
Inoculum cultures of E. coli (strain no. 228) and S. faecalis (strain no. 122) were produced from commercial strains available at VDL (Veterinær Direktoratets Laboratorium, Denmark). The inoculum’s were produced by culturing the strains in a Tryptone Soya Broth (OXOID CM 129) at 37° C for 24 hours. This procedure resulted in a germ concentration of E. coli at 2.7±0.3� 108 to 2.6±0.5� 109 per mL (mean±SD, n = 3) and for S. faecalis the concentration was 3.3±0.2 � 107 to 9.7±4.0 � 107 per mL (n = 3).
2.2.3 Evaluation of the recovery efficiency
The concentrations of E. coli and enterococci were investigated in control samples of 100 g raw material (n = 3 for each raw material) mixed with 10 mL distilled water. Samples inoculated with E. coli and S. faecalis were prepared by mixing 100 g raw material (n = 3) with 10 mL of the prepared E. coli and S. faecalis inoculum cultures, respectively. Thereafter, the concentrations of E. coli were determined in samples inoculated with E. coli and the concentrations of enterococci (fecal streptococcus) were determined in samples inoculated with S. faecalis.
2.2.4 Resistance of inoculated strains under standard conditions
For each type of raw material, 3 samples inoculated with E. coli and 3 samples inoculated with S. faecalis were produced. The samples were produced by mixing 200 g of the raw material with 20 mL of the inoculum cultures. Thereafter, the inoculated samples were transferred to nylon bags and incubated in sterilised wet (water content = 5 weight %) sand at 20° C for four weeks. This procedure is used in Germany to check the viability of Salmonella during the test period (Bioabfallverordnung, 1998). After the incubation period, the concentrations of E. coli were determined in samples inoculated with E. coli and the concentrations of enterococci were determined in samples inoculated with S. faecalis.
2.2.5 Analytic methods
E. coli was determined according to the procedure given by the Nordic Committee on Food Analysis (NMKL) no. 125 (1996). In this method, E. coli is defined as thermotolerant coliform bacteria, which in the IMViC test give the reaction ++--. Thermotolerant coliform bacteria are bacteria growing on violet red bile agar at 44° C in 24 hours. Some of the samples were also analysed for E. coli according to NMKL 147 (1993) using the Petrifilmä Plate method to compare the results obtained by these two methods. For both methods, the mean bacteria flora was determined in the solid material according to the pre-treatment procedure given in NMKL 91 (1988).
S. faecalis was determined as enterococci (fecal streptococcus) according to NMKL 68 (1992) after extraction of the bacteria from the solid material by NMKL 91 (1988). In this method, enterococci is defined as bacteria growing in media containing 6.5% NaCl, at pH 9.6 at 45° C and do not produce catalase.
For three samples composed of sewage sludge, parallel analyses were performed for enterococci according to the procedure given by The Danish Standards Association (DS 2401, 1999).
2.3 Results
2.3.1 Recovery of the inoculum added to the raw materials
The concentrations of E. coli in the raw materials were very low compared to the amount of E. coli added with the inoculum cultures (Fig. 1). Thus, the raw materials contained 104-105 bacteria g-1 and constituted thereby below 1‰ of the amount of bacteria added with the inoculum culture (2.7±0.3 � 108 g-1, mean ± SD, n = 3). The concentrations of E. coli measured in the inoculated raw materials (~2.5 � 107 g-1) were significantly lower (P < 0.001) than the amount of bacteria added with the inoculum. However, the effect of the inoculum procedure was pronounced which was indicated by an increase in the E. coli concentrations in the raw materials by a factor 1000.
The concentrations of enterococci in the raw materials were also low compared to the
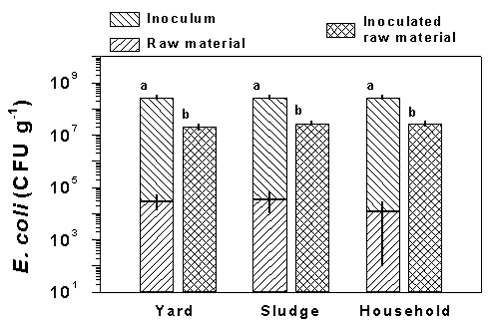
Figure 1.
The concentration of E. coli in the raw materials and the amount of E. coli
added to the raw materials with the inoculum culture are shown in left stacked bars. The
concentration of E. coli measured in samples of the raw materials inoculated with
the E. coli culture are shown in the right bars. Results are shown for yard,
sludge, and household waste. Data are means ± SD of three samples. Values with different
letters are significantly different (P < 0.05, two-tailed t-test). Notice the E.
coli concentration is plotted on a logarithmic scale, indicating that the amount of E.
coli in the raw material was less that 1‰ of the amount added with the inoculum
culture.
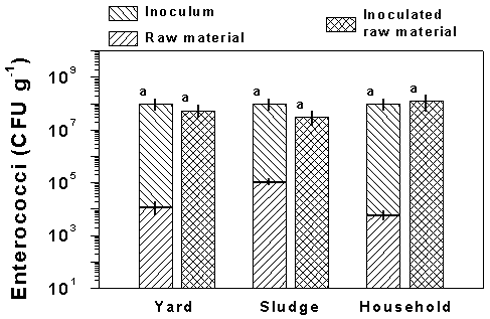
Figure 2.
The concentration of enterococci in the raw materials and the amount of Streptococcus
faecalis added to the raw materials with the inoculum culture are shown in the left
stacked bars. The concentration of enterococci measured in samples of the raw materials
inoculated with the Streptococcus faecalis culture are shown in the right bars. Results
are shown for yard, sludge, and household waste. Data are means ± SD of three samples.
Values with different letters are significantly different (P < 0.05, two-tailed
t-test). Notice the enterococci concentration is plotted on a logarithmic scale,
indicating that the amount of enterococci in the raw material was less that 1‰ of the
amount added with the inoculum culture.
amount of S. faecalis added with the inoculum culture (Fig. 2). The
concentrations of enterococci in the raw materials were between
104-105 g-1 and the amount of bacteria added with the
inoculum procedure was ~108 g-1. There were no significant
differences in the enterococci concentrations of the inoculated raw materials and the
theoretical concentrations calculated from the concentrations in the raw materials and the
amount of bacteria added with the 10-mL inoculum culture.
2.3.2 Resistance of inoculated strains under standard conditions
For E. coli, the raw materials were inoculated with 2.6± 0.5 � 109 colony forming units (CFU) g-1 (Fig. 3). After the 4 weeks incubation period at 20° C in wet sand, the concentrations of E. coli were higher in treatments inoculated with E. coli compared to control treatments of the raw material without inoculation. However, the concentrations of E. coli after the incubation period were low compared to the amount of bacteria added. Thus, the concentrations of E. coli in inoculated samples were 1.4± 0.9 � 105, 8.2± 2.3 � 105, and 1.1± 0.6 � 105 CFU g-1 for raw materials based on yard, sludge and household waste, respectively.
The concentration of S. faecalis in the inoculum culture was lower than for E. coli, resulting
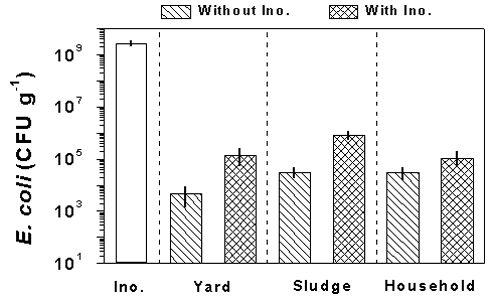
Figure 3.
The amount of E. coli added with the inoculum culture (Ino.) and the concentration of
E. coli in the raw materials after the 4 weeks incubation period for samples with and
without addition of inoculum culture. Results are shown for yard, sludge, and household
waste. Data are means ± SD of three samples. Notice the E. coli concentration is plotted
on a logarithmic scale.
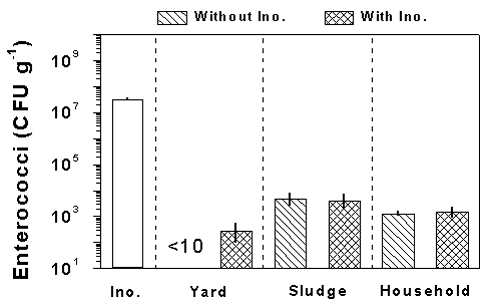
Figure 4.
The amount of enterococci added with the inoculum culture (Ino.) and the concentration
of enterococci in the raw materials after the 4 weeks incubation period for samples with
and without addition of inoculum culture. Results are shown for yard, sludge, and
household waste. Data are means ± SD of three samples. Notice the enterococci
concentration is plotted on a logarithmic scale.
in a lower inoculum concentration of 3.3± 0.2 � 107 CFU g-1 (Fig. 4). After the incubation period, the concentration was reduced in all treatments, and for raw materials based on sludge and household waste there were no significant differences between treatments with or without inoculation. For yard waste without inoculation, the concentration was below the detection limit (10 CFU g-1) after the incubation period whereas inoculated samples showed a concentration of 3± 2 � 102 CFU g-1.
2.3.3 Comparison of results obtained with different methods
Generally there was good agreement between the results obtained for E. coli with NMKL 125 and NMKL 147. However, for concentrations below 105 CFU g-1 the NMKL 147 method resulted in lower concentrations than expected from the results obtained with NMKL 125 (Fig. 5).
Three samples composed of raw material based on sludge were analysed for enterococci according to NMKL 68 (1992) and DS 2401 (1999). For these samples, the concentration obtained with the DS method (2.5± 0.6 � 104 CFU g-1) was significantly lower (P < 0.01, two-tailed t-test) than the results obtained with the NMKL method (1.1± 0.2 � 105 CFU g-1).
2.4 Discussion
The advantage of the direct process evaluation is the access to evaluate the inactivation of
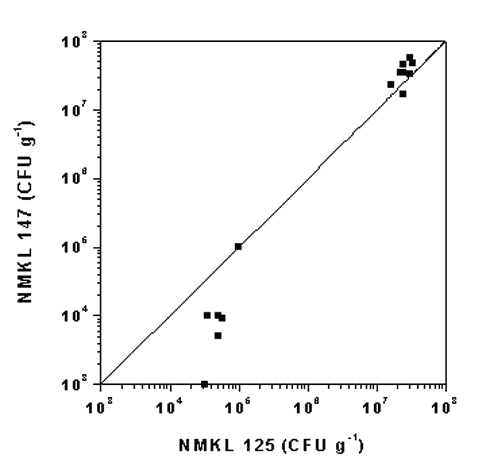
Figure 5.
The concentrations of E. coli measured according to the NMKL 147 (1993) method as a
function of the results obtained by the NMKL 125 (1996) method for identical samples. The
line represents the function where the results obtained by the two methods are identical.
defined inoculated organisms during the composting process. Thereby it will be possible to compare the sanitary efficiency of different composting concepts/plants independent on the composition of the waste. However, before initiating a direct process evaluation it is essential to ensure that the inoculum added to the raw materials can be analysed with the applied methods and to know the resistance of the chosen organisms under standard conditions.
2.4.1 Recovery of the inoculated organisms from the raw materials
The purpose with the inoculation of the raw materials with E. coli and S. faecalis is to create an environment dominated by the inoculated organisms in a concentration there allow to investigate their inactivation during the composting process. Inoculation with 10-mL culture per 100-g raw material resulted in an environment totally dominated by the inoculated organisms for both E. coli and S. faecalis/enterococci. At the same time, the concentrations of the inoculated organisms were 108 or higher allowing the measurement of a log 6-7 reduction of the inoculated organisms. For S. faecalis, there was good agreement between the amount of germs added to the raw materials and the amount retrieved. However, for E. coli the recovery of the inoculated organisms were less efficient, since the amount of E. coli measured in the inoculated raw materials were about 1 log unit lower than the amount added. An explanation for this observation could be an inhomogeneous distribution of the bacteria in the raw material resulting in a lower number of colony forming units than the actual number of bacteria present in the material. Other explanations could be that the extraction procedure (NMKL 91, 1988) did not extracted all bacteria form the raw materials or some of the bacteria were inactivated after they were applied to the raw materials. Thus, when evaluating the reduction of E. coli in the direct process evaluation, it will be necessary to know the actual measured inoculum concentration and not the calculated concentration based on the germ concentration in the inoculum.
2.4.2 Resistance of inoculated strains under standard conditions
In Germany, Salmonella senftenberg W775 is used as indicator organism for human and veterinary sanitation in the direct process evaluation. The demand to the process is that no viable salmonellae can be found, in any of the inoculated samples, and controls samples have to confirm the viability of the bacteria during the test period (Bioabfallverordnung, 1998). However, the analysis for salmonellae is qualitative and the results are therefore only given as Salmonella present or not present. The demand to the control samples incubated under standard conditions, confirming the viability of the bacteria during the test period, is therefore fulfilled if the concentration of Salmonella stays above the detection limit.
In the proposed Nordic investigation, E. coli and S. faecalis/enterococci were considered to have several advantages relative to Salmonella as indicator organisms in a direct process evaluation (Christensen et al., 2000). One of these advantages is that these organisms are easier to quantify allowing for a more differentiated interpretation of the results. In the Nordic full-scale investigation it will thus be possible to evaluate how efficient the inactivation of the inoculated organism is relative to control samples.
The content of E. coli and S. faecalis in control samples, composed of the raw materials inoculated with the bacteria cultures, were for all samples above the detection limit after the incubation period (Fig. 3 and 4). However, compared to the amount of bacteria added with the inoculum cultures, the concentrations of E. coli and S. faecalis were low. Thus, the environment in the control samples must have stressed the bacteria. The measured reduction is unfavourable, since the inactivation during the composting process must be related to the control samples. If a considerable inactivation in the control samples is observed under standard conditions, it will therefore be difficult to measure any reduction during the composting process, relative to the control samples.
During the 4 weeks incubation period, the inoculated control samples were stored in wet sand at 20° C. On the surface, these conditions seems to be good for the microbial population. However, a clear problem with sand as a storage medium, is that the water-holding capacity is low. Thus, the content of water in the relatively wet sand used during the incubation period was only 5%. In contrast, the water content of the raw materials for composting is typically between 50 and 60%. During the incubation period, an equilibrium in the water content was very likely established between the sand and the raw materials resulting in drying of the raw materials. This mechanism was probably the consequence for the inactivation of the inoculated bacteria, and it is therefore recommended to use an incubation media with a higher water-holding capacity than sand. To avoid drying, the water content of the incubation media must be adjusted so it is similar to the water content of the raw materials.
2.4.3 Comparison of results obtained with different methods
For the enterococci analysis, the good agreement between the calculated and the measured concentrations in the raw materials inoculated with S. faecalis supported that the NMKL 68 (1992) is useably for the investigated samples. However, for raw materials based on sludge the NMKL method resulted in higher concentrations than the DS method. This study can not evaluate the quality of the NMKL method relative to the DS method. However, the study stresses that it is very important that the same method is used in all countries participating in the full-scale investigation if it shall be possible to compare the results.
In the analysis for E. coli, there was generally good agreement between the results obtained with the two methods used. However, at concentrations below 105 CFU g-1, the NMKL 147 (1993) method resulted in lower concentrations than NMKL 125 (1996). Again, this study can not evaluate the quality of the used methods. However, as stated in the NMKL 125 (1996) procedure, this method is especially suitable for detection of stressed or sub-lethally injured bacteria, and this might be the reason for the higher concentrations observed at low concentrations.
Since the full-scale investigation is a Nordic project, it is important that the used methods are available in all the participating countries. In addition, the above mentioned considerations supports that NMKL 68 (1992) is used for analysis of enterococci and NMKL 125 (1996) is used for analysis of E. coli.
2.5 Recommendations for the full-scale investigation
| To check the quality of the inoculum culture, parallel samples of the inoculated raw materials are taken at the beginning of the incubation period. | |
| To evaluate the viability of the inoculum culture, parallel samples of the inoculated raw materials are incubated under control conditions. | |
| To avoid drying during the incubation period, the control samples must be stored under oxidised conditions in an incubation medium with a water content similar to the water content in the raw materials. | |
| E. coli is analysed according to NMKL 125 (1996). | |
| Enterococcus is analysed according to NMKL 68 (1992). |