Report of the sub-committee on the environment and health.
10. Model calculations of the consequences of the environment and health scenarios for phasing out pesticides
10.1 Description of the scenarios
This chapter describes the consequences for the environment and health of some of the scenarios that have been coordinated with the technical sub-committees on "agriculture", "production, economy and employment" and "legislation" (Main Committee Report 1999). The scenarios are compared with present production in the agricultural sector. The scenarios are as follows:
| Present production (1994) | |
| 0-scenario: total phase-out of pesticides | |
| 0+scenario: almost total phase-out of pesticides | |
| +scenario: limited use of pesticides | |
| ++scenario: reduced use of pesticides |
It should be noted that there are only sufficient data for real calculations of the consequences of a total or partial phase-out of pesticides compared with present production for the following impacts:
| Impacts on the population density of selected soil organisms (springtails and earthworms in farmland) |
| Impacts on the populations of 9 farmland bird species |
| Impacts on the size of the seed pool in farmland |
| Probability of impacts on algae and crustaceans in ponds |
| The population’s intake of pesticides |
In connection with the calculations, a number of qualitative assessments have been carried out of the consequences of the various scenarios for important environmental and health aspects in connection with a total or partial phase-out of pesticides.
0-scenario: total phase-out of pesticides
The analysis is based on the 12 types of farm set up in chapter 4 of the Main Committee's report. For each of these types of farm, proposals have been made for adjustment of the crop rotations to accommodate a phase-out of pesticides.
The basis for the proposed crop rotations in this scenario is as follows: The farms' present production and structure are kept largely unchanged with respect to livestock units and types of crop. The total livestock production is maintained. In order to compensate for a reduction in greenfeed production, the acreage used for this purpose is increased slightly at the expense of the acreage used for cereals. The crop rotations with potatoes, sugar beet and seed grass are maintained without clarification of whether that is realistic in a scenario with a total phase-out of pesticides.
0+-scenario: almost total phase-out of pesticides
In the scenario with an almost total phase-out of pesticides it is assumed that pesticides are only used where the crop would not otherwise be able to meet specific, statutory requirements concerning purity or that are subject to requirements concerning prevention and control of pests covered by the quarantine rules as defined in notices from the Danish Plant Directorate or where dressing of seed to the 1st generation is required. It would thus still be permissible to use pesticides for:
| treatment of all seed to and including the 1st generation | |
| control of problematical species of weed in seed grass | |
| Seed potatoes. Use of desiccation agents and agents against potato blight. | |
| control of wild oat in stands in which hoeing is not possible | |
| prevention and control of the Colorado beetle in seed potatoes | |
| prevention and control of specific pests in pot plants and nursery cultures. |
+-scenario: limited use of pesticides
In the scenario with limited use of pesticides, slightly more use of pesticides is permitted than in the 0-scenario. It is assessed here which crop/pest combinations it would be most difficult to cope with without pesticides. This decision depends on the yield loss as a consequence of pest attack.
Basically, the areas included are those that would produce the biggest yield loss or those where it is estimated that a profitable production of specific crops could not be maintained without pesticides. There must be a) considerable average losses (>15-20%) as a consequence of pests or b) the production would be encumbered with so much uncertainty that it might be discontinued or not fitted into the crop rotation. The fact that losses of more than 15-20% can occur in individual localities and in individual years is not taken into account in the scenario because, for most crops, it is not possible to predict how often such a situation would occur.
Use of pesticides would be permitted for the following purposes:
| minimal use to combat potato blight in ware and starch potatoes | |
| seed treatment and band spraying of fodder beets and sugar beet | |
| controlling specific species of weed in cereals (e.g. camomile and charlock) | |
| controlling weeds in peas | |
| controlling patches of perennial weeds such as thistles | |
| controlling grass weed in particularly infested areas | |
| combating serious attacks of leaf diseases in wheat and winter barley on the basis of warnings | |
| combating pollen beetles in spring rape in conditions in which the crop cannot compensate for attacks | |
| band spraying with herbicides in maize | |
| chemical control of couch grass in 1 out of 10 years, combined with mechanical control | |
| controlling poisonous weed species such as spring groundsel in greenfeed | |
| combating aphids when the damage threshold has been exceeded in cereals and peas | |
| combating snails and flea beetles in rape when the damage threshold has been exceeded | |
| combating clover weevil in clover seed production | |
| combating diseases and pests in fruit production, assessed on the basis of the level of attack | |
| combating diseases and pests in vegetables, assessed on the basis of the level of attack | |
| for desiccation and prevention and control of fungi in garden seed crops. |
++scenario: reduced use of pesticides
In the third scenario with reduced use of pesticides, serious economic losses from pests are not envisaged. Production is similar to present production. The scenario is based on a proposal from the Danish Institute of Agricultural Sciences, which considered in 1996 that there was a realistic possibility of reducing the treatment frequency index without that affecting present farm-level economy.
In this scenario it is assumed that all available damage thresholds are used, together with mechanical weed control, where these methods can compete with chemical methods. A crop rotation very similar to that practised today can be expected, with economic optimisation but also optimisation with respect to minimising use of pesticides.
Treatment frequency index in the five scenarios
The 1994 treatment frequency index (Environmental Protection Agency 1995b) has been chosen as the index in present production. Figure 10.1 shows the expected treatment frequency index in the different scenarios as a national average for agricultural land.
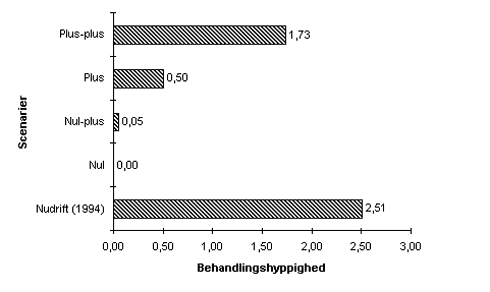
Figure 10.1
The treatment frequency index in present production and the four scenarios. The 1994
treatment frequency index is used as the index in present production.
(Figure texts:
Scenarier = scenarios
Plus-plus = ++scenario
Plus = +scenario
Nul-plus = 0+scenario
Nul = 0-scenario
Nudrift = present production
Behandlingshyppighed = Treatment frequency index)
Scenarios for forests
The following definitions are used in the assessment of the effects in forests in 10.3.1 and 10.3.2:
| 0-scenario: No use of pesticides in forestry |
| 0+scenario: No use of pesticides in forestry, but pest control in nurseries is exempted in the case of production for export, where the product cannot be supplied without risk of pests or diseases. |
| + and ++scenarios: Use of pesticides in forestry permitted if not using them would mean that production could not be maintained, and greatest possible consideration for the environment. In reality that means that all groups of pesticides may be used in nurseries where they cannot reasonably be replaced by mechanical or biological control and that insecticides may be used when necessary in Christmas tree and ornamental greenery production. |
10.2 Pollution and exposure of different compartments
10.2.1 Pesticides in groundwater
Weather and climate play an important role in groundwater pollution
All else being equal, reduced use of pesticides would reduce the source of groundwater pollution. Groundwater pollution depends on a complicated interaction between a number of factors that are essentially stochastic (random), since weather and climate play a decisive role. These factors and the interaction between them include, particularly:
| the spraying time in relation to the plant cover and precipitation events | |
| the degradation conditions in the soil, which are in turn governed by the temperature and moisture | |
| the physical properties of the geological formations, including water penetrability and any fissures or macropores | |
| water transport in the groundwater zone. |
0-scenario
In the longer term, the 0-scenario means that pesticides will no longer be detected in the groundwater. The time that takes will depend on the local geological conditions, the degradation of pesticides already in the soil strata and, lastly, the movements of the groundwater. The available geological data describing the spatial extent of the soil strata and the movements of the groundwater are insufficiently detailed. Furthermore, there is a lack of knowledge about the sorption and degradation of pesticides in the very long term in the concentrations occurring in groundwater. It is therefore not possible, either nationally or locally, to calculate when the present and future pollution of the groundwater will end. However, it will obviously take some considerable time (more than 30 years). We need to know more about the quantitative "hydrogeological parameters", i.e. focus on parameter estimation and the scaling problem on a regional scale (including hydraulic conductivity, effective porosity, sorption and degradation). It is important to improve and refine existing deterministic models and possibly link them with stochastic calculation principles in order to be able to calculate the probability of detecting pesticides in a given concentration in the groundwater at a given time and in a given locality. Knowledge is lacking about the duration of pollution from total weed control, including BAM pollution and about the importance and duration of leaching from disposal of pesticides at waste disposal sites.
The other scenarios
Figure 10.2 shows the expected pesticide consumption in the various scenarios. It is assumed that, all else being equal, the load on the groundwater will diminish in proportion to the consumption. However, a number of measures already introduced will help to reduce the probability of finds in groundwater. That applies particularly to the tightening of DEPA's authorisation scheme introduced with the Prohibition Act and growing use of substances that, with the present pattern of use, have a low groundwater pollution potential. The ban on the use of pesticides in areas designated as particularly sensitive is also playing an important role in reducing the risk of future pollution of the groundwater. As shown in figure 10.2, both the +scenario and the ++scenario involve a consumption of pesticides that could, depending on the type of substance, imply a risk of groundwater pollution, although with a much lower detection frequency in time than at present. As mentioned, it is only possible to give a broad time frame for the advent of that situation.
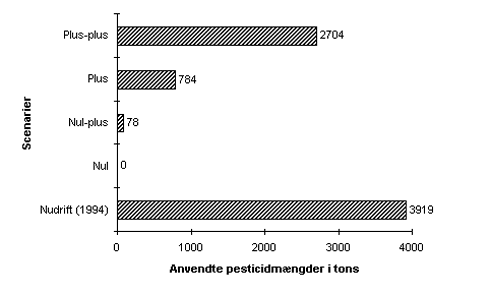
Figure 10.2
Total consumption of pesticides in present production and the various scenarios.
Groundwater pollution depends on a number of climatic, biological and geological factors
and on the quantity of pesticides used and the properties of the authorised substances.
(Figure texts:
Scenarier = Scenarios
Plus-plus = ++scenario
Plus = +scenario
Nul-plus = 0+scenario
Nul = 0-scenario
Nudrift = present production
Anvendt pesticidmængde i tons = Quantity of pesticide used, in tonnes)
10.2.2 Pesticides in soil, surface water and the atmosphere
Soil
After spraying, pesticides are broken down and absorbed by the soil and plants. Normally, only substances with a half-life of max. 3 months in soil at 10° C and at 20° C are authorised. In the case of substances with shorter half-lives, the residual quantity is much smaller. However, in field conditions, where the conditions for degradation are not optimal, degradation can take longer. The temperature and humidity are important factors in this connection, as described in section 4.6.4. In the winter months, the degradation process in the topsoil thus comes to a standstill at low temperatures, and in the summer months, drying out of the soil halts the degradation process. If use of the currently authorised pesticides ends in a given area, the residues in the soil will normally be degraded and thus not accessible to plants or animals, or leach to the groundwater, after a cultivation season.
Residues in the soil
Degradation of the residues of all pesticides is prevented by the fact that the molecules diffuse into microscopic pores in the soil particles, where they can no longer be reached by microorganisms. These residues can be detected with special analytical methods with effective extraction and sensitive apparatus and are of the same order of magnitude as the concentrations supplied to the cultivation systems through atmospheric deposition of pesticides transported over long distances. Lastly, it should be mentioned that it is possible to detect formerly authorised persistent pesticides, such as DDT and lindane, in relatively high concentrations in the soil in areas in which they were used more than 15 years ago. That applies particularly to orchards. It can thus be concluded that old, persistent pesticides that are no longer authorised are still being detected in soil, whereas most of the authorised pesticides will be degraded one to two years after use of them ceases.
Drain water
The supply of pesticides to drain water depends on the dosage, the degradation and adsorption in the topsoil and evaporation. If pesticides were totally phased out, the amount that could be transported down in the soil would disappear. However, leaching of the residues in the soil could continue for some years, depending on precipitation events and the soil conditions, which determine the adsorption and degradation of the substances.
The atmosphere
If pesticides were no longer used the problem of evaporation and spray drift from the areas in question would disappear. However, there would still be a supply of pesticides through long-range transboundary atmospheric transport. Pesticides would thus continue to be supplied with precipitation, although less frequently and in considerably smaller concentrations than described in section 4.5. It should be noted here that the finds described cover only some of the pesticides that could be transported to the atmosphere through spray drift and evaporation here in Denmark and elsewhere. It is therefore not possible to calculate scenarios for the consequences of reduced use of pesticides. Lastly, the herbicide DNOC would occur in relatively high concentrations even if pesticides were phased out, partly because the substance is synthesised through atmospheric, chemical reactions with components in car exhaust fumes etc. and partly because of long-range transboundary transport (see section 4.5).
Watercourses, ponds and lakes
With a total phase-out of pesticides, spray drift to watercourses, lakes and ponds would immediately cease, whereas it would take one to several years before the residues of pesticides supplied with run-off were completely degraded. The supply to drain water would thus also continue until the last residues of pesticides disappeared from the uppermost soil strata. Watercourses and lakes are usually in hydrological connection with the groundwater. Therefore, if the groundwater was polluted with pesticides, there would be a supply with the inflowing groundwater. This supply of pesticide residues would continue for considerably longer than the supply from drain water in the uppermost soil strata. These factors are described in section 10.2.1 concerning groundwater. However, even if pesticides were totally phased out in Denmark, the surface water would still receive small quantities of pesticides via precipitation as a consequence of long-range transboundary atmospheric pollution. It is not possible to determine the importance of leaching of pesticides from buried pesticide waste and of leaching from washing and filling s and other point sources of pollution of surface water. It is therefore also difficult to determine when such pollution would cease.
Summary
With a total or partial end to the use of pesticides in soil or to the risk of pesticides hitting the soil, residues of the currently authorised pesticides would largely disappear from the uppermost soil strata within 1 to 5 years. Direct spray drift to watercourses, lakes and ponds would cease immediately, whereas the supply via surface run-off and drain water would continue for some years. The supply via groundwater that is polluted with pesticides depends on a number of factors and could in most localities continue for a long period of time. The Danish contribution from the atmosphere to soil and surface would be reduced immediately, but there would still be a small contribution via long-range transboundary atmospheric pollution.
10.3 Environmental impacts
The impacts of pesticides on flora and fauna in the terrestrial and aquatic environment are closely related to the toxic properties of the pesticide in question and to how the pesticide is spread and degraded in the environment. The impact on the individual plant or animal species depends on the exposure and sensitivity of the species to a given pesticide and on how the species is affected by changes in the populations of other species. Many of these relationships are not quantified and it is therefore not possible, with our present level of knowledge, to give a precise description of the overall effects of the current use of pesticides on terrestrial and aquatic environments. It is thus not possible, either, to give a precise description of the effect that a total or partial phase-out of pesticides would have on these environments.
On the basis of studies of the effect of pesticides on springtails, earthworms, five species of weed and nine species of bird and on algae and daphnia in the aquatic environment, models have been constructed for calculating the consequences of a total or partial phase-out of pesticides for the respective organisms. The results of the model calculations must be regarded as a best idea of the consequences on the basis of the underlying studies and assumptions, but not as an exact expression of the consequences for the organisms in question. In this connection, it must be stressed that the model calculations must not be taken, either, as an expression of the consequences for all other organisms in the terrestrial and aquatic environments.
10.3.1 The fauna in cultivated and uncultivated terrestrial ecosystems
Up through the last century, farming in Denmark has become increasingly intensive. Farm units have become larger and drainage more intensive, and there has been a high degree of specialisation. The higher degree of specialisation has resulted in monoculture of cereals and increased use of fertiliser and pesticides. In step with the intensification of farming, the cultivated land's flora and fauna have also changed. Many plants and animals that used to be common in the midfield or in hedges and small biotopes have decreased in number or disappeared altogether. In this connection, the increased use of pesticides is presumed to play a critical role with respect both to the reduced biological diversity in arable land and to the decrease observed in the populations of some animals and plants living in the agro-ecosystem.
The crop rotation is an important factor for the conditions of life in the field, since the choice of crop also partially determines the use of pesticides, soil treatment and fertilisation, and the timing of the various operations. It is estimated that the restrictions on the use of pesticides in the 0-scenario would mean a changed crop rotation. Changes in the crop rotation would affect some of those fauna that are not affected by the use of pesticides. Pesticides have a considerable impact on arthropods. They have less effect on springtails and earthworms, but changes in the crop rotation could have a big impact on their populations. For farmland birds, analyses have been carried out of the consequences of both changes in pesticide use and crop rotation.
Impact on the field's arthropods
The lower fauna are affected both directly by treatment with insecticides and indirectly through the removal of plants and microorganisms as food resources through the use of herbicides and fungicides. The effect of the different types of pesticide is partially specific and proportional to the frequency of treatment with fungicides, herbicides and insecticides (see figure 10.3). In comparisons of the scenarios, the treatment frequency index is therefore an indicator of the undesirable side-effects of pesticide use on individuals, species and communities of flora and fauna, assuming that the treatment frequency index is an expression of the size of the treated area. If treatment with herbicides were omitted, the insect fauna above the ground could be expected to increase by a factor of 2-7, measured as individuals, and by a factor of 1.5, measured as number of species per sample. If treatment with fungicides were omitted, the fungivorous insect fauna would increase for a time by a factor of 1-2.5. If insecticides were not used, the insect fauna would increase by a factor of 2-4 (Elmegaard and Axelsen 1999, from various sources). The effect of fungicides and insecticides is often shorter than the effect of herbicides because the elimination of weed affects the fauna all through the season.
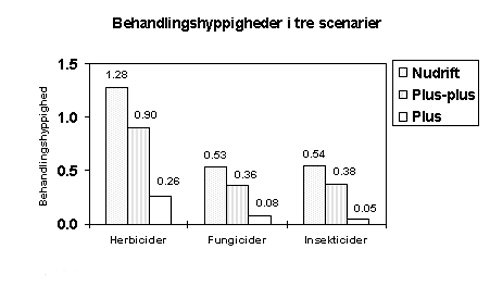
Figure 10.3
The treatment frequency indices for herbicides, fungicides and insecticides in
present production (1994), the +scenario and the ++scenario. The figure does not cover
growth regulators, molluscicides, etc.
(Figure texts
Behandlingshyppighed i tre scenarier = Treatment frequency indices in three scenarios
Behandlingshyppighed = Treatment frequency index
Nudrift = Present production
Plus-plus = ++scenario
Plus = +scenario
Herbicider = Herbicides
Fungicider = Fungicides
Insekticider = Insecticides)
Analyses of crop diversity at a general level do not reveal any changes in the national level between present production and the 0-scenario because differences between the crop rotations in the different types of farm counterbalance each other (Elmegaard, Axelsen 1999).
Springtails
The springtails or collembola are a group of soil organisms that is rich in species. They participate in the decomposition of dead organic matter and the release of nutrients in the soil. From springtail counts in different crop rotations in Denmark, Elmegaard and Axelsen (1999) have estimated that the average density is 21,000 springtails per square metre in arable land. Particularly in clover grass and fields fertilised with manure, the density is high – approaching 100,000 individuals per square metre. On the basis of the crop distribution, the density has been calculated for the crop rotation in present production and the 0-scenario. On the basis of existing studies it is estimated that the pesticides used in the scenario for present production have no effect on the density of springtails. The analyses show that the 0-scenario would increase the average individual density by only 2.4% compared with present production, see figure 10.4. Since the density of springtails is far more dependent on the crop rotation and other production factors, an analysis has been carried out for consistent use of second crops in spring crops. Here, it is cautiously assumed that the density of springtails would double in spring crops if second crops were used to keep the soil covered with plants almost all year round (Elmegaard, Axelsen 1999). The analyses show that, with this, the average density would increase 14%. It can thus be concluded that the density of springtails is not affected by pesticides used in the scenario for present production, but that the crop rotation, including soil treatment, fertilisation and possible second crops, plays an important role in the population density.
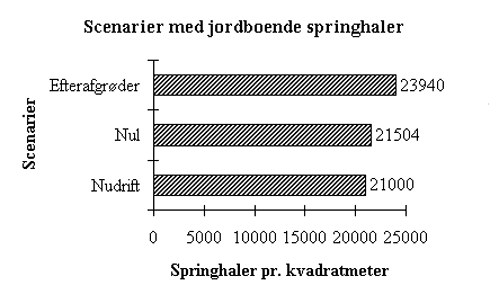
Figure 10.4
Calculations of the average density of springtails in the soil in present
production and the 0-scenario. The indices were calculated by Petersen and Jensen (1998)
on the basis of data from Petersen (1996), using the crop rotations proposed by the
Sub-committee on Agriculture. A comparison has also been carried out with the organic
scenario.
(Figure texts:
Scenarier med jordboende springhaler = Scenarios with springtails in the soil
Scenarier = Scenarios
Efterafgrøder = Second crops
Nul = Zero
Nudrift = Present production
Springhaler pr. kvadratmeter = Springtails per square metre)
Earthworms
Earthworms are most numerous in meadows. A Danish study has shown that the biggest average density of 400 individuals per square metre is found in reploughed clover-grass fields (Christensen, Mather 1997). As in the case of springtails, it is believed from the existing studies that the well-being of the various species of earthworms is not affected by the pesticides used in the scenario for present production but is affected by soil treatment, the use of manure and the crop rotation. The same method of analysis has been used as for springtails (Elmegaard, Axelsen 1999). The results of the analyses show that the crop rotation elements used in the 0-scenario would increase the average density of earthworms in farmland by 12.4%, as shown in figure 10.5. If, instead of commercial fertiliser, 25 tonnes of pig manure per hectare were used, the density of earthworms would increase by about 25%. For comparison, the density in a clover-grass field is shown. There, the highest value is reached one year after reploughing. It can thus be concluded that the density of earthworms is not affected by the pesticides used in the scenario for present production but is greatly affected by soil treatment, the use of animal manure and, particularly, the crop rotation.
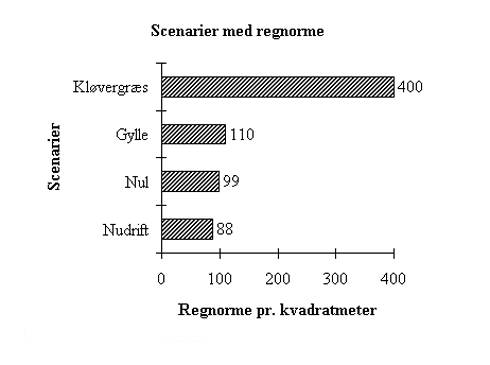
Figure 10.5
Calculations of the average density of earthworms in present production and the
0-scenario. For comparison, calculations are shown for the average density with use of pig
manure and the density in clover grass one year after reploughing.
(Figure texts:
Scenarier = Scenarios
Scenarios with regnorme = Scenarios with earthworms
Kløvergræs = Clover grass
Gylle = Pig manure
Nul = 0-scenario
Nudrift = Present production
Regnorme pr. kvadratmeter = Earthworms per square metre)
Scenarios with birds
There are a number of characteristic bird species in Danish farmland. Their population development and distribution in the landscape have been studied as an element of research on the impact of pesticides on nature and the environment (Petersen, Jacobsen 1997). With this knowledge it is possible to carry out simple calculations of how the bird populations would develop in the different scenarios for land use and pesticide use (Petersen, Jensen, 1998).
Methods and calculations
There have been some studies that do not directly contain data that can be used for scenario analyses because they cannot be generalised or have been collected in conditions that do not reflect present-day Danish agricultural conditions (Petersen, Jensen, 1998). The calculation used is based on data from three years' counts of birds in the breeding season at 54 large Danish farms, where information was available on crop and biotope conditions, together with data on all pesticide treatment. The distribution of the different species in relation to biotope conditions, crops and treatment frequency indices could then be calculated and tested by means of covariance analyses. These data have been reanalysed, so the logarithm for a given species' population density in each crop is expressed as a linear function of the treatment frequency index, while the effects of the other biotope conditions are kept constant. The treatment frequency indices for the pesticides that have shown statistically significant effects and the areas used for the crops have been varied in the analyses.
Assumptions and uncertainties
It is assumed that the average field size remains unchanged, that there are no general changes in the amount of hedgerow and other hedge vegetation, that the number of small biotopes does not change and that the natural content of the farmland generally remains unchanged. It is also assumed that the population density of each species can be calculated independently of other species. Lastly, it is assumed that if herbicides and insecticides act simultaneously, then the total effect will be the product of their effects, i.e. a mutually intensifying effect. Lastly, it is assumed that the calculated population densities can be extrapolated to national level without taking account of the localities' bearing capacity. The calculated population increases can therefore be interpreted as an upper limit for the changes that could be expected.
Results of the calculations of bird populations
The results of the calculations are shown in figure 10.6. It will be seen that the populations of partridge, whitethroat and yellowhammer increase in all scenarios compared with present production and that all the scenarios show significantly increased population density for these species. This applies to the 0-scenario, the +scenario and the ++scenario. For the other species, the index would be unaffected by the use of pesticides, compared with present production. It is noteworthy that the countrywide population density of the skylark is not affected by the use of pesticides. In studies described in section 5.1, it has been found that the use of pesticides reduces the production of young as a consequence of effects on food resources. However, the relationship between the annual production of young and the population trend is not known (Elmegaard, Axelsen 1999; Petersen, Jensen 1998). Similarly, we do not know precisely how increased reproduction at field level is reflected at farm level because the redistribution of young birds in the following season depends on the density of older birds, the crop rotation, etc., and only to a minor extent on the fields' ownership conditions (farm characteristics). The partridge is adversely affected by herbicides, while the population density of whitethroat and yellow bunting is affected by both herbicides and insecticides.
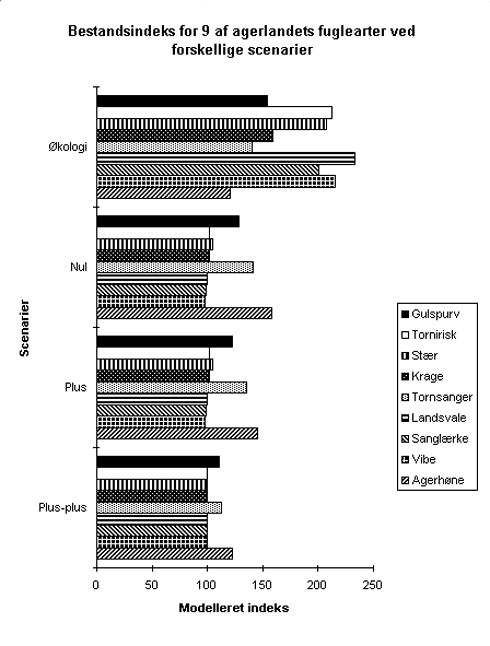
Figure 10.6
Calculated population indices for nine species of farmland birds in different
scenarios, with present production put at index 100. The indices were calculated by
Petersen and Jensen (1998) on the basis of data from Petersen (1996), using the
agronomically and economically optimised crop rotations proposed by the Sub-committee on
Agriculture. A comparison has also been carried out with the organic scenario.
(Figure texts:
Bestandsindeks for 9 af agerlandets fuglearter ved forskellige secenarier = Population
index for nine farmland bird species in different scenarios
Scenarier = Scenarios
Økologi = Organic scenario
Nul = 0-scenario
Plus = +scenario
Plus-plus = ++scenario
Modelleret indeks = Modelled index
Gulspurv = Yellowhammer
Tornirisk = Linnet
Stær = Starling
Krage = Crow
Tornsanger = Whitethroat
Landsvale = Swallow
Sanglærke = Skylark
Vibe = Lapwing
Agerhøne = Partridge)
Comparison of weed control with and without pesticides
The model does not include non-chemical weed control. Since the direct toxic effects on birds today are insignificant (see section 5.1), it is the indirect impacts that would be important, e.g. changes in the birds’ food resources. In this connection, it makes no difference to the birds whether their food resources are removed by means of pesticides or by mechanical or other methods. Inter-row cultivation and harrowing could constitute a risk to ground-nesting species. Similarly, early and/or more extensive soil preparation in the autumn would very probably have considerable, adverse effects on the birds because stubble fields are a very important foraging area for many species in the autumn months. Furthermore, in the wintertime, the birds get more from a stubble field than from a field with winter crops (Petersen, Jensen 1998).
Comparison with the organic scenario
For all the species with the exception of the partridge and, to some extent, the whitethroat, the calculations show a significantly larger number in the organic scenario than in the 0-scenario. This indicates the importance of the crop rotation to birds since pesticides are not used in these two scenarios. The organic scenario is based on observations at organic farms in 1980s, when the forms of production and land use differed from present-day organic farming. This applies particularly to the size of dairy herds (Petersen, Jensen 1998). Only relationships that have a significant effect on the occurrence of the species are included in the model analyses. This does not mean that the effects that produce insignificant outcomes in the underlying study are of no importance. They are simply not included in the model.
In the scenarios used, it is assumed that the number of dairy farms and grass pasture acreage are unchanged. If this were not the case, the populations of a number of species would presumably be considerably more affected than by other changes in land use. The lapwing, the swallow and the starling are thus favoured by organic production because they are linked to dairy farming and grass pasture land.
Impacts on the fauna in forests
In all the scenarios described, phasing out pesticides in forests would increase the value of the biotope of the stands in which pesticides are used today. Christmas tree and ornamental greenery stands would become a more attractive habitat for many birds because of a richer fauna. The same applies to herbivorous mammals because there would be more food. Depending on whether mechanical control of grasses, herbaceous plants and "scrub" was practised, the 0-scenario would have beneficial effect on the fauna living in forest-floor vegetation, whether as a habitat or as a food resource for herbivores. Effective mechanical weed control and, especially, deep ploughing are more harmful than pesticides. The use of pesticides in nurseries would not affect the forest fauna in all the scenarios described. It is thought that there would be some replacement of pesticides with mechanical or biological control. In the +scenario and the ++scenario, the use of insecticides would be allowed in ornamental greenery and Christmas tree cultures to combat insects that threatened the production if there were no alternative methods. This means that the value of these biotopes would remain poor for insectivores such as insects and vertebrates.
10.3.2 The flora in cultivated and uncultivated terrestrial ecosystems
Models for calculation of the seed pool and wild plants in the field
The development of plants over 25 years has been calculated using two different types of mathematical models, a "seed pool" model and a "crop rotation" model (Kjellsson, Madsen 1998b). The models have a number of constraints and have not been fully validated, but they provide a preliminary estimate of the development trends. The seed pool model was developed for continuous spring barley on sandy soil and does not contain a crop rotation (Kjellsson, Rasmussen 1995). It uses five plant species that frequently occur as weeds. The model was validated over three years. The crop rotation model was developed to simulate crop rotations with genetically modified sugar beet and with rape (Madsen et al. 1996; 1999). A crop rotation with sugar beet – barley – winter wheat – winter wheat is used in the sugar beet model, and a crop rotation with winter rape – winter wheat – winter wheat – winter barley is used in the rape model. The model tests 4-6 wild plants, together with volunteers that occur as weed. A rough estimate has also been made of the development of the weed biomass over time. In all three models, two levels of the seed pool are tested. The first level is an average seed content of 6,900 seeds per square metre, which corresponds to the median value for Danish fields in the last study (Kjellsson, Rasmussen, 1995). The other level is 22,000 seeds per square metre, corresponding to the upper limit for 80 per cent of the fields.
Scenarios for analysis of the flora in the field
The models have been used to simulate a scenario for how the seed pool and weed biomass develop over time without any form of weed control. It must be emphasised that the omission of spraying with herbicides is not replaced by suitable crop rotation measures or mechanical/biological weed control. The wild plants thus have the opportunity to increase without hindrance. The scenario has been compared with present production. An intermediate scenario has also been analysed, corresponding approximately to the +scenario since it includes band-spraying of beet crops, control of couch grass every tenth year, use of mechanical weed control and cultivation of resistant varieties.
Results of calculations with the seed pool model
In the spring barley rotation, the calculations show that the seed pool in the soil would steadily increase without weed control (see figure 10.7). In the + scenario, the number of seeds of wild plants in the soil would increase to approx. 18,000 per square metre, taking as the starting point the Danish average (median) of 6,900 seeds per square metre. With 22,000 seeds per square metre, the +scenario would result in an unchanged seed pool. The seed pool model shows that, in all the scenarios, there could be an improvement of the conditions for wild flora and for the species of fauna associated with it without the wild flora proliferating out of control provided mechanical control and limited chemical control were practised.
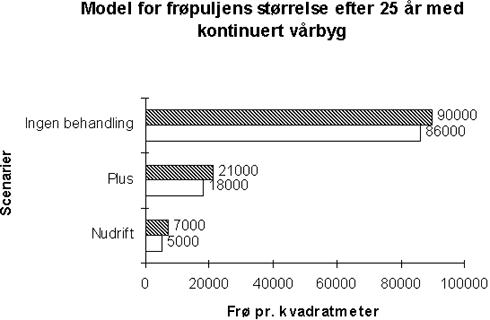
Figure 10.7
Calculations with the seed pool model in continuous spring barley. The bars show
the seed pool after 25 years with an initial seed pool of 6,900 (white bars) and 22,000
(hatched bars) per square metre for present production and the +scenario, respectively. In
the third scenario, no form of weed control is practised.
(Figure texts:
Model for frøpuljens størrelse efter 25 år i sædskifter med vårbyg = Model for the
size of the seed pool after 25 years in crop rotations with spring barley
Scenarier = Scenarios
Ingen behandling = No treatment
Plus = +-scenario
Nudrift = Present production
Frø pr. kvadratmeter = Seeds per square metres)
Results of calculations with the crop rotation model for crop rotations with beets
In the beet crop rotation, as shown in figure 10.8, the calculations show that, with a starting point of 6,900 seeds per square metre, the seed pool would remain largely unchanged for 25 years in the +scenario, in which mechanical weed control is combined with limited use of herbicides. For the larger seed pool of 22,000 seeds per square metre, there would be a fall in the seed pool after 25 years. After only one year in the scenario without treatment, the seed pool would reach its maximum of 60,000 and 95,000 seeds, respectively, per square metre with a starting seed pool of 6,900 and 22,000 seeds. That is because beets in the model have very poor competitiveness, enabling wild plants to proliferate. The average seed pool of approx. 40,000 and approx. 44,000, respectively, would adjust itself after a couple of years and then fluctuate in step with the change in the crop rotation. In the +scenario, in which chemical control of couch grass is only carried out every ten years, there would be problems with couch grass. With both starting points for the seed pool, couch grass would reach its biggest biomass of each individual year on 1 June in the +scenario, since it would largely avoid competition from other seed weed in this scenario. The scenario without any weed control would not be feasible in practice.
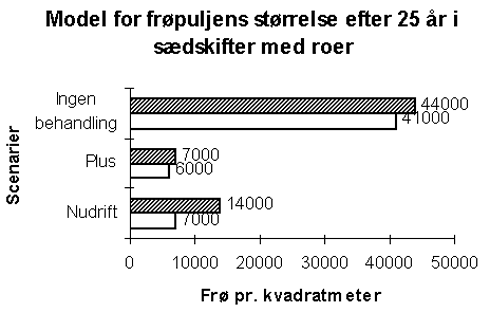
Figure 10.8
The development of the seed pool after 25 years in a crop rotation with beets. The bars
show the size of the seed pool after 25 years. In the +scenario, in which mechanical weed
control is combined with limited use of herbicides, the seed pool remains unchanged when
the starting point is 6,900 seeds per square metre (white bars). For the larger seed pool
of 22,000 seeds per square metre (hatched bars), it will be seen that there is a fall in
the seed pool. In the third scenario, no form of weed control is practised.
(Figure texts:
Model for frøpuljens størrelse efter 25 år i sædskifter med roer = Model for the size
of the seed pool after 25 years in crop rotations with beets
Scenarier = Scenarios
Ingen behandling = No treatment
Plus = +scenario
Nufrift = Present production
Frø pr. kvadratmeter = Seeds per square metre)
In the +scenario, a number of species of wild flora could occur more frequently. A more varied plant community could therefore be expected, providing food resources for a more varied animal community (invertebrates and their predators). However, in view of the poor competitiveness of beets, this crop rotation would hardly be profitable unless new, alternative methods were found for controlling weed in beet crops.
Results of calculations with the crop rotation model for crop rotations with rape
In the rape crop rotation, the results of the calculations of the seed pool are shown in figure 10.9. It will be seen that the seed pool would increase over 25 years if no form of weed control were practised. On the other hand, the +scenario shows a distinct fall in the number of seeds in the seed pool after 25 years compared with present production after 25 years, whether the starting point is 6,900 or 22,000 seeds. One reason for this is that chemical agents have little effect on shepherd's purse, which occurs in this crop rotation, whereas mechanical control is more effective (Kjellsson, Madsen 1998b).
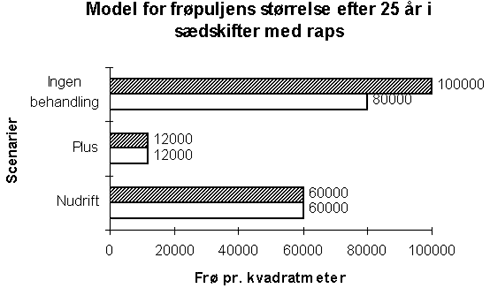
Figure 10.9
Size of the seed pool after 25 years in a crop rotation with rape. It will be seen
that the seed pool would be reduced 4-5 times in the +scenario, in which mechanical weed
control is combined with limited use of herbicides. The bars show the development of the
seed pool from a starting point of 6,900 seeds (white bars) and 22,000 seeds (hatched
bars), respectively, per square metre for present production and the +scenario. In the
third scenario, no form of weed control is practised.
(Figure texts:
Model for frøpuljens størrelse efter 25 år i sædskifter med raps = Model for size of
the seed pool after 25 years in crop rotations with rape
Scenarier = Scenarios
Ingen behandling = No treatment
Plus = +scenario
Nudrift = Present production
Frø pr. kvadratmeter = Seeds per square metre)
According to this model, the seed pool would reach its maximum after 10 years. However, the model probably overestimates the soil's seed pool in both the scenario without treatment and present production (Kjellsson, Madsen 1998b), since the loss of seeds eaten by animals can be put too low. Experimental studies of the seed predation in the field are needed for a better estimate. However, there would be continuous growth of the biomass of couch grass, which does not have a seed pool. The model’s assumptions include effective control of couch grass with herbicides approx. every ten years. In addition, the problem of volunteers would be slightly greater in the +scenario than in present production because mechanical control methods are not fully effective against these species.
In the rape crop rotation, the biomass of the flora without control or with reduced control as in the +scenario would probably not differ significantly from the situation in present production because of the biomass of couch grass. Despite the smaller plant biomass in the +scenario compared with present production, a number of plant species would probably occur more frequently in this scenario because the present one-sided proliferation of pesticide-tolerant species would be reduced. A more varied plant community could therefore be expected, providing food resources for a more diversified animal community (invertebrates and their predators).
The importance of the +scenario for the seed pool and plant density
In the +scenario, both the herbicide dosage and the treatment frequency index would probably be somewhat reduced compared with present good farming practice. At the same time, increased use of mechanical weed control would partially compensate for the reduced effectiveness of the chemical control. On average, the consequence would probably be, at most, a 10-20% larger total seed pool than in present production.
Impacts on the wild flora in hedgerows and small biotopes
Spray drift of herbicides affects the flora in biotopes close to the field, such as hedges, field borders and ditches, and along watercourses and ponds. Within a few metres of the edges of the field, lethal effects can be observed in a number of plant species. The dose and thus the effect normally decrease rapidly with distance from the field, which means that only sub-lethal effects on plant growth and seed production are normally seen outside the local zone around the field. The magnitude of the effect depends on the sensitivity of the plant species, the composition of the plant community and the condition of the vegetation. Several studies have shown effects of spray drift over a distance of up to 50 metres from the sprayed area (Marrs et al., 1989, 1993; Davis et al., 1993, 1994). However, most of the flora were only affected in an area between 0 and 5 m from the field. However, there is a lack of experimental data on effects of herbicides in low doses on wild plant species, and the extent of spray drift and its effect on wild flora have not been systematically studied in Denmark. Both the 0-scenario and the +scenario would reduce the consumption of herbicides and thus the risk of spray drift to land close to the field. This would considerably reduce the load, whether spraying was discontinued altogether or was only carried out occasionally. However, owing to the lack of data, it is not possible to quantify the beneficial effect on the vegetation. The areas affected would be reduced in step with the herbicide consumption. In the 0+scenario, the impact would be reduced to the few localities in which pesticides were still used. In the 0-scenario, there would no longer be any impact on the neighbouring areas.
Besides being affected by herbicides, areas close to the field are normally seriously affected by nutrients supplied from the field, which contribute to a change in the composition of the flora towards a greater content of grasses and the loss of annual and sensitive perennial herbaceous plants. The established, nutrient-demanding vegetation of species of grass and tall perennials, such as creeping thistle, common nettle and cow-parsley, counteracts immigration of other species. Species with short-lived seeds, such as cornflower, anemone and scabious, often die out, making reestablishment from the seed pool impossible. All in all, this means that, in many places, a reduced herbicide load on the neighbouring areas would not result directly in changes in the plant communities in the direction of greater diversity unless there were a significantly reduced supply of nutrients and, at the same time, physical measures, such as mowing and thinning, which open the vegetation to invasion from outside or to germination of seeds in the seed pool.
The wild flora in natural areas
The diffuse dispersal of herbicides from cultivated land must generally be regarded as having little effect on the flora in natural areas except where these are directly adjacent to cultivated land. Reduced use of herbicides on cultivated land would therefore have little effect on the composition of the flora, which depends to a far greater extent on the management of the area and the supply of nutrients. There are a few research results that indicate a probability of sublethal effects from the deposition of herbicides from the atmosphere. One can thus not exclude the possibility of damage to sensitive species of flora outside cultivated land as a consequence of herbicides in rainwater. There are very few measurements of the occurrence of herbicides in rainwater and in dry depositions in Denmark, and only a few substances have been included in the measurements. Furthermore, there are only a few studies of the sensitivity of wild flora and plant communities to sublethal doses of herbicides.
Impacts on the flora in forests
In the assessment of the effects in forests, special definitions have been used, as described in section 10.3.1. If herbicides were no longer used in forests it would in time be possible to recreate a forest-floor flora that was naturally adapted to the local soil and climatic conditions. However, mechanical control of undesirable vegetation in the form of deep ploughing over large areas could have the same direct effects on the flora as herbicides and thus also the same indirect effects on the associated fauna. Besides these, there would be adverse effects on soil fauna, fungal flora, the soil profile and historical monuments. Where natural rejuvenation is not used, it is important for the forest-floor flora that areas are left untreated and that rejuvenation is in the form of shelterwood regeneration with preservation of the choice of tree species. The use of herbicides in Christmas tree and ornamental greenery cultures in the +scenario and the ++scenario would result in continued low biodiversity of the flora in the areas in question unless alternative, environment-friendly methods were found.
10.3.3 The aquatic environment
On the basis of data for the intrinsic properties with respect to degradability and toxicity, and values from the literature for run-off and spray drift of pesticides from fields to aquatic environments, a dynamic model has been set up for estimating concentrations and effects of pesticides in a model pond that is typical for Denmark. The degree of effect has been estimated with the present treatment frequency index and in scenarios with reduced treatment frequency indices and a changed crop distribution. The effects of the use of pesticides on flora and fauna in freshwater have been calculated by means of dynamic model built up with the simulation tool Stellaâ (Møhlenberg, Gustavson 1999). No Danish or relevant international data are available for a similar estimation applied to streams and lakes. On the basis of existing measurements, Møhlenberg and Gustavson (1999) assume that surface run-off only occurs in events with precipitation of more than 10 mm per day. The variations in the precipitation are simulated in the model so that the events occur at random and, on average, 2-3 times a year.
The pond model
In the model, the size of the pond varies with the season, the maximum size being reached in March-April (450 m3, depth 1.5 m) and the minimum size in September (30 m3, depth 0.5 m). This variation is typical for Danish ponds and corresponds to the surface run-off from an area of approx. 2-3 ha. The size determines the proportion of a pesticide that is deposited by spray drift and the concentration of the pesticide in the water. The Danish rules on distance to an aquatic environment when spraying with the individual pesticides (i.e. 2, 10 and 20 m) are incorporated in the model and it is assumed that spraying is not done closer to the aquatic environment than 2 metres. When pesticides are sprayed in mixtures, the biggest distance requirements for the individual pesticides in the mixture are used for the entire mixture. The model does not include transport of pesticides via rainwater or long-distance atmospheric transport. It is also assumed that the wind comes from only one direction. Lastly, it is assumed that the pond does not receive water from drains or from groundwater. If the treatment frequency index is 0.1, that corresponds to the pond being exposed once every 10 years. The data used for the simulation are data from toxicity tests in the laboratory.
Spraying scenarios
Unlike the other scenarios, the scenarios for the aquatic environment are based on the plant protection product statistics for 1997. Models have been constructed for the main crops – cereals (winter and spring cereals), rape (winter and spring), potatoes, beets, peas and maize. In the model, the consumption of pesticides (primarily glyphosate) on "areas treated post-harvest" is linked to the cultivation of cereals (winter cereals). The dosage and time of application of the various pesticides have been taken from "Guide to Plant Protection" (Danish Institute of Agricultural Sciences 1998). The effect on the aquatic environment from grass-seed and vegetable production, market gardens and forestry, has not been included in the study. Growth regulators are not included because the treatment frequency index in 1997 was only 0.05.
The following special scenarios for treatment frequency index and crop distribution have been analysed (Møhlenberg, Gustavson 1999):
| 2.34-scenario. Corresponding to present production but with a treatment frequency index of 2.34 and a crop composition based on 1997 data. |
| 1.17-scenario. A 50% reduction in the treatment frequency index for all crops compared with the 2.34 scenario, with unchanged crop composition. |
| 0.59-scenario. Compared with the 2.34 scenario, this scenario is characterised by a radical restructuring of cultivated areas to comprise only cereal fields and set-aside, relatively more spring cereal than winter cereal, a 50% reduction of the treatment frequency index in winter cereal and only one tenth the treatment frequency index in spring cereal, making the average treatment frequency index 0.59. |
| 0.26-scenario. Compared with the 2.34 scenario, this scenario is characterised by a switch from winter cereal to spring cereal, increased set-aside and preservation of acreages used for potatoes, rape, beets, peas and maize. The average treatment frequency index is 0.26. |
As a general rule, the spraying scenarios are built up with the most widely used pesticides. Pesticides with a low treatment frequency index (< 5%) are generally not included in the model if homologously acting pesticides are used on a large area. Specifically acting pesticides against, for example, wild oat-grass, are included, however, even though the treatment frequency index is low. For dressing agents and herbicides that are incorporated after application, the risk of transport to the aquatic environment is assumed to be low. They are therefore not included in the model. The model takes into account the temperature-dependent degradation of the pesticides. Spray drift constitutes not more than 1% of the area dose at a distance of 2 metres in March-April, when the pond reaches its maximum size. In practice, the transport via spray drift is lower in the model owing to adjustment for the area and cross section of the pond, and the wind is assumed to blow in one direction. The model does not include transport of pesticides via rainwater or long-distance atmospheric transport. It can be assumed that the surface run-off of pesticides constitutes 0.2% of the pesticide pool from the nearest 2 hectares in the field during precipitation events of more than 10 mm per day, as described in section 4.6.1.
Results of the model calculation, impacts on algae and crustaceans
The simulations show that, all else being equal, the use of pesticides in winter cereals, potatoes, root crops and peas constitutes a major risk to the flora and fauna in ponds. Less burdensome crops are spring cereal, spring rape, maize and, to some extent, winter rape. The model predicts that the critical pesticides for algae and aquatic plants (macrophytes) in ponds are isoproturon, glyphosate, fenpropimorph, ethofumesate, metamitron, pendimethalin, metribuzin, prosulfocarb, mancozeb, maneb and clopyralid. Crustaceans and insects are largely equally sensitive, and the simulated effects on crustaceans can in principle be considered to apply to insects as well. The critical pesticides with respect to effects on crustaceans and insects are esfenvalerate, propiconazol, pendimethalin, metribuzin, prosulfocarb, mancozeb and maneb. If there are no run-off events within a growth season, the only source of load on the pond is spray drift. The analyses show that this supply is only of importance in the case of esfenvalerate, with a 6-9% reduction in daphnia biomass.
Probability of effects
Assuming that the ponds in Denmark are distributed at random in the land under cultivation, the average pesticide load on ponds is calculated on the basis of the model's predictions concerning effects on individual crops and the area covered by individual crops. The 0-scenario is not included in the calculations because the probability of effects would be close to 0% assuming that the precipitation's content of long-distance-transported pesticides would not have any effect in ponds. The calculation shows quite a considerable probability of effects in both the 2.34 and the 1.17 scenarios, see figure 10.10. The probability of more than 10% inhibition of algae is about 85% in the 2.34 scenario and about 45% in the 1.17 scenario, about 20% in the 0.59 scenario and about 10% in the 0.26 scenario.
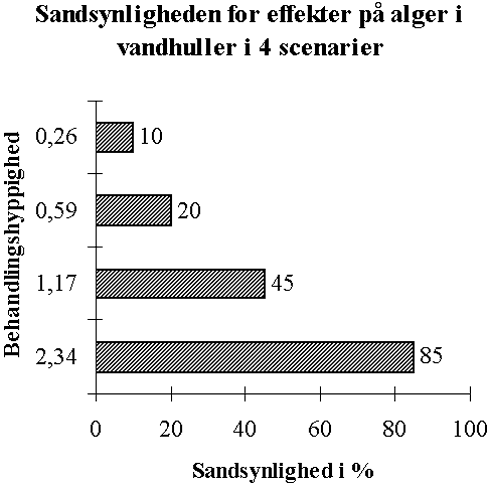
Figure 10.10
The model-based probability of effects on algae in typical Danish ponds in four
scenarios with different crop distribution and treatment frequency index (from
Møhlenberg, Gustavson 1999).
(Figure texts:
Sandsynligheden for effekter på alger i vandhuller i 4 scenarier = Probability of effects
on algae in ponds in 4 scenarios
Behandlingshyppighed = Treatment frequency index
Sandsynlighed i % = Probability in %)
Correspondingly for crustaceans, the probability of effects with more than 10% inhibition is about 55% in the 2.34 scenario, about 25% in the 1.17 scenario, about 15% in the 0.59 scenario and about 10% in the 0.26 scenario, as shown in figure 10.11.
Halving the treatment frequency index greatly reduces the probability of effects, since several years pass between events where considerable effects can be expected. As an example, in potatoes, the frequency of 100% inhibition of crustaceans decreases from 70% in the 2.34 scenario to about 35% in the 1.17 scenario. Correspondingly, the frequency of events with sublethal inhibition (up to 10% effect) is halved from 100% in the 2.34 scenario to 50% in the 1.17 scenario (Møhlenberg, Gustavson 1999).
It can thus be concluded that the model calculations for ponds show a probability of effects on both flora and fauna as a consequence of run-off in all four scenarios. The probability of effect falls with the quantity of pesticides used in the scenarios.
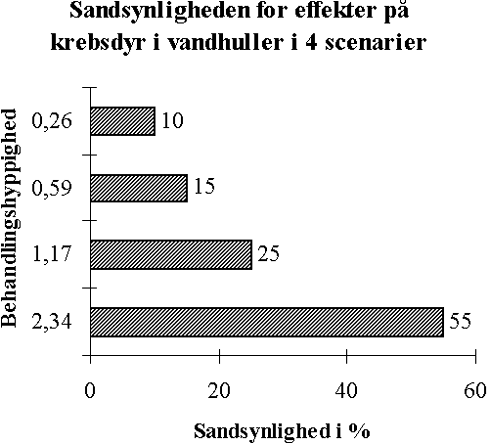
Figure 10.11
The model-based probability of effects on crustaceans in typical Danish ponds in 4
scenarios with different crop distribution and treatment frequency index (Møhlenberg,
Gustavson 1999).
(Figure texts:
Sandsynligheden for effekter på krebsdyr i vandhuller i 4 scenarier = Probability of
effects on crustaceans in ponds in 4 scenarios
Behandlingshyppighed = Treatment frequency index
Sandsynlighed i % = Probability in %)
10.4 Exposure of humans
10.4.1 Exposure of, and effects on, the sprayer operator
Many of the existing loads and effects from the working environment in agriculture would be the same, whether pesticides were used or not. On the other hand, the exposure to pesticides would decrease with decreasing use of the substances. In field spraying, the risk of exposure in one working day can be 1000 times greater than the daily intake via food products. If protection aids are not used, this risk can be considerably greater.
Mechanical weed control
With the present equipment for mechanical weed control, the time spent driving a tractor would presumably increase. Compared with spray booms, which have a width of 12-36 metres (most of them are 12-24 metres), such tools as weed harrowers with a width of 12 metres and brush weeders, which only handle a few metres at a time, would mean more time spent driving a tractor. However, for the biggest crop, cereals, harrowing 2-3 times would often be sufficient. That corresponds to a number of field runs close to the treatment frequency index for cereals in conventional farming, particularly when spraying against insects and fungi is included.
When combating weeds in special crops, such as onions, carrots and leeks, mechanical inter-row cultivation can be used. As things are today, this has to be followed by manual weeding in the rows. This means workers down on their knees removing weeds. In some places an attempt has been made to solve this problem by using instead a slanting trolley drawn by a tractor. Up to 10-15 people lie side by side on the trolley, removing weeds as the tractor moves along at 500-600 metres per hour. At small production units, weeds could be removed in the "old" way, using hoe and hands. This form of weed control requires a lot of people. It has been calculated that 75,000 persons are needed in a 4-week period for weeding in beets with the present beet acreage. An organic farmer who has tried both manual weeding, using workers lying on a special trolley, and "old-style" weeding estimates that use of the trolley saves a lot of manpower in the 3-5 week period in which weed has to be removed in special crops. The arrangement of the workplace in connection with weed control in special crops has not otherwise been assessed in practice.
Manual weeding with a hoe can be done standing or kneeling or lying on a trolley. All these work postures strain the body, even when the work takes place over a relatively short period. The work can be regarded as MRW (monotonous, repetitive work). Persons working on their knees or squatting are at risk of increased damage to their knees, back and neck/shoulders. The longer the time spent on the work, the greater the risk. However, there are technical and other ways of establishing satisfactory working conditions by changing the planning of the work and its performance.
Other factors
The risk of accidents is deemed to be the same in the different scenarios. There would perhaps be an increased risk associated with more repair and maintenance work because more tools are used in mechanical weed control in the scenarios with reduced use of pesticides.
The 0-scenario and the intermediate scenarios are not in themselves deemed to cause more cases of hearing damage. Since there is an unknown number of old tractors still in use in agriculture, there will continue to be situations in which noise and vibrations can have injurious effects. For farmers who do not feel safe using pesticides, the scenarios with significantly reduced use of pesticides could provide a better mental working environment.
10.4.2 Scenarios for the population's intake of pesticides
The occurrence and intake of pesticide residues in food products are described in section 6.2. Roughly 60% of this intake occurs through imported food products. The predominant sources of exposure are vegetables and, particularly, berries and fruits. The sources of information on this are the annual reports from the Veterinary & Food Administration, which has carried out countrywide random sampling and monitoring of pesticide residues in both vegetable and animal food products on the Danish market for many years. In 1996, the most frequently detected pesticides were (in alphabetical order): captan, carbendazim, chlorothalonil, dithiocarbamates, endosulfan (sum), iprodione, quintozene, tolylfluanide and vinclozolin. None of the finds gave the Veterinary & Food Administration cause for concern with respect to public health (Büchert, Engell 1998).
There is a lack of data on the distribution of Danish consumption between Danish and imported food products. The main reason for that is, that with the "internal market", official statistics are no longer kept of imports and exports between the Member States. On the basis of earlier trade figures and agricultural statistics, it has been estimated that the distribution between imports and domestic production is 1:1 for such fruit as apples, pears, plums, berries, etc., while exotic fruit, such as citrus fruit and kiwi, are all imported food products. For vegetables, the distribution is about 1:4, although not for cucumber, tomatoes and similar, where imports, distributed over the whole year, account for about 70% of the total consumption. In the case of cereals, maize and rice are exclusively imported food products, while the consumption of barley is based entirely on Danish products. In the case of rye, wheat and oats, 5%, 20% and 65%, respectively, of consumption is covered by imports.
The Dane's dietary pattern and daily intake of pesticides
The variation in the Danish consumers' dietary pattern can be judged on the basis of the National Food Agency's dietary study in 1995. The results of this study, which covered more than 1,800 persons, are summarised in table 6.2 in section 6.2. This table gives the average intake and selected fractiles for the adult population. The intake of pesticide residues was calculated as described in section 6.2 for all the pesticides detected in the studies of fruit and vegetables in 1996 and 1997. The intakes from Danish and imported food products were calculated separately, without detailed specification of the origin of the products (for details, see Büchert 1998). The results show a total average intake of pesticides of 190 microgrammes per day. The intake of 6 pesticides/groups of pesticides, carbendazim, dithiocarbamates, iprodione, o-phenyl-phenol, procymidon and thiabendazol, corresponds to half the total intake, while the other half is distributed over about 60 individual compounds.
The total average load from food products is estimated to be approx. 200 microgrammes of pesticide per day, more than half of which comes from some few types of food products – namely, citrus fruit, potatoes and apples. Around 60% comes from imported products and 40% from Danish products. There are big variations in the calculated numerical values, and, in practice, the total intake is estimated to lie between very low and about 600 microgrammes per day. However, since most of the residual content in citrus fruit is in the peel, which is not eaten, the actual daily intake of pesticides is less than 200 microgrammes per day. In this estimate, the intake via Danish products accounts for more than 50% of the total intake.
Calculation of the daily intake in different scenarios for reduced use of pesticides
The calculations of the daily intake cover both Danish and imported food products. Assuming that the diet's relative composition of Danish and imported food products does not change, the daily intake can be estimated for the scenarios set up. These involve a reduction of the use of pesticides in Denmark of 31% in the ++scenario, 80% in the +scenario, 95% in the 0+scenario and 100% in the 0-scenario. The results are shown in figure 10.12.
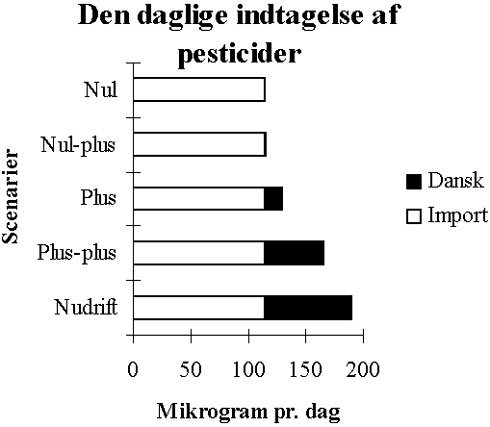
Figure 10.12
Simple calculation of Danes’ intake of pesticides assuming unchanged size of
import and pesticide residues. In present production, approx. 60% of the intake of
pesticide residues comes from imports, which dominate the intake in all scenarios,
including a total phase-out of pesticide use in Denmark.
(Figure texts:
Den daglige indtagelse af pesticider = Daily intake of pesticides
Scenarier = Scenarios
Nul = 0-scenario
Plus = +scenario
Nudrift = Present production
Dansk = Danish
Import = Import
Mikrogram pr. day = Microgrammes per day)
It will be seen from figure 10.12 that the pesticide residues from imported food products, which dominate the intake in all scenarios, would still be there with a total phase-out of pesticide use in Denmark. One can conjecture about changes in the Danish population's dietary pattern in the event of a partial or total phase-out of pesticides, but such predictions are very uncertain. They would depend, for example, on the development of society both in Denmark and elsewhere and on the derivative market mechanisms, which are discussed in the report from the Sub-committee on Production, Economy and Employment. It is basically assumed that the intake via imported food products would remain unchanged despite movements between the individual products. As described in section 6.2.4, peeling of citrus fruit means less than 200 microgrammes per day, but at the same time, crops produced in Denmark would contribute more than 50% of the daily intake.