Environmental Project no. 628, 2001
1998 Fuel Use and Emissions for Danish IFR Flights
Contents
Preface: Background and objectives
During recent years more and more attention has been paid to various environmental impacts from aircraft emissions, especially when released into the atmosphere at upper-tropospheric and lower-stratospheric flying altitudes. The environmental effects are both related to global warming from greenhouse gases and perturbations in atmospheric ozone concentrations, which in turn affects the solar ultraviolet radiation balance. The effects become more important considering the present development in the air traffic sector and future expectations for air travel demands. The air traffic passenger kms travelled globally are projected to grow about 5% per year for the next 20 years to come. Even though future aircraft will become increasingly more fuel efficient, this cannot prevent a global fuel penalty of about 3% within the same time period (IPCC, 1999).
The environmental problems associated with air traffic can only be effectively addressed via international co-operation at many levels. One of the means is the establishment of emission conventions. Parties are obliged to bring down the emission budget according to agreed emission targets, and the submission of sectorial emission information in turn reveals the aircraft sector share of the total emissions. CORINAIR (COoRdination of Information on AIR emissions) is the European air emission inventory programme coordinated by the European Environment Agency for annual sector-wise national emission estimates. CORINAIR consists of inventory guidelines for each sub-sector and an emission database with an output format suited for reporting to both the United Nations Framework Convention on Climate Change (UNFCCC) and the United Nations Economic Commission for Europe (UNECE) conventions. For air traffic the UNECE transport expert panel assists the development of the inventory guidelines.
Until recently the CORINAIR methodology for aircraft emissions encompassed only guidelines for fairly detailed Landing and Take Off (LTO) and more rough cruise emission estimates (CORINAIR, 1996). Strong efforts have since been made by the UNECE transport expert panel to improve the CORINAIR methodology in terms of more updated and detailed information on fuel use and emissions (CORINAIR, 1999). Some of the expert panel members have also joined the ANCAT/EMCAL (Abatement of the Nuisances Caused by Air Transport/sub-group on EMission CALculation) working group formed under ECAC (European Civil Aviation Conference). The gathering of experts from many European institutes involved with simulation models and inventory work has made it possible to feed new information on fuel use and emissions into the CORINAIR methodology in areas where previously few or no data were available. Another spin-off expected from this work is that a recommendation will be dealt with by ANCAT probably later this year encouraging ECAC member states to use the new CORINAIR methodology calculating national aircraft emission estimates.
The largest improvement of the CORINAIR methodology is the inclusion of fuel use and emission data per distance flown. On the other hand this detailed data makes the actual calculation procedure more difficult and time consuming to perform. Information on air traffic statistics is needed on a pr flight level and much effort is needed to group all aircraft into representative types.
The objectives of this project are 1) to make an operational procedure for calculating aircraft emissions according to the new CORINAIR guidelines, 2) on the basis of this to recommend changes in national emission estimations and 3) to develop a tool for assessing fuel use and emissions for individual flights. The objectives will be met by establishing an emission inventory for IFR (Instrumental Flight Rules) jet and turbo-prop flights from Danish airports in 1998. Due to a lack of data emission estimations will not be made for helicopter operations, military flights and piston-engined aircraft movements.
Key tasks are to gather flight data and information on aviation codes for airports and countries. From this a proper categorisation can be made of all flights from Denmark in 1998 by origin and destination airports and their representative aircraft types. Another important part is to obtain consistent information on fuel use and emissions for representative aircraft types. Sufficient grouping of flights and the availability of corresponding fuel use and emission data facilitates the calculation procedure. Final results will be fuel use and emission estimates for domestic and international LTO and cruise.
Chapter 1 gives an overview of the environmental effects from aviation. In chapter 2 international conventions are described related to emissions from air traffic. The current CORINAIR model version for aircraft inventories is documented in chapter 3. The new version of the model is explained in chapter 4 in terms of input, the calculation procedure and the computed results. A comparison with current CORINAIR results, findings from international inventories and special simulations for Danish domestic flights will be made in chapter 5. The final chapter outlines the conclusions of the present project.
The project was funded by the Danish Environmental Protection Agency (DEPA). The steering group consisted of Hugo Lyse Nielsen and Miloslav Zakora, both DEPA, Nic Michelsen, Danish Civil Aviation Administration (CAA-DK) and Morten Winther, National Environmental Research Institute (NERI).
In this project acknowledgements should be made to Bruno Nicolas, Eurocontrol, and Johnny Funder, CAA-DK, for supplying information on flight data and ICAO aviation codes translations, respectively. Also many thanks to Monika Kudrna and Manfred Kalivoda, Psia-consult, to Robert Falk, DTI and to Anders Hasselrot and Jan Westerberg, FFA, for providing fuel use and emission data for the calculation part. Kristin Rypdal, Statistics Norway, and Reidar Grundstr�m, Swedish Civil Aviation Agency, should also be thanked for their co-operation to implement Swedish emission data into the CORINAIR databank. Thanks are also given to Peter Schøn and Lars Henrik Olesen from Copenhagen Airport for providing information on aircraft type classifications. Thanks to Rikke Næraa, Danish Railways, for providing data on energy consumption on trains and to Anne Mette Jørgensen, DMI, for reviewing the text on environmental effects.
Sammenfatning
Flytrafikken har ligesom andre transportformer forskellige miljøeffekter såsom støj,
lugtgener og luftforurening. Desuden beslaglægger flyvepladserne egne arealer og
begrænser samtidigt arealanvendelsen omkring flyvepladserne. For luftforureningens
vedkommende er to miljøeffekter specielt vigtige: Den globale opvarming og nedbrydelsen
af ozonlaget. Trafikken med fly er steget betydeligt i de senere år og forventes at stige
med 5% årligt i de næste 20 år. Den største del af flyvningen foregår i flyenes
cruisehøjde, hvor emissionerne er mere miljøskadelige end ved landjorden.
For at nedbringe luftudslippet iht. nationale målsætninger og internationale aftaler og for at lette miljøovervågningen har Denmark forpligtiget sig til at lave årlige opgørelser over emissionerne fra alle kilder inklusiv flytrafikken. Danmark deltager i CORINAIR (COoRdination of Information on AIR emissions), der er det fælles-europæiske system for emissionsopgørelser. Systemet beskriver metoder til at opgøre emissionen fra alle kilder og sektorer og indeholder også edb-programmer til at samle data og til efterfølgende gruppering af emissionsresultaterne.
Formålet med denne undersøgelse er 1) at opgøre emissionerne fra fly efter de nye CORINAIR retningslinjer, 2) at foreslå ændringer i de nationale opgørelser på basis af den nye opgørelse og 3) at udvikle et værktøj til vurdering af emissioner og brændstofforbrug for enkeltture med fly. Den nye opgørelse omfatter alle IFR (Instrumental Flight Rules) flyvninger fra danske lufthavne i 1998. Det vil i praksis sige al flyvning med store fly, der radardirigeres fra flykontrol på jorden. Flyvning med helikopter, militærfly og små fly med stempelmotorer er ikke med i undersøgelsen. De nye CORINAIR data for LTO og cruise kan også bruges til at beregne brændstofforbrug og emissioner i en tidsserie, da udskiftningen i flytype/motor kombinationer kun sker langsomt indenfor luftfart.
Først i rapporten sammenfattes bidraget fra flyvning til den globale opvarmning og nedbrydelsen af ozonlaget, som det gennemgås i rapporten "Aviation and the Global Atmosphere" fra FNs klimapanel (IPCC, 1999). Dernæst gives en kort beskrivelse af CORINAIR og internationale konventioner relateret til luftforurening. Den hidtil brugte CORINAIR metode forklares også. Herefter gennemgås input, beregningsprincip og resultater for den nye CORINAIR metode. Til slut sammenlignes de nye CORINAIR resultater med resultater fra den indtil nu brugte metode. De nye resultater sammenlignes også med internationale opgørelser af flyemissioner, den danske TEMA2000 model og transportsektorens øvrige emissioner.
Internationale konventioner og CORINAIR
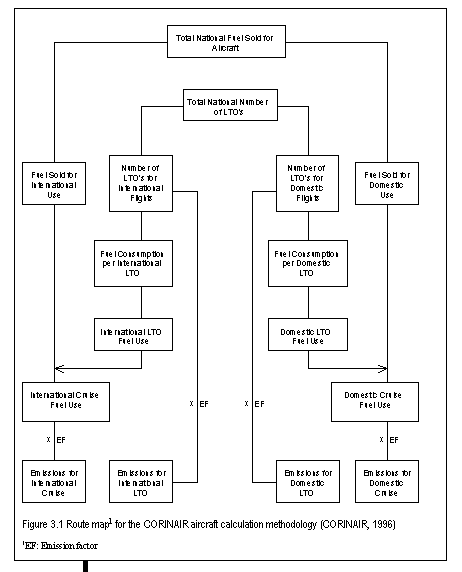
I CORINAIR bliver emissionerne fra flytrafik beregnet i fire kategorier: Indenrigs LTO (Landing and Take Off) og cruise og udenrigs LTO (Landing and Take Off) og cruise. En LTO-cyklus forstås som indflyvning fra 3000 fod og til landing, taxi på lufthavnens område samt start og stigning op til 3000 fod. Cruisefasen omfatter al flyvning over 3000 fod. Resultaterne indberettes til FNs klimakonvention (UNFCCC: United Nations Framework Convention on Climate Changes) og Geneve konventionen (UNECE CLTRAP: United Nations Economic Commission for Europe Convention on Long Range Transboundary Air Pollutants).
I CORINAIR findes tre udgaver af beregningsmetoden med stigende detaljeringsgrad. Det er den mest detaljerede udgave, der bruges til at opgøre de danske emissioner. Den hidtidige metode – der stadig bruges i Danmark - er netop blevet opdateret. Det er den seneste modelversion, som den nærværende undersøgelse bygger på.
CORINAIR metoderne til beregning af flyemissioner
I den hidtil anvendte CORINAIR version skal oplysninger om antallet af indenrigs og udenrigs LTO’er per flytype fremskaffes sammen med tider for de enkelte faser af LTO-cyklussen. De mest detaljerede data er tilgængelige for Københavns Lufthavn, mens lufthavnene i provinsen kun oplyser om det samlede LTO antal fordelt på store og små fly i indenrigs- og udenrigstrafikken. Ud fra LTO-tiderne beregnes faktorer for brændstofforbrug og emissioner. Samlede LTO-resultater opnås ved at kombinere faktorerne med LTO-antallet for hver flytype.
Cruise brændstofforbruget findes separat for indenrigs- og udenrigstrafikken som forskellen mellem det statistiske brændstofsalg og det beregnede LTO brændstofforbrug. Til slut beregnes cruiseemissionerne ved at gange brændstofforbruget med brændstofrelaterede emissionsfaktorer. Da der kun er få emissionsdata i den hidtil brugte CORINAIR model, bliver cruisefasens brændstofforbrug og emissioner ikke opgjort per flytype.
Den nye CORINAIR beregning gør brug af 24 repræsentative flytyper. For store jetfly er hver enkelt flytype sammensat efter de motortyper, der på verdensplan er installeret i den pågældende flytype. Faktorerne for brændstofforbrug og emissioner stammer fra den europæiske ANCAT/EC2-opgørelse og MEET-projektet, mens det svenske FFA-institut har givet oplysninger om faktorerne for turbo-propfly og små jetfly.
For LTO er den internationale civile flyorganisations (ICAO: International Civil Aviation Organization) standardtider i de fleste tilfælde brugt til at beregne faktorer for brændstofforbrug og emissioner. Faktorerne er dog i denne undersøgelse specielt tilpasset de reelt kortere taxitider i danske lufthavne. For cruise er brændstofforbrug og emissioner simuleret ud fra typiske flyveprofiler.
Flytyper og trafikdata
ICAO klassificerer hver enkelt flytype efter en specifik flytypekode, flytypen, motorantallet og –princippet. Lufthavne bliver også udstyret med 4-bogstavkoder, der angiver deres fysiske placering mht. ruteområde og land. Koderne for flytyper og en oversættelse af lufthavns- og landekoder er til brug for denne undersøgelse tilsendt af Statens Luftfartsvæsen (SLV).
Undersøgelsens data for flytrafik er indhentet fra EUROCONTROL (den europæiske organisation for flysikkerhed). For hver flyvning er der information om overordnet flytype, koder for afgangs- og ankomst lufthavn og storcirkelafstanden mellem disse. Storcirkelafstanden, der er længden af en naturlig bue mellem to lufthavne, er ofte kortere end længden af faktiske flyture. Pga. datamangel for brændstofforbrug og emissioner er militærflyvninger, helikopteroperationer og ture med små stempelmotorfly udelukket fra undersøgelsen. Flyvninger med samme start- og landingslufthavn er heller ikke medtaget. Ofte er disse flyvninger af militær karakter.
Gruppering efter repræsentative flytyper
Alle ture med civile jetfly og turbo-propelfly blev i 1998 gjort af 145 forskellige overordnede flytyper. Disse flytyper er i undersøgelsen grupperet efter 24 forskellige repræsentative flytyper. Først er opdelingen gjort mellem jetfly og turbo-propfly. Dernæst har flyets højst tilladte startvægt (MTOW: Maksimum Take Off Weight, fra opslagsværker) bestemt valget af repræsentativ flytype. CORINAIRs database (se www.eea.int/aegb/) indeholder data for brændstofforbrug og emissioner for de repræsentative flytyper. For LTO er der data for hver LTO fase og samlet for hele LTO operationen. Data for cruiseflyvning er opgivet ved adskilte flyvelængder i sømil (1 sømil = 1,852 km).
Beregning af brændstofforbrug og emissioner
For hver flyvning er brændstofforbruget og emissionerne opgjort adskilt for LTO og cruise. Resultaterne for LTO er beregnet som summen af bidragene fra LTO-faserne; landing, taxifart på lufthavnsområdet, start og stigning. For cruise er beregningerne gjort ved at skalere CORINAIR databasens tal for brændstofforbrug og emissioner, så de passer med flyvningens faktiske længde. Resultaterne opsummeres og grupperes til totale tal i CORINAIRs fire kategorier udfra hver flyvnings lufthavns- og landekoder.
Undersøgelsens resultater
Udenrigstrafikken udgjorde i 1998 omtrent to tredjedele af alle starter fra danske lufthavne. Andelen af brændstofforbrug og emissioner var endnu højere, i alt mellem 80 og 90%. Dette skyldes, at udenrigsflyene er relativt større end indenrigsflyene og at udenrigsturene er længere end indenrigsturene. For LTO er udenrigsandelen tæt ved 80% - pga. større fly og flere flyafgange – og for cruise omtrent 90% pga. større fly, flere flyafgange og længere ture. Hen ved en tredjedel af alle flyvninger fra danske lufthavne er indenrigsture. I modsætning til udenrigsturene har de en mere moderat andel af brændstofforbruget og emissionerne set i forhold til antallet af starter. Årsagen er, at indenrigsflyene er relativt små og at turene er korte.
Selvom brændstofforbruget og luftudslippet fra den nordatlantiske flyvning mellem Danmark og hhv. Grønland og Færøerne kun udgør mellem 1 og 2% af de samlede tal, er andelene - ligesom for udenrigstrafikken - større end turenes andel.
The present study’s aviation fuel use and emissions in 1998 Look here!
Trafikken fra Danmark til hhv. Grønland og Færøerne er i nedenstående figur talt ind under udenrigstrafikken. Her udgør cruiseudslippet af NOx og CO2 ca. 80% af det samlede tal. Det meste af dette udslip kommer fra jetfly og yderligere sker udslippet direkte til atmosfæren i flyvehøjder mellem 9 og 11 km, hvor NOx-udslippet er mest skadeligt. Flyvning med turbo-propfly og korte indenrigsture har mindre betydning for drivhuseffekten. Grunden er den lille andel af det totale brændstofforbrug og de typiske flyveprofiler. De sidstnævnte flyvninger foregår maksimalt mellem 5 og 7 km’s højde og generelt er cruisehøjden mellem 6 og 8 km for turbo-propfly.
Den nye metode beregner kun 80% af brændstoffet solgt i Danmark til civil flyvning. Selvom flyvning med helikopter er udeladt af undersøgelsen, skal grunden til det mindre beregnede brændstofforbrug findes andre steder. Der kan være mange årsager til forskellene mellem beregnet og statistisk opgjort brændstofforbrug. Brændstoffet kan være brugt til andre formål end flyvning, eller der kan være tanket ekstra f.eks. i forbindelse med efterfølgende korte mellemlandinger. Brændstoffet kan også være brugt til militærflyvning. Andre usikkerhedsfaktorer kan være lufthavnsforsinkelser både i luften og på landjorden, udeladelsen af ture med samme start- og landingslufthavn, modelusikkerheder specielt for cruise, upræcise tidsintervaller for de enkelte LTO-faser eller en usikker gruppering af flytyper efter repræsentative flytyper.
For indenrigstrafikken alene udgør brændstofsalget – som det foreligger ved denne undersøgelses slutning - kun halvdelen af undersøgelsens beregnede brændstofforbrug. Dette skyldes en upræcis fordeling af indenrigs-/udenrigs salgsstatistikken, hvor udenrigssalgets mængde er tilsvarende for stor. Salgsopdelingen er efter nærværende undersøgelses afslutning blevet revideret i et samarbejde mellem Energistyrelsen og Trafikministeriet og det opgjorte indenrigssalg er nu næsten lig undersøgelsens beregnede mængde.
For alle flyvninger beregnes de gennemsnitlige faktorer for luftudslip (Emission Indices: EI) til: EINOx: 13,0, EIVOC: 0,7 og EICO: 2,7 g per kg forbrugt brændstof.
Den officielle opgørelse
Den officielle danske opgørelse af flytrafikkens emissioner i 1998 er beregnet med den hidtidige version af CORINAIR metoden. Resultaterne er indleveret til UNECE og UNFCCC konventionerne.
Danish 1998 aviation fuel use and emissions from the current CORINAIR method Look here!
Den hidtidige metodes og undersøgelsens resultater
For brændstofforbrug og luftudslip er forskellene mellem den hidtidige metodes og undersøgelsens resultater mindst for udenrigs LTO i Københavns Lufthavn. Det er også den del af den hidtidige metode, hvor detaljeringsgraden er størst mht. forskellige flytyper og tidsintervaller i de enkelte LTO-faser. For LTO er den mest upræcise del af den hidtil anvendte model alle indenrigsstarter og udenrigsstarterne fra lufthavnene i provinsen. Her bygger beregningerne kun på tal for brændstofforbrug og emissioner fra et fly af typen Fokker 50.
Det viser sig også, at denne flytype er en smule for lille til at være fuldt repræsentativ. En del flyvning bliver gjort med de større jetfly MD80 og B737, hvilket påvirker det samlede brændstofforbrug. Den hidtidige models brændstofforbrug bliver især undervurderet for udenrigs LTO’erne i provinslufthavnene. Her beregner den nye undersøgelse en næsten 50% større brændstofmængde end den hidtidige model.
Sammenligning med internationale opgørelser
På verdensplan er der lavet tre store opgørelser for flyemissioner med udgangspunkt i året 1992. Alle opgørelserne bruger statistik for flyoperationer samt kombinationer af flytyper og –motorer. Brændstofforbrug og emissioner beregnes for enkeltflyvninger ud fra storcirkelafstanden mellem start- og landingslufthavnene.
Emission indices from the present study and other inventories
|
NASA |
ANCAT/EC2 |
DLR |
Present study |
EI NOx |
13.0 |
14.0 |
14.2 |
13.0 |
EI CO |
5.1 |
|
3.72 |
2.7 |
EI VOC |
2.0 |
|
1.33 |
0.7 |
Undersøgelsens samlede indeks for NOx-emissionen (EINOx) er en
smule lavere end ANCAT/EC2-projektets indeks. Dette skyldes især, at turbo-propfly er
medtaget i nærværende undersøgelse og at der er en forskel i brugen af repræsentative
flytyper. CORINAIR’s NOx-data for jetfly kommer næsten udelukkende fra
ANCAT/EC2-opgørelsen, mens det svenske FFA-institut har leveret tal for turbo-propfly.
Flyene i den danske opgørelse er relativt små og de fløjne ture er hovedsageligt korte ture og mellemdistanceflyvninger. NASA-projektets resultater for flyvning med rute- og charterfly understøtter denne forklaring. Udover jetfly omfatter NASA-undersøgelsen også turbo-propfly og små fly med stempelmotorer og beregner omtrent det samme emissionsindeks for NOx som denne undersøgelse.
Forskellene i emissionsindeksene for VOC og CO i de forskellige undersøgelser skyldes for det meste forskelle i de brugte simuleringsmetoder ved NASA, DLR, FFA og Psia-consult. De to sidstnævnte institutter har forsynet CORINAIR databasen med tal for CO og VOC emissioner.
Sammenligning med andre resultater for indenrigsflyvningen
Brændstofforbrug og luftudslip for de danske indenrigsrutefly bliver beregnet i Trafikministeriets TEMA2000-model. Beregningerne bygger på resultater fra computermodellen ATEMIS. Den sidste model bruger realistiske flymotorer og flyveprofiler for flytyperne, der betjener de enkelte indenrigsruter. Det anbefales at bruge TEMA2000-modellen, hvis brændstofforbrug og luftudslip skal beregnes for danske indenrigsture og flytyper, der kan vælges i TEMA2000. Skal samlede opgørelser for indenrigstrafikken laves, bør CORINAIR data bruges i stedet. Primært pga. datakonsistens og fordi CORINAIR indeholder data for små jetfly og turbo-propfly, der ikke findes i TEMA2000.
Konklusion
Undersøgelsen har vist, at den nye CORINAIR metode kan bruges til at opgøre flytrafikkens brændstofforbrug og emissioner for enkeltflyvninger. Ensartede data kan fremskaffes for hver enkelt flyvning fra EUROCONTROL og SLV kan oplyse om de generelle ICAO benævnelser for flytyper, lufthavne og lande. Yderligere flyoplysninger til brug for flytypegruppering findes i opslagsværker. Tal for brændstofforbrug og emissioner for repræsentative flytyper findes i CORINAIR databasen. Alle data kan sættes sammen ved udformningen af den endelige opgørelse.
Det er tidskrævende at opbygge et opgørelsessystem for flyemissioner efter de nye CORINAIR retningslinjer. Selvom det vil blive mindre tidskrævende at opdatere opgørelsen for efterfølgende år, vil den forbrugte tid alligevel overskride tiden, der typisk er til rådighed. Dette skal ikke mindst ses i lyset af behovet for opgørelser indenfor andre sektorer. På basis af undersøgelsens resultater anbefales det at bevare den hidtidige metode til beregningen af de årlige opgørelser. I stedet for at skifte til den nye CORINAIR modelversion, anbefales det at opdatere den hidtidige versions baggrundsdata for brændstofforbrug og emissioner.
En stor forbedring af den hidtidige metode for LTO – dog undtaget de internationale LTO’er i Københavns Lufthavn – kan opnås ved at bruge nye LTO faktorer for brændstofforbrug og emissioner. Disse kan beregnes som samlede tal ud fra undersøgelsens resultater. For cruise bliver opgørelserne bedre, hvis brændstofforbruget for flystarter fra Københavns Lufthavn og provinslufthavnene fordeles med samme procentandele som de beregnede brændstofforbrug for LTO. Fordelingen skal gøres adskilt for indenrigs- og udenrigstrafikken. Emissionsfaktorerne skal samtidigt opdateres. Som for LTO kan cruisefaktorerne fås som samlede tal ud fra undersøgelsens resultater. De nye CORINAIR data for LTO og cruise kan også bruges til at beregne brændstofforbrug og emissioner i en tidsserie, da udskiftningen i flytype/motor kombinationer kun sker langsomt indenfor luftfart.
Undersøgelsen peger også på behovet for en nærmere gennemgang af, hvor det solgte flybrændstof til danske lufthavne mere præcist bliver brugt. Som en del af analysen skal de mest detaljerede data for brændstofleverancer undersøges. Også lufthavnenes brændstoflagre bør kontaktes og deres oplysninger holdes op imod andre tilgængelige oplysninger. Selvom energistatistikken for brændstof solgt til indenrigs- og udenrigsfly er blevet markant forbedret efter afslutningen af nærværende projekt, kan projektets resultater bruges til at krydschecke de statistiske tal med modellens beregnede tal.
Det bør også undersøges nærmere, hvor præcise CORINAIR databasens tal for brændstofforbrug er sammenlignet med det virkelige forbrug for LTO og cruisefart. Sammenligningen kan gøres ved at indhente oplysninger om brændstofforbrug fra luftfartselskaberne for de flytyper, der oftest bruges i danske lufthavne.
Summary
Like other transport modes aviation has many environmental effects such as noise, odour, land use and air pollution. The airports have land use requirements and furthermore restrict the land use of the surrounding areas. As regards air pollution two environmental effects attract special attention: Global warming and ozone depletion. Travel by air has increased substantially during the latest years and is expected to rise by 5% per year for the next 20 years. Air pollutants emitted at cruise flying levels are more harmful than emissions from sources at the Earth’s surface, and in addition most fuel use and emissions occur in this flying phase.
In order to bring down emissions according to national targets and international agreements and to monitor the state of the environment, Denmark is obliged to make annual air emission estimates for all sectors including aviation. For this purpose Denmark participates in the extensive European air emission inventory programme CORINAIR (COoRdination of Information on AIR emissions). The inventory system includes calculation methodologies for most sub-sectors and software for storage and further data processing.
The objective of this project is 1) to make operational the procedure for calculating aircraft emissions according to the new CORINAIR guidelines, 2) on the basis of this to recommend changes in national emission estimations and 3) to develop a tool for assessing fuel use and emissions for individual flights. The project objectives will be met by establishing an emission inventory for IFR (Instrumental Flight Rules) jet and turbo-prop flights from Danish airports in 1998. Emission estimations will not be made for helicopter operations, military flights and piston-engined aircraft movements. The new CORINAIR LTO and cruise data can also be used to make time series estimates of fuel use and emissions since new aircraft/engine combinations only have a slow speed of penetration in the aviation sector.
At first the report summarises the environmental impacts from aviation on global warming and ozone depletion, on the basis of the special report "Aviation and the Global Atmosphere" by the Intergovernmental Panel on Climate Changes (IPCC, 1999). This is followed by a short description of relevant international air pollution conventions and CORINAIR. Then the current CORINAIR methodology is explained, followed by a description of the new model version in terms of input, calculation principle and the computed results. Database queries are made to compare results with the current CORINAIR methodology, findings from international aircraft emission inventories, the Danish TEMA2000 model and sectorial shares for Danish transportation.
International conventions and CORINAIR
Emissions from aircraft are calculated in four sub-categories: Domestic and international LTO (Landing and Take Off) and cruise (>3000 ft). A LTO-cycle covers all flying activities below 3000 ft during descent and landing, taxiing, take off and climb out. The results are reported to the United Nations Framework Convention on Climate Changes (UNFCCC) and the United Nations Economic Commission for Europe Convention on Long-Range Transboundary Air Pollutants (UNECE CLRTAP), according to their respective classification procedures.
CORINAIR (COoRdination of Information on AIR emissions) serves the specific UNFCCC and UNECE reporting needs and is used by many countries to make national estimates. For aviation emissions three different and newly revised methods are offered with increasing levels of complexity. The new detailed methodology is used in the present study to make national CORINAIR calculations operational, while on the other hand the previous version is currently in use for official Danish emission reporting.
CORINAIR aircraft emission calculation methodologies
In the current version initial information must be provided on the number of domestic and international LTOs per aircraft type and their respective LTO timings. The most detailed data are available for Copenhagen Airport, while other Danish airports only submit their statistics for domestic and international LTOs in total numbers for large and small aircraft. From LTO times-in-modes the fuel use and emission factors are computed. These factors are used in combination with the number of LTOs per aircraft type to estimate the total LTO energy use and emissions.
Separately for domestic and international flights the cruise energy use is estimated as the difference between the total fuel use from aviation fuel sale statistics and the corresponding LTO fuel use totals. Finally the domestic and international cruise emissions are calculated as fuel related cruise emission factors multiplied with the fuel use. Due to scarce data on cruise fuel use and emission factors, results are not broken down further on aircraft types.
The new CORINAIR version use fuel use and emission data per distance flown for 24 different civil jets and turbo-props. For the large jets generic aircraft – with worldwide weightings of engine population fitted – are used. Their fuel use and emission figures are mainly harmonised data from the European ANCAT/EC2 and MEET projects, while the Swedish FFA has provided additional data for small jets and turbo-props. For LTO International Civil Aviation Organization (ICAO) times-in-modes are used in most cases to simulate the fuel use and emissions; yet in this study shorter airport taxi times are used for Danish airports to account for local airport characteristics. The cruise fuel use and emissions are simulated by using realistic flight profiles.
Aircraft categories and flight data
ICAO classify all single aircraft according to aircraft designator code, aircraft type, number of engines and engine principle. Airports are also provided with four-letter codes describing their situation regarding i.e. routing area and state. In the present project this information was obtained from the Danish Civil Aviation Administration (CAA-DK).
EUROCONTROL (European Organization for the Safety of Air Navigation) provided data on IFR flights. Recordings for each flight were the origin and destination airport codes and type designators. Also the great circle distance between origin and destination airports was stated. The great circle distance is the length of a natural arc between airports without mileage compensation for actual flight profiles or the actual route followed. Some flights were excluded from the inventory due to lack of fuel use and emission data; namely all piston engined flights, military aircraft and helicopter operations. Omitted were also flights with no indication of great circle distance, i.e. with same origin and destination airport code stated. Many of these flights were actually of a military character.
Representative aircraft and groupings
In 1998 145 different aircraft types carried out all civil jet and turbo-prop flying. These aircraft types were grouped into 24 representative aircraft types. A first distinction was made between jets and turbo-props. The second step was to let the aircraft Maximum Take Off Weight (MTOW, from aircraft directories) determine the choice of representative aircraft type. The CORINAIR databank (see www.eea.int/aegb/) contains data for fuel use and emissions for the representative aircraft. Data is available for each LTO-phase and as a sum for LTO. For cruise data is available for separate mission distances in nautical miles (1 nm = 1.852 km).
Fuel use and emissions calculation
For each flight fuel use and emissions are computed separately for LTO and cruise. LTO results are calculated as the sum of the contributions from five modes; approach/landing, taxi in, taxi out, take off and climb out. Cruise results are found by interpolating or extrapolating the fuel use and emissions for standard flying distances by using the great circle distance for each flight. The airport codes in each flight record make it possible to sum up the results as desired according to origin and destination airport and countries.
New results
In 1998 Danish international flights make up almost two thirds of all flights and even larger shares of fuel use and emissions; in total between 80 and almost 90%. This is explained by the presence of larger sized aircraft in service and longer flying distances. For LTO the international shares are close to 80% - due to larger aircraft and more flights– and for cruise around 90% because of larger aircraft and more and longer flights. Almost one third of all flights are Danish domestic flights. As opposed to international flights they have more moderate fuel use and emission shares compared with flight numbers. The reason is the use of smaller aircraft and shorter trips.
Although fuel use and emissions are only between 1 and 2% in total numbers North Atlantic flights between Denmark and Greenland/Faroe Islands reveal the same trend by shares as for Danish international flights.
The present study’s aviation fuel use and emissions in 1998 Look here!
The North Atlantic flights are classified as international air traffic. The international cruise emissions of NOx and CO2 amount to around 80% of the Danish aviation totals. Moreover, most of them are injected directly to the atmosphere by jet aircraft and at flying altitudes between 9 and 11 km. In these altitude bands the NOx emissions have the most harmful effects. Flying with turbo-props and the short-distanced Danish domestic trips have less importance to the greenhouse effect. This is due to their limited share of total fuel burned and their typical flight profiles. The latter trips are flown at maximum altitudes between 5 and 7 km and for turbo-prop flying in general the ideal cruise levels are between 6 and 8 km.
The new methodology only calculates 80% of all fuel sold in Danish airports for civil aviation purposes. Although helicopter operations are excluded from the inventory, the smaller calculated fuel use amount and the large domestic fuel use deviation must primarily be explained by other factors.
Many parameters have a potential effect on the precision of the fuel statistics such as the use of jet petrol for non-aviation purposes, military flying or fuel tankering. Influencing factors on the city-pair estimations are stacking at airports, model simulation uncertainties during the cruise flying phase, the omittance of flights with same origin and destination airports, inaccurate LTO times-in-modes or unrepresentative groupings for some of the aircraft into representative types.
By the end of the present project period the domestic fuel sale figure was only half of the present inventory’s computed fuel consumption. This difference is due to inaccurate domestic/international energy statistics where the amount of fuel sold for international aviation becomes accordingly bigger. After the finalisation of the present project the fuel sale statistics have been revised jointly by the DEA and the Ministry of Transport and the domestic fuel sale figure is now almost equal to the computed fuel consumption in the present inventory.
The average emission indices (EI) in g of emission per kg fuel burned and derived from all flights are: EINOx: 13.0, EIVOC: 0.7 and EICO: 2.7.
Current CORINAIR Results
The official Danish aircraft emission estimates for the year 1998 is calculated with the current version of the detailed CORINAIR methodology. The emission figures are reported to the UNECE and UNFCCC conventions.
Comparisons with current CORINAIR results
For fuel use and emissions the most equal results are obtained for international LTOs in Copenhagen airport. This is also the part of the current model where precise details are given regarding different aircraft types and LTO modal timings. For LTO the weakest part of the current methodology regards all domestic flying and international flying from the provincial airports. In these inventory categories the current estimates are based on fuel use and emission data for the F50, and this data scarcity is reflected in the result deviations.
Danish 1998 aviation fuel use and emissions from the current CORINAIR method Look here!
Moreover F50 is found somewhat small to be fully representative, since much flying is made with the larger jets MD80 and B737, thus influencing the total fuel consumption. In particular the fuel use is underestimated in the current model for international LTOs in provincial airports. Here the new methodology with a detailed fleet mix computes almost 50% more fuel.
Comparisons with international aircraft emission inventories
On a global level three important aircraft emission inventories have been made for the year 1992. All inventories make use of air traffic movement data, aircraft/engine combinations in operation and calculate fuel use and emissions for city-pairs using corresponding great circle distances.
Emission indices from the present study and other inventories
|
NASA |
ANCAT/EC2 |
DLR |
Present study |
EI NOx |
13.0 |
14.0 |
14.2 |
13.0 |
EI CO |
5.1 |
|
3.72 |
2.7 |
EI VOC |
2.0 |
|
1.33 |
0.7 |
The EINOx found in the present study are slightly below ANCAT/EC2 figures. This
is mostly due to the inclusion of turbo-props and differences in fleet mix for jet
aircraft, since emission data for jets mainly come from the ANCAT/EC2 inventory. The
aircraft in the Danish CORINAIR inventory tend to be relatively small and flights are
mainly short and medium distances. NASA findings for scheduled and charter flights
underpin the above explanation. Beyond jets NASA includes also turbo-propelled aircraft
and computes almost the same EINOx as the present study. For VOC and CO the
differences in emission indices lie mainly in the simulation methods developed by NASA,
DLR, FFA and Psia-consult (4th framework research project MEET). The two latter institutes
have provided CORINAIR with emission data for CO and VOC.
Comparisons with other results for domestic flights
In the Danish model TEMA2000 fuel use and emissions for Danish city-pairs and different aircraft types are simulated with the emission model ATEMIS based on real world flight profiles for specific aircraft and installed engines. It is recommended to use the TEMA2000 numbers if fuel use and emissions are evaluated for those domestic trips flown with the aircraft comprised in TEMA2000. For domestic emission inventories the CORINAIR data should be used primarily because of data consistency and because CORINAIR contains data for small jets and turbo-props not present in TEMA2000
Conclusions
This study has shown the feasibility of the new CORINAIR methodology for making city-pair aircraft emission inventories. Consistent data for individual flights and general classifications of aircraft types and airports exist together with fuel use and emission data for representative aircraft types. In this way EUROCONTROL provides information for individual IFR flights which correspond to essential data from CAA-DK on ICAO aircraft designators and airport codes. Fuel use and emission figures for representative aircraft are available from the CORINAIR databank. All data can be combined to build up the inventory system. In order to make the final grouping of aircraft into representative aircraft additional aircraft descriptions can be obtained from aircraft directories.
Much time is needed to build an aircraft emission inventory following the new detailed CORINAIR guidelines. Even though it would be less time consuming to make an inventory update each year, the working time required will exceed the time typically available for inventories - not least considering the requirements for emission estimates in other CORINAIR sectors. Therefore it is recommended to maintain the current methodology for national emission reporting. Instead of a shift to the new model version, one should make an update of the current model’s background data for fuel use and emissions.
Real improvement of the current version for LTOs - except for international LTOs in Copenhagen Airport – could be achieved by applying new LTO fuel use and emission factors derived from the new methodology as aggregated figures. For cruise it is recommended to break down the fuel use used by flights from Copenhagen Airport and other Danish airports according to their LTO fuel use estimates. This should be done separately for domestic and international traffic. Also the cruise emission indices should be updated. Both for domestic and international flights these can be derived from the new methodology results. The new CORINAIR LTO and cruise data can also be used to make time series estimates of fuel use and emissions since new aircraft/engine combinations only have a slow speed of penetration in the aviation sector.
This study’s findings clarify the need to further scrutinise for which purposes the aviation fuel is used in Danish Airports. A way to do this is to examine the most detailed data on aviation fuel delivered to the airports. Also the airport authorities on aviation fuel suppliance should be asked and their information should be verified by analysing other data available. Even though the fuel sale statistics have been improved after the finalisation of the present project the present study’s result could be valuable in a crosscheck examination of statistical data versus model estimates.
A double check on the fuel use from the CORINAIR databank with experiences from real world operation of aircraft during LTO and cruise flying conditions would also add to more precise fuel balances in future aircraft emission inventories. To make these comparisons information must be obtained from the airline companies on fuel use figures for the aircraft most frequently operating from Danish airports.
1. Environmental effects
Air pollutant emissions have local, regional and global environmental effects. Local
effects are mainly associated with the deterioration of air quality in residential or
working areas, while effects on a regional scale are e.g. acidification and
eutrophication. On a global level the greenhouse effect and ozone depletion are recognised
as the most important environmental problems. The two latter themes are also receiving
most attention, when the impact from aviation on the atmospheric environment is
investigated.
The greenhouse gases - from both anthropogenic and natural sources - are able to absorb infrared radiation. In this way the emissions change the natural balance of incoming energy from the sun and energy escaping back to space. The amount of greenhouse gas emissions emitted until now and the present emission rate will probably lead to a global warming of the Earth’s surface. The environmental end effects could be raised sea level, flooding of low-lying areas, new climatic stresses to forest, deserts, rangelands and other unmanaged eco-systems. The eco-systems could decline or fragmentize and some specific flora or fauna could be subject to extinction.
Ozone can be measured throughout most of the atmosphere, but are found in high concentrations in the stratosphere especially in a layer situated about 20 km above the Earth’s surface. Stratospheric ozone is very important to life on Earth by blocking most of the harmful ultraviolet light (UV-B) radiated by the sun. Depletion or even removal of the protective stratospheric ozone layer would have severe consequences. Unnaturally high levels of UV-B can cause skin cancer on humans and may reduce crop yields.
When global warming and the depletion of the ozone layer are considered, aircraft emissions in the upper troposphere and lower stratosphere (8-13 km) are met with special concern. At these cruise altitudes the emissions alter the atmospheric concentration levels of the greenhouse gases CO2, ozone (O3), methane (CH4) and water vapour (H2O); they trigger formation of condensation trails (contrails) and may increase cirrus cloudiness. All these disturbances of the normal atmospheric composition - arising from direct emissions, pollutants formed during different atmospheric reactions or cloud formation - have an effect on the heating of the Earth’s surface. In addition aviation emissions pertubate the ultraviolet radiative balance and cause changes in the total ozone column.
The importance to a potential climate change mechanism can be explained by the concept of radiative forcing. It expresses the perturbation or change to the energy balance of the Earth-atmosphere system in watts per square meter (W m-2). Positive values of radiative forcing imply a net warming while negative values imply a cooling. A measure for the harmful effects of UV-B is the erythemal dose rate, defined as UV irradiance weighted according to how effectively it causes sunburn.
An evaluation of the environmental effects from aircraft has been made in a special report from the Intergovernmental Panel on Climate Changes (IPCC) "Aviation and the Global Atmosphere" (IPCC, 1999). The report considers all gases and particles emitted by aircraft in the upper atmosphere, their role in modifying the chemical properties of the atmosphere and their ability to trigger the formation of condensation trails (contrails) and cirrus clouds. Subsequently it is explained first how the radiative properties can be modified, as a result possibly leading to climate change, and secondly how the ozone layer could be modified, causing changes in ultraviolet radiation (UV-B) reaching the Earth’s surface.
To put aircraft emissions into future perspectives the report also describes the environmental effect for the years to come as a result of potential changes in aircraft technology, air transport operations, and the institutional, regulatory and economic frameworks. This is done by examining 7 different emission scenarios for the time period 1990-2050. In the following a brief description of the substances contributing to global radiative forcing and UV-B perturbations from subsonic aircraft and the contributor’s predicted end level will be given, according to the IPCC reference scenario for the years 1990 to 2050.
1.1 CO2
The radiative forcing from CO2 is the result of the build-up in concentrations from CO2 emitted in the last 100 years or so. Aviation’s accumulated CO2 concentration share in 1992 was a little more than 1% of the total concentration increase coming from all anthropogenic emissions. The share is smaller than the actual 1992-emission share, because the emissions only occurred in the last 50 years. The accumulated aviation share is in the IPCC reference scenario predicted to be 4% in 2050.
1.2 Ozone
In 1992 the NOx emissions from aircraft at cruise altitudes (upper troposphere and lower stratosphere) are estimated to have caused a 6% increase in ozone concentrations in northern mid-latitudes compared with an atmosphere without aircraft emissions. Furthermore the IPCC reference scenario predicts the ozone concentrations to increase to about 13% in 2050. The increase in ozone concentration is substantially smaller in other regions of the world, but will in total tend to heat up the Earth’s surface.
The same quantity of NOx emissions is more effective at producing ozone in upper-tropospheric and lower-stratospheric altitudes than at surface level. In addition the radiative forcing of the same amount of ozone is stronger at cruise altitudes than at lower altitudes. Taking this into account the reference scenario predicts a 0.4 and 1.2% increase in the total ozone column at northern mid-latitudes in 1992 and 2050, respectively. Adversely, stratospheric aircraft emissions of sulphur and water tend to deplete ozone and this to some degree outbalances the NOx-induced ozone increase, but how strong this effect is is still not quantified.
1.3 Methane
Tropospheric NOx emissions decrease the concentration of methane, while ozone is being formed. The fall in methane concentrations tends to cool the Earth’s surface. The methane concentration is 2% smaller in 1992 compared to an atmosphere without aircraft, and according to the IPCC reference scenario the concentrations will be 5% smaller in 2050 compared to an atmosphere without aircraft. However, this decrease in methane concentrations is very small compared to the observed 2.5-fold overall increase since pre-industrial times.
1.4 Water vapor
Most of the water vapour emissions from subsonic aircraft occur in the troposphere. At these flying altitudes the water vapour is removed by precipitation within 1 or 2 weeks. A smaller part of the water vapour is injected into the lower stratosphere. Here it can build up to larger concentrations. Being a greenhouse gas water vapour tend to heat the Earth’s surface, but the overall effect is smaller than for CO2 and ozone as far as subsonic aircraft are concerned.
1.5 Contrails
Contrails mainly form in the upper troposphere and are initiated by the water vapour emitted by aircraft flying at these cruise altitudes. Contrails have radiative forcings - which similar to high thin clouds - tend to heat up the Earth’s surface. In 1992 the average contrail cover was about 0.1% and this cover is expected to increase to 0.5% in the IPPC reference scenario year 2050. The increase in contrail cover is higher than the projected increase in global fuel consumption. The future aircraft will become more fuel efficient, causing the air traffic to a relatively larger growth in the upper troposphere compared to the growth in global fuel consumption. The radiative effects of contrails are still uncertain, but are dependent upon their optical properties and global cover. The optical properties are determined by the particles emitted or formed in the aircraft plume and the ambient atmospheric conditions.
1.6 Cirrus clouds
Extensive cirrus clouds have been observed to develop after the formation of persistent contrails. A limited number of studies find that the formation of cirrus clouds (beyond those identified as line-shaped contrails) is positively correlated with aircraft emissions. An increase in cirrus cloud cover tends to heat up the Earth’s surface. The knowledge of the mechanisms behind cirrus cloud formation is still very limited, but preliminary estimates of aircraft-induced cirrus cloud cover are 0 to 0.2% of the Earth’s surface and this share are projected to increase by a factor 4 in 2050 according to the IPCC reference scenario.
1.7 Sulfate and soot aerosols
Particulate emissions related to aviation are in principle sulphate and soot aerosols. The total amount of these components is small compared to the emissions from sources at surface level. Even though the particle emissions from aircraft in the reference scenario are projected to increase with the global fuel consumption, their relative emission share of total particulate emissions remains small in the future. Soot tends to cool while sulphate tends to heat the Earth’s surface. However, their direct radiative forcings are small compared with those of other aircraft emissions. Because aerosols influence the cloud formation, the accumulation of aerosols may play a role in advanced cloud formation and may also change the radiative properties of clouds.
1.8 Overall climate effects of subsonic aircraft
The figure 1.1 and 1.2 show the radiative forcing from aircraft in 1992 and in 2050 taken from IPCC (1999), the latter presentation showing the IPCC reference scenario results. Note the difference in axis scaling for the two presentations. The two-third uncertainty ranges of the estimates are also presented, indicating that the true value of radiative forcing lies within the uncertainty range with a probability of 67%. Included in the totals are the effects from changes in concentrations of CO2, ozone, CH4, water vapour, contrails, sulphate and soot aerosols, while the possible change in cirrus cloud cover are left out. To each component a relative appraisal of the scientific evidence is made.
In 1992 the best estimate of radiative forcing from subsonic aircraft in total is 0.05 Wm-2 (true values between 0.01 and 0.1 Wm-2) or 3.5% of the total radiative forcing by all anthropogenic activities. Largest uncertainties are related to CH4 and contrails. According to the reference scenario the best estimate of the total radiative forcing would rise to 0.19 Wm-2 in 2050 or 3.8 times the level in 1992. The 6 remaining IPCC scenarios have best estimates of radiative forcings between 0.13 and 0.56 Wm-2. These results are a factor of 1.5 less to a factor of 3 greater than that of the reference scenario and 2.6 to 11 times the value in 1992. For the 7 IPCC scenarios the total radiative forcings from subsonic aircraft are between a factor of 2 to a factor of 4 stronger than the radiative forcing from aircraft-induced CO2 alone. Taking all radiative forcing from anthropogenic activities into account, the effect would be a factor of 1.5 stronger than the effect from CO2 alone.
 |
Figure 1.1
Radiative forcing from aircraft in 1992 (IPCC, 1999)
 |
Figure 1.2
Radiative forcing from aircraft in 2050 (IPCC, 1999)
1.9 Overall effects of subsonic aircraft on UV-B
Stratospheric ozone blocks most of the harmful ultraviolet light (UV-B) radiated from the sun. The erythemal dose rate is defined as the UV irradiance weighted according to how effectively it causes sunburn. In 1992 the erythemal dose rate is estimated to decrease with 0.5% at 45 oN in July by sub-sonic aircraft emissions (mainly due to NOx) compared with an atmosphere without aircraft. This should be held up against a calculated erythemal dose increase of 4% from 1970 to 1992 due to the overall ozone depletion. Aircraft contrails, aerosols and induced cloudiness give much smaller changes to UV-B. The decrease in UV-B is estimated to be a factor of 4 lower in the Southern Hemisphere than in the Northern Hemisphere.
In the IPCC reference scenario the change in UV-B is -1.3% in 2050 compared to a situation with no aircraft (with a two-thirds uncertainty range from -0.7 to -2.6%).
The change in UV-B from other sources is estimated to be -3% at 45 oN from 1970 to 2050. The latter decrease is caused by 1) the incomplete recovery of the ozone layer in 2050 back to the level of 1970 and 2) the expected increase of ozone-precursor emissions in the same period.
Table 1.1 repeats the overview of the emitted components, their role and major environmental effects at Earth’s surface given in IPCC’s Table 1-1 (1999).
Table 1.1
Emission components contributing to climate and ozone change (IPCC, 1999)
Emission components |
Role and major environmental effects at Earth’s surface |
CO2 |
Troposphere and Stratosphere |
|
Direct radiative forcing � warming |
H2O |
Troposphere |
|
Direct radiative forcing � warming |
|
Increased contrail formation � radiative forcing � warming |
|
Stratosphere |
|
Direct radiative forcing � warming |
|
Enhanced PSC formation � O3 depletion � enhanced UV-B |
|
Modifies O3 chemistry � O3 depletion � enhanced UV-B |
NOx |
Troposphere |
|
O3 formation in upper troposphere |
|
� radiative forcing � warming |
|
� reduced UV-B |
|
Stratosphere |
|
O3 formation below 18-20 km � reduced UV-B |
|
O3 decrease above 18-20 km � enhanced UV-B |
|
Enhanced PSC formation � O3 depletion � enhanced UV-B |
SOx and H2SO4 |
Troposphere |
|
Enhanced sulfate aerosol concentrations |
|
Direct radiative forcing � cooling |
|
Contrail formation � radiative forcing � warming |
|
Increased cirrus cloud cover � radiative forcing � warming |
|
Modifies O3 chemistry |
|
Stratosphere |
|
Modifies O3 chemistry |
Soot |
Troposphere |
|
Direct radiative forcing � warming |
|
Contrail formation � radiative forcing � warming |
|
Increased cirrus cloud cover � radiative forcing � warming |
|
Modifies O3 chemistry |
|
Stratosphere |
|
Modifies O3 chemistry |
2. The CORINAIR System
| 2.1 | CORINAIR and international conventions |
| 2.2 | CORINAIR inventories |
| 2.3 | CORINAIR aircraft emission calculation methodologies |
For the purpose of monitoring the state of the environment and to reduce air emissions
according to national target plans and international agreements Denmark is obliged to make
annual estimates of air emissions from all sectors. The Danish inventory is made in the
European-wide CORINAIR (COoRdination of Information on AIR emissions) inventory format and
the emission figures are further submitted to international conventions.
2.1 CORINAIR and international conventions
Air emissions are estimated and summarised in sub-sectors and the results are further reported to the United Nations Framework Convention on Climate Changes (UNFCCC) and United Nations Economic Commission for Europe Convention on Long Range Transboundary Air Pollutants (UNECE CLRTAP), according to their classification procedures. General information on the UNFCCC and UNECE conventions is available on the websites http://www.unfccc.de and http://www.unece.org
For aviation the UNECE and UNFCCC reporting rules prescribe a grouping in four different sub-categories: Domestic and international LTO (Landing and Take Off) and cruise. A LTO cycle describes the operation of an aircraft in the vicinity of an airport during approach, taxi-in and out, take off and climb to a level of 3000 feet.
Flights are considered domestic, if they have origin and destination in the same country for which the inventory is made. Flights leaving the country with foreign destinations are regarded as international flights. Both emissions related to domestic and international air traffic are to be reported to the UNFCCC only. Emissions associated with LTO activities are requested by the UNECE convention, although an exception is made for CO2. In this case the UNFCCC reporting instructions are followed.
Table 2.1
Aircraft emission grouping in the UNECE and UNFCCC conventions
|
Domestic flights |
International flights |
LTO (<3000 ft) |
UNECE and UNFCCC |
UNECE and UNFCCC |
Cruise (>3000 ft) |
UNFCCC |
UNFCCC |
CORINAIR is the most extensive European air emission inventory programme for national
sector-wise emission estimations. To ensure estimates as timely, consistent, transparent,
accurate and comparable as possible, the inventory programme has developed calculation
methodologies for most sub-sectors and software for storing and further data processing
(CORINAIR, 1999).
Incorporated in the CORINAIR software is a feature to serve the specific UNFCCC and UNECE convention needs for emission reporting. The requirements for emission information to other international bodies, such as the Helsinki (HELCOM) and Oslo-Paris (OSPARCOM) conventions and the EU monitoring mechanism for CO2 and other greenhouse gases, are also met in terms of the emission components comprised in CORINAIR.
2.2 CORINAIR inventories
The CORINAIR emission inventory system has been developed by the European Union. Initially it was part of the EU (DG XI) Corine (COoRdination d’INformation Environmentale) programme set up by the Council of Ministers in 1985 (Decision 85/338/EEC). The first CORINAIR inventory covered the three pollutants: SO2, NOx and VOC1 (Volatile Organic Compounds) for the year 1985. The then EU-12 countries participated in this first pan European inventory. The second inventory (for the year 1990) was expanded to 29 countries and the emission components SO2, NOx, NMVOC (Non Methane Volatile Organic Compounds), CH4, CO, CO2, N2O and NH3.
From 1994 the EEA (European Environment Agency) has co-ordinated the CORINAIR inventory programme and national estimates have been requested every year. The 1998 inventory has been carried out by 35 countries: the EU-15, the Phare 13 (Former Eastern European countries receiving monetary aid from the EU), Croatia, Cyprus, Iceland, Liechtenstein, Malta, Norway and Switzerland. At present CORINAIR comprises 28 different emission species and the emissions are made up in 11 main sectors further divided in more detailed second and third levels. The European inventories can be seen on the EEA website (http://www.eea.eu.int/). Time series of the Danish 1975-1996 emissions are reported by Winther et al. (1999a) and 1997 figures are also included at the NERI website http://www.dmu.dk
Table 2.2
Emission species requested by CORINAIR
Conventional pollutants |
Heavy metals |
Persistent Organic Pollutants |
sulphur dioxide (SO2) |
arsenic (As) |
hexachlorocyclohexane (HCH) |
non-methane volatile organic compounds (NMVOC) |
cadmium (Cd) |
pentachlorophenole (PCP) |
nitrogen oxides (NOx) |
chromium (Cr) |
hexachlorobenzene (HCB) |
methane (CH4) |
copper (Cu) |
tetrachloromethane (TCM) |
carbon monoxide (CO) |
mercury (Hg) |
trichloroethylene (TRI) |
carbon dioxide (CO2) |
nickel (Ni) |
tetrachloroethylene (PER) |
nitrous oxide (N2O) |
lead (Pb) |
trichlorobenzene (TCB) |
ammonia (NH3) |
selenium (Se) |
trichloroethane (TCE) |
|
zinc (Zn) |
dioxins |
|
|
furanes |
|
|
polycyclic aromatic hydrocarbons (PAH) |
Total emissions of all the emission components in table 2.2 are requested by the UNECE
convention, while only inventories of the greenhouse gases; CO2, CH4,
N2O, HFC’s, PFC’s and SF6 should be submitted to UNFCCC.
The European work with environmental data is organised by the EEA in several European Topic Centres (ETC’s). Each ETC is responsible for gathering information on an European level concerning specific environmental subjects or environmental compartments. For emissions to the atmosphere the ETC/AE (European Topic Centre on Air Emissions) is lead by the Umweltbundesamt (UBA) in Germany, with partners from the UK (AEA Technology), The Netherlands (TNO), Austria (UBA), France (Citepa), Italy (ENEA) and Denmark (Risø National Laboratory).
The EEA has also made a network of National Focal Points (NFP’s), one for each country. The NFP’s are responsible for the country’s overall organisation of environmental information. In Denmark the NFP is NERI (National Environmental Research Institute) in Silkeborg. The Danish NFP has organised the work in National Reference Centres (NRC’s), one for each environmental subject or area. The Department of Policy Analysis at NERI is appointed to cover the Danish emissions to the atmosphere. In general the Danish NRC’s cover the same environmental themes as the European ETC’s. This means that the Danish CORINAIR inventories are submitted both to the ETC/AE and to the Danish NFP. The Danish air emission inventories can be found on http://www.dmu.dk and http://www.nfp-dk.eionet.eu.int.
2.3 CORINAIR aircraft emission calculation methodologies
Three different aircraft emission calculation methodologies are defined in the CORINAIR guidelines: the very simple, the simple and the detailed methodology. The previous methodology versions explained in CORINAIR (1996) were quite similar to the proposed methodologies by IPCC (Houghton et al., 1997a,b,c). The previous detailed methodology – referred to as the current methodology - is still used in Denmark for making national estimates and will be explained in much detail in the next chapter.
All three CORINAIR methodologies have been recently revised by the UNECE transport expert panel and more updated and detailed fuel use and emission data has become available (CORINAIR, 1999). A major improvement of the detailed methodology is the inclusion of fuel use and emission numbers for cruise flying conditions. The figures are given for different distance classes and a variety of representative aircraft types. A main purpose of the present project is to make the new detailed version operational for inventory makers. This work will be documented in chapter 4.
1 In terms of air pollutant emissions VOC is identical with hydro carbons (HC).
3. Current CORINAIR aircraft emission estimates
The previous version of the detailed CORINAIR methodology (CORINAIR, 1996) is currently used to compute the annual Danish aircraft emissions (Winther, 1999b). Model estimates for 1994 and onwards is a part of the official Danish emission figures reported to international conventions.
To operate the methodology initial information must be provided on the number of domestic and international LTOs per aircraft type and their respective LTO times-in-modes. From these the LTO fuel consumption and emission factors can be calculated together with the total LTO energy use and emissions. The cruise energy use is estimated as the difference between the total fuel use from aviation fuel sale statistics and the total calculated LTO fuel use. At last when given the fuel related cruise emission factors the total domestic and international energy use and emissions can be calculated.
3.1 Air traffic statistics
As a start the methodology needs information on the number of LTO’s grouped by representative aircraft types at all airports, local LTO times-in-mode and most frequently used engine per aircraft type.
At the most detailed estimation level all individual aircraft with their specific engines should be represented in the emission inventory and data on their actual LTO times-in-mode should be available in every airport. This detailed knowledge is very hard to obtain and therefore data must be used on a more aggregated level for practical calculations. Assumptions must be made further to account for missing data in some situations.
For Denmark air traffic statistics exist on different levels with data gaps in some areas, too. The air traffic activity in Denmark takes place mainly at Copenhagen Airport. With more than 100,000 LTOs per year this airport is a large emission point source in CORINAIR. From a national point of view the air traffic statistics for Copenhagen Airport are well described both as regards the number of LTOs per aircraft type and the LTO times-in-mode. The available statistics from the provincial airports are more scarce; they only submit rough information on the number of LTOs in traffic categories. Therefore, in order to carry out the emissions calculations properly it is necessary to make some assumptions.
In spite of the different levels of Danish aviation statistics it is possible to divide the air traffic activity into the number of LTOs per aircraft type by using different statistical sources. In the LTO groupings, see table 3.2, no distinction is made between charter and scheduled air traffic (large aircraft) and small aircraft are treated separately. Moreover, Copenhagen Airport is parted from the provincial airports in the inventory due to CORINAIR emission source definitions and the varying statistic levels in general.
3.2 Copenhagen Airport
To a large extent the CORINAIR emission inventory of Copenhagen Airport is based on an EIA (Environmental Impact Assessment), see Copenhagen Airport (1996). In this work all aircraft types operating at Copenhagen airport are grouped into 20 different representative aircraft types (large aircraft). The most frequently used engine type is also found for each of these. At the same time their respective LTO times-in-modes have been measured.
Table 3.1
LTO modal time intervals measured at Copenhagen Airport
Representative aircraft |
Engine type |
No. of engines |
Take off [s] |
Climb out [s] |
Approach [s] |
Taxi [min] |
MD81 |
JT8D-209 |
2 |
83.1 |
36.9 |
244.0 |
10.77 |
MD87 |
JT8D-217C |
2 |
83.1 |
36.9 |
244.0 |
10.77 |
DC9 |
JT8D-15 |
2 |
91.1 |
55.0 |
233.9 |
10.77 |
F50 |
PW125B |
2 |
88.0 |
99.6 |
300.2 |
11.03 |
B737 |
CFM56-3B-2 |
2 |
59.1 |
32.9 |
230.7 |
10.77 |
B767 |
PW4056 (W/O |
2 |
70.2 |
50.9 |
244.0 |
12.70 |
F100 |
TAY MK 620-15 |
2 |
66.9 |
37.4 |
251.2 |
10.77 |
EA310 |
CFM56-5A3 |
2 |
60.3 |
16.0 |
235.5 |
11.70 |
B757 |
RB211-535C |
2 |
54.7 |
39.4 |
247.6 |
12.73 |
EA320 |
CFM56-5-A1 |
2 |
80.4 |
43.1 |
227.6 |
12.07 |
B747 |
CF6-80C2B1F |
4 |
116.3 |
49.3 |
214.7 |
13.02 |
MD11 |
CF6-80C2D1F |
3 |
87.0 |
39.3 |
212.0 |
12.70 |
B727 |
JT8D-217 |
2 |
98.8 |
33.1 |
214.7 |
12.05 |
L188 |
RB211-22B |
3 |
109.9 |
66.1 |
257.0 |
10.77 |
DC10 |
CF6-50C2 |
3 |
91.3 |
42.0 |
218.8 |
12.70 |
EA300 |
CF6-80C2/A3 |
2 |
113.5 |
25.1 |
238.9 |
12.70 |
BA11 |
SPEY MK511 |
2 |
83.7 |
36.5 |
251.2 |
10.78 |
BA46 |
ALF 502R-3 |
4 |
125.7 |
41.8 |
269.2 |
10.77 |
S365 |
AS365N2 |
2 |
84.4 |
16.8 |
75.6 |
11.03 |
SF34 |
CT7-5 |
2 |
51.6 |
42.0 |
285.0 |
11.03 |
No information is available to distinguish between domestic and international LTOs per
aircraft type at Copenhagen Airport. In the airport’s own air traffic statistics
(Copenhagen Airport, 1999) the annual number of LTOs are given for all aircraft types
regardless of destination. In the Danish CORINAIR inventory these numbers are grouped into
LTO numbers for the representative aircraft types established in the EIA. Furthermore,
these LTOs are assumed to be international.
Another source of information, Statistics Denmark (1999), lists the number of domestic and international LTOs (large aircraft) and small aircraft (general aviation) in each Danish airport. From Statistics Denmark (1999) and Copenhagen Airport (1999) it is finally possible to find more accurate numbers of international LTOs per aircraft type and domestic LTO totals at Copenhagen Airport. The assumption that all LTOs by large aircraft reported at Copenhagen Airport (1999) are international is expected to give to many international LTOs, compared with the real LTO number in Statistics Denmark (1999). The difference in LTO numbers is subtracted from the representative aircraft type Fokker F50 LTOs and added to domestic LTOs, which are represented by the same aircraft.
3.3 Provincial airports
Since no LTO data for provincial airports are given in Statistics Denmark (1999) for individual aircraft types, all domestic and international LTO’s (for large aircraft) are assumed to be carried out by a Fokker F50. Furthermore, an overall assumption in the Danish inventory is that all domestic traffic with large aircraft takes place between Copenhagen and the provincial airports. The engine type and specific LTO timings are shown in table 3.1. The taxi-in and out time intervals are small in the Danish provincial airports and are set to 2.5 mins in the inventory, respectively.
Table 3.2
Number of take offs in Danish airports
Airport |
Aircraft type |
Domestic |
International |
Copenhagen |
MD81 |
|
19,916 |
|
MD87 |
|
19,916 |
|
DC9 |
|
10,276 |
|
F50 |
25,757 |
22,564 |
|
B737 |
|
14,783 |
|
B767 |
|
3,768 |
|
F100 |
|
1,937 |
|
EA310 |
|
705 |
|
B757 |
|
1,452 |
|
EA320 |
|
2,790 |
|
B747 |
|
469 |
|
MD11 |
|
264 |
|
B727 |
|
121 |
|
L188 |
|
33 |
|
DC10 |
|
72 |
|
EA300 |
|
266 |
|
BA11 |
|
159 |
|
BA46 |
|
3,658 |
|
S365 |
|
8,121 |
|
SF34 |
|
1,295 |
|
Small aircraft |
991 |
1,083 |
Other airports |
F50 |
25,967 |
20,169 |
|
Small aircraft |
128,228 |
12,269 |
3.4 Fuel consumption and emission factors
The engine power settings and time duration of the different parts of a LTO cycle is defined by the International Civil Aviation Organisation (ICAO), see (ICAO, 1993). For engine emission certification purposes modal measurements of the CO, VOC and NOx emissions and the fuel consumption are made during the test cycle for all engine types fitted to large aircraft.
Table 3.3
The times-in-modes and power setting for the ICAO LTO-cycle
ICAO LTO modes |
Power setting [%] |
Time [min] |
Take off |
100 |
0.7 |
Climb out |
85 |
2.2 |
Approach |
30 |
4.0 |
Taxi |
7 |
26.0 |
The engine emission and fuel consumption data can be found in ICAO (1995) or at http://www.dera.gov.uk. The emission indices (EI) are
given as g emission kg fuel-1 and the fuel consumption rate as kg fuel s-1
for each LTO mode. The ICAO LTO times-in-modes differ from the Danish time intervals in
table 3.1. To calculate the Danish LTO fuel consumption and emission factors the ICAO
emission indices and fuel consumption rates are combined with the Danish LTO
times-in-modes using the following equation:
![]() (1)
(1)
Where tm is the time in LTO-mode m and EIm and ffm the corresponding emission indices and fuel flows, respectively. For CO2 the LTO emission factors are calculated as LTO fuel use multiplied with the lower heating value (43.5 MJ/kg) and the fuel related CO2 emission factor (72 g CO2/MJ). The SO2 emission factors are derived from the fuel use factors by using a weight percent of 0.01% sulphur in the fuel. The atom weight of S equals the weight of O2 thus giving a mass ratio of 0.02% SO2 per unit of fuel used.
Table 3.4
LTO fuel use and emission factors
|
Aircraft type |
CO |
NOx |
VOC |
CO2 |
SO2 |
Fuel |
|
|
[kg/LTO] |
[kg/LTO] |
[kg/LTO] |
[kg/LTO] |
[kg/LTO] |
[kg/LTO] |
Copenhagen |
MD81 |
3.4 |
8.0 |
1.1 |
1,924 |
0.123 |
614 |
|
MD87 |
3.2 |
9.6 |
1.0 |
2,077 |
0.133 |
663 |
|
DC9 |
8.5 |
7.2 |
2.4 |
2,094 |
0.134 |
669 |
|
F50 |
2.8 |
2.9 |
0.2 |
929 |
0.059 |
297 |
|
B737 |
5.3 |
5.3 |
0.3 |
1,507 |
0.096 |
481 |
|
B767 |
3.7 |
21.2 |
0.3 |
3,595 |
0.230 |
1,148 |
|
F100 |
4.0 |
4.0 |
0.7 |
1,273 |
0.081 |
407 |
|
EA310 |
2.9 |
6.0 |
0.3 |
1,432 |
0.091 |
457 |
|
B757 |
6.0 |
12.3 |
0.6 |
2,774 |
0.177 |
886 |
|
EA320 |
3.1 |
7.3 |
0.3 |
1,636 |
0.104 |
522 |
|
B747 |
29.5 |
45.2 |
6.4 |
8,203 |
0.524 |
2,619 |
|
MD11 |
20.0 |
33.5 |
4.2 |
5,597 |
0.357 |
1,787 |
|
B727 |
3.4 |
10.4 |
1.0 |
2,177 |
0.139 |
695 |
|
L188 |
64.1 |
33.8 |
38.7 |
5,902 |
0.377 |
1,884 |
|
DC10 |
32.7 |
38.0 |
11.7 |
5,809 |
0.371 |
1,855 |
|
EA300 |
14.0 |
26.1 |
3.0 |
3,997 |
0.255 |
1,276 |
|
BA11 |
18.3 |
5.8 |
10.0 |
1,553 |
0.099 |
496 |
|
BA46 |
6.0 |
3.5 |
0.8 |
1,394 |
0.089 |
445 |
|
S365 |
0.4 |
0.1 |
0.0 |
96 |
0.006 |
31 |
|
SF34 |
0.9 |
0.5 |
0.1 |
200 |
0.013 |
64 |
|
Small aircraft |
7.1 |
0.9 |
1.3 |
74 |
0.005 |
23 |
Other airports |
F50 |
1.7 |
2.5 |
0.1 |
713 |
0.046 |
228 |
|
Small aircraft |
7.1 |
0.9 |
1.3 |
74 |
0.005 |
23 |
Fuel-based cruise emission factors are taken from CORINAIR (1996) as a single set for
large aircraft. Small aircraft do not have to meet any emission standards. Therefore, no
emission factors are available from approved emission measurement procedures. Instead
emission factors are estimated by using the fuel related emission factors for
non-catalytic cars. In addition all flying with small aircraft are assumed to take place
below 3000 ft.
3.5 Calculation of energy use and emissions
The energy use by large aircraft is calculated for both domestic and international LTOs by multiplying the LTO fuel consumption factor for each aircraft type with the corresponding number of LTOs.
The next step is to calculate the total cruise energy use by domestic and international flights as the difference between the total jet petrol sales in Denmark (DEA, 1999) and the total calculated LTO fuel use for domestic and international air traffic, respectively. No further distribution of cruise fuel use into aircraft types is made. Such an allocation has no physical meaning since only one set of cruise emission factors are available in the detailed calculation methodology.
In order to calculate the domestic and international LTO emissions, the number of LTOs for each aircraft type is multiplied with the respective emissions per LTO. The cruise emissions are estimated as the domestic and international cruise fuel use times their fuel related cruise emission factors. For small aircraft the fuel use is taken from domestic and international aviation gasoline sales statistics. The domestic and international emissions are calculated by multiplying the aviation gasoline fuel amount with the single set of fuel related LTO emission factors.
There is a need to improve some parts of the current model version. If aggregated emission factors for cruise and emission factors for LTO in provincial airports can be derived from a number of representative aircraft, more precise emission estimates are expected.
Table 3.6 Look here!
The Danish 1998 CORINAIR aircraft emission inventory
3.6 Aviation fuel statistics for Denmark, OECD and globally
The most recent year with aviation fuel statistics available for Denmark, OECD and globally is 1997. The total fuel sold in airports in the Kingdom of Denmark reflects the part of air traffic movements taking place. Some important factors that determine the number of flights are size of population, geographical situation, and economic growth and prosperity. This fuel sale number in 1997 account for a little more than 0.4% of the global fuel sale figure, almost 0.6% of the OECD total and around 2.2% of all fuel sold in airports in the EU. Due to definitions some differences occur between the International Energy Agency (IEA) and the Danish Energy Agency (DEA) aviation fuel statistics.
In IEA statistics (1999a and b) the fuel used by flights within Denmark and flights from Greenland and the Faroe islands bound for Denmark are included under domestic aviation. The domestic total is 117 kilotons of fuel and the number also include military fuel use. Domestic flights within Denmark use 55 kilotons of jet fuel, while the fuel used by flights from Greenland or the Faroe islands bound for Denmark use 62 kilotons of fuel. The latter fuel use number is based on the fuel sale from Danish Refineries to the airports in Greenland and the Faroe islands. The international fuel total is 675 kilotons and include the fuel used by all flights from Denmark and bound for Greenland, the Faroe Islands and other international countries.
The DEA statistics (1998) cover the domestic fuel used by all flights within Denmark (55 ktonnes). This number also includes the fuel used by military flights. The fuel used by flights from Denmark to Greenland, the Faroe islands and other international countries are reported as international fuel use. The fuel used by flights from Greenland or the Faroe islands and bound for Denmark is not included in the statistics.
Table 3.7
Aviation fuel sale figures for Denmark, OECD and globally
|
Domestic [ktonnes] |
International [ktonnes] |
Total [ktonnes] |
|||
|
Aviation gasoline2 |
Jet fuel |
Aviation gasoline2 |
Jet fuel |
Aviation gasoline |
Jet fuel |
World (IEA) |
- |
- |
- |
- |
2,338 |
189,8593 |
OECD (IEA) |
1,380 |
93,925 |
35 |
44,196 |
1,415 |
138,121 |
EU (IEA) |
117 |
7,780 |
2 |
27,450 |
119 |
35,230 |
Denmark (IEA) |
4 |
117 |
- |
675 |
4 |
792 |
Denmark4 (DEA) |
3 |
55 |
0 |
675 |
3 |
730 |
2
Also includes motor gasoline burned3 Also includes kerosene burned
4 From the Danish Energy Agency
4. New CORINAIR aircraft emission inventory
Several types of information must be available in order to set up the new CORINAIR
aircraft emission inventory system. Consistent data should be obtained for all flights in
terms of origin and destination airports, aircraft type etc. In parallel airport code
translations must be obtained and a classification of aircraft types must be made. Finally
fuel use and emission data must be provided to support the calculation procedure.
4.1 Aircraft categories and flight data
In general all flights can be denominated as Instrumental Flight Rules (IFR) flights, Visual Flight Rules (VFR) flights or military flights. IFR flights are guided by radar and ground control during the whole flight. Aircraft flying VFR are almost solely small gasoline-fuelled aircraft operating in altitudes with visual ground contact. The latter aircraft have only a very small share of the total fuel and emissions from aviation activities. Military flights are restricted by nature, which makes it difficult to obtain flight information on a satisfactory level.
4.1.1 ICAO aircraft classification
A systematic way to classify all single aircraft into major categories is to consider aircraft type, number of engines and engine principle. Such an overall categorisation of all aircraft is done by ICAO (1998). In this report aircraft type designators, Wake Turbulence Category (WTC) and aircraft type descriptions (overall type, number of engines and engine principle) are listed for all aircraft manufacturers and aircraft models present in today’s fleet, and larger than micro or ultra light types.
The aircraft designators are used for Air Traffic Service (ATS) and consist of no more than four characters usually derived from the manufacturers model number or model name, or from a common military type number. The WTC falls into three different Maximum Take Off Weight (MTOW) classes. A description of aircraft types consist of three characters namely the overall aircraft type, the number of engines and engine principle, respectively.
Table 4.1
ICAO WTC and aircraft types
WTC |
H (Heavy) |
Aircraft with MTOW of 136.000 kg or more |
|
M (Medium) |
Aircraft with MTOW between 136.000 kg and 7.000 kg |
|
L (Light) |
Aircraft with 7.000 kg MTOW or less |
Overall aircraft type |
L |
Landplane |
|
S |
Seaplane |
|
A |
Amphibian |
|
H |
Helicopter |
|
G |
Gyrocopter |
|
T |
Tilt-wing aircraft |
Engine principle |
P |
Piston engine |
|
T |
Turboprop engine |
|
J |
Jet engine |
The above-described ICAO codes was provided by the Danish Civil Aviation Administration
(CAA-DK) in electronic files to the present project. In total ICAO have 1731 aircraft type
designators. In some cases more than one aircraft manufacturer or aircraft model use the
same designator code; in total there are 2861 unique combinations of manufacturer, model
and type designator.
Table 4.2
A sample of aircraft classified according to the ICAO system
Aircraft manufacturer |
Aircraft model |
Type designator |
WTC |
Aircraft type |
BOEING |
707-100 (C-137B) |
B701 |
M |
L4J |
BOEING |
717-200 |
B712 |
M |
L2J |
BOEING |
720 |
B720 |
M |
L4J |
BOEING |
727-100 (C-22) |
B721 |
M |
L3J |
BOEING |
727-200 |
B722 |
M |
L3J |
BOEING |
737-100 |
B731 |
M |
L2J |
BOEING |
737-300 |
B733 |
M |
L2J |
BOEING |
737-400 |
B734 |
M |
L2J |
BOEING |
737-500 |
B735 |
M |
L2J |
BOEING |
737-600 |
B736 |
M |
L2J |
BOEING |
737-700 |
B737 |
M |
L2J |
BOEING |
737-800 |
B738 |
M |
L2J |
BOEING |
747-100 |
B741 |
H |
L4J |
BOEING |
747-300 |
B743 |
H |
L4J |
BOEING |
747-400 (AL-1) |
B744 |
H |
L4J |
BOEING |
747SCA Shuttle Carrier |
BSCA |
H |
L4J |
BOEING |
747SP |
B74S |
H |
L4J |
BOEING |
747SR |
B74R |
H |
L4J |
BOEING |
757-200 (C-32) |
B752 |
M |
L2J |
BOEING |
757-300 |
B753 |
M |
L2J |
BOEING |
767-200 |
B762 |
H |
L2J |
BOEING |
767-300 |
B763 |
H |
L2J |
BOEING |
777-200 |
B772 |
H |
L2J |
BOEING |
777-300 |
B773 |
H |
L2J |
4.1.2 ICAO airport and country code notation
CAA-DK also provided the entire world’s ICAO country and airport code notations in an electronic data file. A hardcopy version of the codes is printed in ICAO (1999). The first and second letter indicates the routing area and the state (or territory) respectively, of which the airport is situated. The telecommunication centre of which the airport is connected is referred to in the third letter, while the fourth letter is assigned as desired.
Table 4.3
A selection of Danish airports with country and airport codes
Country code |
Country |
Airport code |
Airport |
EK |
DENMARK |
EKAE |
AERO |
EK |
DENMARK |
EKAH |
AARHUS |
EK |
DENMARK |
EKAL |
ALLEROD (PRIVATE AD) |
EK |
DENMARK |
EKAT |
ANHOLT |
EK |
DENMARK |
EKBI |
BILLUND |
EK |
DENMARK |
EKCH |
KOBENHAVN/KASTRUP |
EK |
DENMARK |
EKEB |
ESBJERG |
EK |
DENMARK |
EKEL |
ENDELAVE (PRIVATE AD) |
EK |
DENMARK |
EKFA |
FRODBA (FAROE ISLANDS) |
EK |
DENMARK |
EKGF |
TYRA OST |
EK |
DENMARK |
EKMC |
KARUP (RCC) |
EK |
DENMARK |
EKMK |
KARUP MIL MET CENTRE |
EK |
DENMARK |
EKMN |
KOSTER VIG |
EK |
DENMARK |
EKNM |
MORSO |
EK |
DENMARK |
EKNS |
NAKSKOV |
EK |
DENMARK |
EKOD |
ODENSE |
EK |
DENMARK |
EKPB |
KRUSA-PADBORG |
EK |
DENMARK |
EKRD |
RANDERS |
EK |
DENMARK |
EKRK |
KOBENHAVN/ROSKILDE |
EK |
DENMARK |
EKRN |
BORNHOLM/RONNE |
EK |
DENMARK |
EKRR |
RO |
EK |
DENMARK |
EKRS |
RINGSTED |
EK |
DENMARK |
EKSA |
SAEBY/OTTESTRUP |
EK |
DENMARK |
EKSB |
SONDERBORG |
EK |
DENMARK |
EKVG |
VAGAR (FAROE ISLAND) |
EK |
DENMARK |
EKVH |
AARS |
EK |
DENMARK |
EKVJ |
STAUNING |
EK |
DENMARK |
EKVL |
VAERLOSE (MIL) |
EK |
DENMARK |
EKYT |
AALBORG (CIV/MIL) |
4.1.3 EUROCONTROL IFR flight data
From the European Organisation for the Safety of Air Navigation (EUROCONTROL) log files were received with information on all IFR flights from Denmark in 1998. Even though Greenland and the Faroe Islands are a part of the Kingdom of Denmark they are not members of EUROCONTROL and therefore data are only provided for a limited number of flights leaving these two geographical areas. Those are flights going through EUROCONTROL area, and effectively this means flights bound for European countries such as Denmark, Norway and Scotland. According to the same definition internal flights in Greenland and the Faroes are excluded together with flights for Canada and Iceland. For consistency reasons all flights from Greenland and the Faroes are excluded from the present inventory.
Every flight was recorded by date and time of departure, origin and destination airport code, type designator, aircraft call sign and airline company name. Also the great circle distance between origin and destination airports was stated.The great circle distance is measured as the length of a natural curve between the origin and destination airports with no mileage compensation for actual flight profiles or the actual route followed. In many cases the great circle routing assumption is too idealistic. Stacking often occurs at airports - especially during peak hours – and flying must some times avoid restricted areas, e.g. areas with military activity.
A subsequent count on the number of flights and also a data query on specific aircraft types revealed 205.098 IFR flights represented by 223 different type designators. For reasons of consistency flights from Greenland and the Faroes to Denmark (1432) and other international flights (65) were excluded. Some flights were excluded from the inventory due to lack of fuel use and emission data; namely all piston engined flights (3846), military aircraft (330) and helicopter operations (133). Omitted were also flights with no indication of great circle distance, i.e. with same origin and destination airport code stated. Many of these flights (1652) were actually piston engined flights or flights of a military character.
Table 4.4
EUROCONTROL data for some flights in 1998
Date |
Time |
Origin |
Destination |
Type designator |
Call sign |
Company |
Great circle distance |
0107 |
1925 |
BGBW |
EKCH |
B73B |
GRL786 |
GRL |
3322 |
0114 |
1850 |
BGBW |
EKCH |
B73B |
GRL786 |
GRL |
3322 |
0102 |
1906 |
BGSF |
EKCH |
B767 |
SAS292 |
SAS |
3425 |
0105 |
1905 |
BGSF |
EKCH |
B767 |
SAS292 |
SAS |
3425 |
0107 |
0058 |
BGSF |
EKCH |
B727 |
GRL782 |
GRL |
3425 |
0107 |
1859 |
BGSF |
EKCH |
B767 |
SAS292 |
SAS |
3425 |
0109 |
1852 |
BGSF |
EKCH |
B767 |
SAS292 |
SAS |
3425 |
0112 |
1854 |
BGSF |
EKCH |
B767 |
SAS292 |
SAS |
3425 |
0114 |
1157 |
BGSF |
EKCH |
B727 |
GRL3782 |
GRL |
3425 |
0114 |
1846 |
BGSF |
EKCH |
B767 |
SAS292 |
SAS |
3425 |
0116 |
1836 |
BGSF |
EKCH |
B767 |
SAS292 |
SAS |
3425 |
0119 |
1837 |
BGSF |
EKCH |
B767 |
SAS292 |
SAS |
3425 |
0120 |
2009 |
BGSF |
EKCH |
B727 |
GRL782 |
GRL |
3425 |
0121 |
1837 |
BGSF |
EKCH |
B767 |
SAS292 |
SAS |
3425 |
0123 |
1835 |
BGSF |
EKCH |
B767 |
SAS292 |
SAS |
3425 |
0126 |
1839 |
BGSF |
EKCH |
B767 |
SAS292 |
SAS |
3425 |
0128 |
1822 |
BGSF |
EKCH |
B767 |
SAS292 |
SAS |
3425 |
0130 |
1835 |
BGSF |
EKCH |
B767 |
SAS292 |
SAS |
3425 |
0107 |
1507 |
BGSF |
EKVL |
GULF |
DAF313 |
021 |
3399 |
0120 |
1558 |
BGSF |
EKVL |
GULF |
DAF249 |
021 |
3399 |
0122 |
1657 |
BGSF |
EKVL |
C130 |
DAF679 |
021 |
3399 |
0108 |
2358 |
BGSF |
ENZV |
FA20 |
GRL5603 |
GRL |
2871 |
0118 |
0458 |
BGSF |
ESGG |
BA11 |
N17MK |
|
3248 |
0113 |
1825 |
BGTL |
EKCH |
B767 |
SAS7287 |
SAS |
3853 |
The EUROCONTROL origin and destination airport codes and aircraft type designators use
ICAO nomenclature and can be used as entries in the airport and country code translation
tables described in paragraph 4.1 and 4.2. This coupling of data enables all flights to be
grouped into domestic and international flights and in turn facilitates further fuel use
and emission calculations.
4.2 Representative aircraft and groupings
Fuel use and emission data is not readily available for each of the 223 different aircraft type designators in this project. A grouping has to be made into a smaller number of aircraft types representing the whole aircraft fleet and for which fuel use and emission data exist. In the present chapter the representative aircraft types are listed with their WTC and a description of overall aircraft type, number of engines, engine principle and approximate MTOW. These parameters are used as guidelines to append a representative aircraft type to each of the aircraft types present in the Danish inventory.
4.2.1 Representative aircraft
CORINAIR use 24 representative aircraft for jets and turbo-props. Their respective fuel use and emissions come from different simulation models with underlying assumptions that among others vary with respect to the choice of Take off Weight (TOW) in the actual simulation procedure. Instead the MTOW’s have been found in Frawley (1999). In many situations the representative aircraft type comprises several models with varying MTOW’s (and seating capacities) and due to this the indicated weight numbers must be regarded only as approximate values.
Table 4.5
Representative aircraft and size characterisations
Representative aircraft |
Category |
WTC |
MTOW (Frawley) |
A310 |
L2J |
H |
142 |
A320 |
L2J |
M |
73.5 |
A330 |
L2J |
H |
220 |
A340 |
L4J |
H |
275 |
BAC1-11 |
L2J |
M |
40 |
Bae146 |
L4J |
M |
42 |
B727 |
L3J |
M |
95 |
B737 100 |
L2J |
M |
52 |
B737 400 |
L2J |
M |
63 |
B747 100-300 |
L4J |
H |
362 |
B747 400 |
L4J |
H |
362 |
B757 |
L2J |
M |
116 |
B767 300ER |
L2J |
H |
182 |
B777 |
L2J |
H |
247 |
DC9 |
L2J |
M |
55 |
DC10 |
L3J |
H |
259 |
F28 |
L2J |
M |
33 |
F100 |
L2J |
M |
43 |
MD82-88 |
L2J |
M |
64 |
RJ 100 |
L2J |
M |
18 |
Dash8 400 |
L2T |
M |
27.3 |
F50 |
L2T |
M |
20.8 |
Shorts 360 300 |
L2T |
M |
12.3 |
S2000 |
L2T |
M |
22.8 |
4.2.2 Fuel use and emission data
In the new version fuel use and emission factors have been changed to more representative numbers for representative aircraft during LTO and cruise. In most cases the aircraft are generic. This means that the worldwide population of engines fitted to the aircraft in question is considered calculating the fuel use and emission factors. The factors for LTO are based upon ICAO LTO times-in-modes (see paragraph 4.2). For cruise the biggest improvement is the shift from rough fuel-based emission data to factors given per distance flown.
The new CORINAIR data can be found on http://www.eu.int.aegb/. They have been gathered mainly by harmonising existing data from the ANCAT/EC2 global aircraft emission inventory (ANCAT/EC2, 1998) and the European 4th framework project MEET (Methodologies to Estimate the Emissions from Transport), see MEET (1999). Data for small jets and turbo-props have been provided by FFA (2000).
In appendix 1 all fuel use and emission numbers are listed. The LTO figures are also displayed in graphs together with their emission indices (EI) in g per kg fuel burned. The engines used in the simulations are displayed in appendix 2. For the Dash8 400 and S2000 aircraft types no CO emission data were available. Instead the CO emission indices for F50 were used and emission numbers subsequently calculated as emission indices times fuel use for the two aircraft.
Since the simulated data derive from different models it is important to emphasise that inter-aircraft comparisons should be made with care for some aircraft. Also due to model boundary conditions the uncertainties on cruise fuel use and emissions are greater for the shortest distances. Therefore no attempts have been made in this report to analyse in more details the difference in background data for cruise emissions between representative aircraft.
Table 4.6
Data sources for fuel use and emissions
Representative aircraft |
Fuel |
NOx |
CO |
VOC |
A310 |
ANCAT/EC2 |
ANCAT/EC2 |
MEET |
MEET |
A320 |
ANCAT/EC2 |
ANCAT/EC2 |
MEET |
MEET |
A330 |
ANCAT/EC2 |
ANCAT/EC2 |
MEET |
MEET |
A340 |
ANCAT/EC2 |
ANCAT/EC2 |
MEET |
MEET |
BAC1-11 |
ANCAT/EC2 |
ANCAT/EC2 |
MEET |
MEET |
BAe146 |
ANCAT/EC2 |
ANCAT/EC2 |
MEET |
MEET |
B727 |
ANCAT/EC2 |
ANCAT/EC2 |
MEET |
MEET |
B737 100 |
ANCAT/EC2 |
ANCAT/EC2 |
MEET |
MEET |
B737 400 |
ANCAT/EC2 |
ANCAT/EC2 |
MEET |
MEET |
B747 100-300 |
ANCAT/EC2 |
ANCAT/EC2 |
MEET |
MEET |
B747 400 |
ANCAT/EC2 |
ANCAT/EC2 |
MEET |
MEET |
B757 |
ANCAT/EC2 |
ANCAT/EC2 |
MEET |
MEET |
B767 300ER |
ANCAT/EC2 |
ANCAT/EC2 |
MEET |
MEET |
B777 |
ANCAT/EC2 |
ANCAT/EC2 |
MEET |
MEET |
DC9 |
ANCAT/EC2 |
ANCAT/EC2 |
MEET |
MEET |
DC10 |
ANCAT/EC2 |
ANCAT/EC2 |
MEET |
MEET |
F28 |
ANCAT/EC2 |
ANCAT/EC2 |
MEET |
MEET |
F100 |
ANCAT/EC2 |
ANCAT/EC2 |
MEET |
MEET |
MD82-88 |
ANCAT/EC2 |
ANCAT/EC2 |
MEET |
MEET |
RJ 100 |
FFA |
FFA |
FFA |
FFA |
Dash8 400 |
FFA |
FFA |
FFA |
FFA |
F50 |
FFA |
FFA |
FFA |
FFA |
Shorts 360 300 |
FFA |
FFA |
FFA |
FFA |
S2000 |
FFA |
FFA |
FFA |
FFA |
Apart from the airframe design fuel use and emissions heavily depend on the TOW, the
engines installed and their corresponding emission indices are measured during the four
modes of the LTO-cycle.
4.3 Grouping of aircraft
When fuel use and emission data are provided for representative aircraft types, all aircraft types present in the Danish inventory must be sufficiently grouped prior to the actual calculation procedure. In this study two parameters have determined the performance of the grouping procedure namely the aircraft engine principle and the aircraft size.
At first the actual aircraft engine principle is determined. A distinguishment is made between jets and turbo-propelled aircraft. Secondly a representative aircraft type with similar size is appended to the aircraft in question. The approximate MTOW number found in Frawley (1999) for each aircraft type supports this point of the grouping procedure. All aircraft and their representative types are listed in appendix 3.
The allocation of representative to actual aircraft types could be more detailed. In situations where large differences between actual and representative aircraft sizes exist, the fuel use and emissions for representative aircraft could be scaled with the actual/representative aircraft MTOW ratio. Or if more similar sized representative aircraft were available: Let the aircraft model date of entering into service decide the choice of representative aircraft. In this way the inventory would also reflect the modernity of the aircraft fleet.
Mainly two reasons explain why the suggestions for further refinement of the aircraft grouping has not been implemented in this study. In some cases the efforts do not bear comparison with the obtained improvements. As stated elsewhere in this report the actual TOW for an aircraft in many cases differ from the indicated MTOW. Furthermore it should be possible for other inventory makers to build a similar aircraft fuel use and emission inventory from a reasonable level of experience.
4.4 Fuel use and emission results
In the following the procedure for calculating LTO and cruise fuel use and emissions will be explained. Separate results will be listed for Denmark, Greenland and the Faroe islands and will be further divided into domestic and international figures.
4.4.1 Calculation procedure
To calculate the LTO fuel use and emissions the following equation is used for each flight:'
![]() (2)
(2)
Where Ei is the fuel use or emission contribution from each of the five LTO-modes: Approach/landing, taxi in, taxi out, take off and climb out listed in appendix 1 for all representative aircraft. Appendix 1 gives figures for 13 mins in the taxi in and out modes, while more appropriate time intervals are 5.5 mins in Copenhagen Airport and 2.5 mins in other airports present in the Danish inventory. The fuel use and emission numbers are automatically downscaled in the calculation procedure according to this rationale.
In order to estimate the cruise fuel use and emissions for each flight two equations are used. If xi and xmax denominate the separate distances and the maximum distance, respectively for which fuel use and emissions are known, and y denominates the great circle distance for the individual flight in nautical miles, then the fuel use or emission E (y) becomes:
| xi<y<xi+1, i = 0,1,2….max (3) |
If the flight distance y exceeds xmax the equation for calculating fuel use and emissions is:
| y>xmax (4) |
In appendix 1 the fuel use and emissions for separate distances and all representative aircraft are listed.
The grand totals for fuel use and emissions are computed by adding all the fuel uses and emissions estimated for each flight in (2) for LTO, and (3) or (4) for cruise.
4.4.2 Fuel use and emissions for LTO
Table 4.7 and 4.8 list the total fuel use, emissions and derived emission indices for Danish domestic LTOs per representative aircraft and for LTO modal splits, respectively. The same LTO figures are shown in table 4.9 and 4.10 for flights bound for Greenland and the Faroe islands.
Table 4.7
Danish domestic LTO fuel use and emissions for representative aircraft
Rep. type |
Fuel |
NOx |
VOC |
CO |
EINOx |
EIVOC |
EICO |
No. of LTOs |
|
[tonnes] |
[tonnes] |
[tonnes] |
[tonnes] |
[g/kg] |
[g/kg] |
[g/kg] |
|
A310 |
164 |
3 |
0 |
1 |
18.9 |
1.6 |
7.6 |
145 |
A320 |
131 |
2 |
0 |
2 |
17.1 |
2.7 |
17.0 |
231 |
A330 |
27 |
1 |
0 |
0 |
20.1 |
0.5 |
5.0 |
16 |
B727 |
576 |
7 |
2 |
6 |
11.5 |
2.8 |
10.9 |
601 |
B737 100 |
4 |
0 |
0 |
0 |
11.4 |
0.5 |
3.0 |
6 |
B737 400 |
4,062 |
52 |
1 |
27 |
12.8 |
0.3 |
6.6 |
7,319 |
B747 400 |
5 |
0 |
0 |
0 |
22.1 |
0.4 |
2.1 |
2 |
B757 |
1 |
0 |
0 |
0 |
21.5 |
0.4 |
3.6 |
1 |
B767 300 ER |
101 |
2 |
0 |
0 |
20.4 |
0.3 |
1.9 |
85 |
BAe146 |
47 |
0 |
0 |
0 |
9.2 |
0.9 |
7.7 |
128 |
Dash8 400 |
10 |
0 |
0 |
0 |
12.1 |
0.0 |
4.7 |
66 |
DC10-30 |
19 |
0 |
0 |
0 |
23.0 |
4.2 |
11.2 |
11 |
DC9 |
379 |
4 |
0 |
1 |
10.8 |
0.6 |
3.6 |
651 |
F100 |
4 |
0 |
0 |
0 |
11.8 |
1.0 |
8.2 |
9 |
F28 |
12 |
0 |
0 |
0 |
11.0 |
22.5 |
25.0 |
28 |
F50 |
2,796 |
29 |
0 |
15 |
10.3 |
0.0 |
5.5 |
25,532 |
MD 82 |
10,946 |
174 |
14 |
42 |
15.9 |
1.2 |
3.9 |
15,584 |
RJ 100 |
219 |
2 |
0 |
2 |
7.7 |
1.0 |
10.6 |
1,489 |
S2000 |
22 |
0 |
0 |
0 |
7.8 |
0.2 |
4.8 |
183 |
Shorts 360 300 |
819 |
4 |
6 |
28 |
4.9 |
7.0 |
33.9 |
11,208 |
Total LTO |
20,343 |
280 |
24 |
127 |
13.8 |
1.2 |
6.3 |
63,295 |
Table 4.8
Danish domestic LTO mode fuel use and emission totals
Mode |
Fuel |
NOx |
VOC |
CO |
EINOx |
EIVOC |
EICO |
No. of LTOs |
|
[tonnes] |
[tonnes] |
[tonnes] |
[tonnes] |
[g/kg] |
[g/kg] |
[g/kg] |
|
Approach landing |
5,847 |
50 |
6 |
29 |
8.6 |
1.1 |
5.0 |
|
Climb out |
7,352 |
144 |
2 |
9 |
19.6 |
0.3 |
1.3 |
|
Take off |
2,803 |
65 |
1 |
2 |
23.1 |
0.2 |
0.9 |
|
Taxi in |
2,168 |
10 |
7 |
43 |
4.8 |
3.4 |
19.9 |
|
Taxi out |
2,174 |
10 |
7 |
43 |
4.8 |
3.4 |
19.9 |
|
Total LTO |
20,343 |
280 |
24 |
127 |
13.8 |
1.2 |
6.3 |
63,295 |
Table 4.9
LTO fuel use ansd emissions for flights bound for Greenland and the Faroe Islands
Rep. type |
Fuel |
NOx |
VOC |
CO |
EINOx |
EIVOC |
EICO |
No. of LTOs |
|
[tonnes] |
[tonnes] |
[tonnes] |
[tonnes] |
[g/kg] |
[g/kg] |
[g/kg] |
|
B727 |
1 |
0 |
0 |
0 |
10.9 |
3.3 |
12.6 |
1 |
B737 400 |
258 |
3 |
0 |
2 |
12.3 |
0.4 |
8.1 |
436 |
B757 |
94 |
2 |
0 |
1 |
19.4 |
0.6 |
6.0 |
98 |
B767 300 ER |
260 |
5 |
0 |
1 |
19.3 |
0.4 |
2.4 |
205 |
BAe146 |
193 |
2 |
0 |
2 |
8.6 |
1.2 |
10.9 |
462 |
Dash8 400 |
3 |
0 |
0 |
0 |
12.1 |
0.0 |
4.7 |
19 |
F28 |
9 |
0 |
0 |
0 |
11.5 |
18.4 |
21.3 |
22 |
MD 82 |
1 |
0 |
0 |
0 |
15.0 |
1.4 |
4.5 |
1 |
RJ 100 |
3 |
0 |
0 |
0 |
7.7 |
1.0 |
10.6 |
17 |
Grand total |
821 |
12 |
1 |
6 |
14.4 |
0.8 |
6.8 |
1,261 |
Table 4.10
LTO mode fuel use and emissions totals for flights bound for Greenland and the Faroe
Islands
Mode |
Fuel |
NOx |
VOC |
CO |
EINOx |
EIVOC |
EICO |
No. of LTOs |
|
[tonnes] |
[tonnes] |
[tonnes] |
[tonnes] |
[g/kg] |
[g/kg] |
[g/kg] |
|
Approach landing |
203 |
2 |
0 |
1 |
8.4 |
0.4 |
3.6 |
|
Climb out |
314 |
6 |
0 |
0 |
20.5 |
0.2 |
1.0 |
|
Take off |
121 |
3 |
0 |
0 |
24.2 |
0.2 |
0.9 |
|
Taxi in |
91 |
0 |
0 |
2 |
4.2 |
2.8 |
24.6 |
|
Taxi out |
91 |
0 |
0 |
2 |
4.2 |
2.8 |
24.6 |
|
Total LTO |
821 |
12 |
1 |
6 |
14.4 |
0.8 |
6.8 |
1,261 |
The aircraft in North-Atlantic service between Denmark and Greenland in particular are
larger sized than the aircraft flying Danish domestic trips. This is reflected in more
fuel use in relative numbers, and on average a bigger EINOx and smaller EIVOC
and EICO’s. In this way the B767 has a great impact on the total result. This
particular aircraft consumes one-third of the total fuel used by North-Atlantic flights,
and has relatively large EINOx and small EIVOC and EICO’s.
Also results for the total fuel use, emissions and derived emission indices for Danish international LTOs per representative aircraft and for LTO modal splits are given in the tables 4.11 and 4.12, respectively.
The total EINOx number is almost the same for Danish domestic and international LTOs, while international EIVOC and EICO show an increase of about 40 and 20%, respectively. The larger EIVOC for international LTOs is mainly because of the more frequent use of F28 and due to a smaller relative importance of the F50, for which VOC measured is below detection limit. For EICO more F28 LTOs and the use of A320 in international traffic also cause the increase. Moreover the relative importance of fuel used for LTOs by MD82 (with fairly low EICOs) in international traffic is minor compared to the fuel use weightings of domestic LTOs.
Table 4.11
Danish international LTO fuel use and emissions for representative aircraft
Rep. type |
Fuel |
NOx |
VOC |
CO |
EINOx |
EIVOC |
EICO |
No. of LTOs |
|
[tonnes] |
[tonnes] |
[tonnes] |
[tonnes] |
[g/kg] |
[g/kg] |
[g/kg] |
|
A310 |
2,428 |
44 |
5 |
22 |
18.3 |
1.9 |
9.2 |
2,046 |
A320 |
2,779 |
46 |
7 |
49 |
16.5 |
2.6 |
17.8 |
4,644 |
A330 |
296 |
6 |
0 |
2 |
19.9 |
0.5 |
5.2 |
176 |
A340 |
367 |
8 |
2 |
5 |
21.5 |
5.1 |
13.7 |
237 |
B727 |
3,114 |
34 |
10 |
38 |
11.0 |
3.2 |
12.2 |
3,078 |
B737 100 |
1,511 |
16 |
1 |
6 |
10.6 |
0.5 |
3.7 |
2,259 |
B737 400 |
14,163 |
174 |
6 |
114 |
12.3 |
0.4 |
8.1 |
23,992 |
B747 400 |
1,308 |
26 |
1 |
4 |
20.1 |
0.4 |
3.4 |
498 |
B757 |
1,119 |
22 |
1 |
7 |
19.4 |
0.6 |
5.9 |
1,172 |
B767 300 ER |
4,655 |
90 |
2 |
11 |
19.3 |
0.4 |
2.4 |
3,666 |
B777 |
6 |
0 |
0 |
0 |
25.1 |
5.1 |
13.7 |
3 |
BAC1-11 |
76 |
1 |
2 |
3 |
9.4 |
20.3 |
36.8 |
161 |
BAe146 |
1,596 |
14 |
2 |
18 |
8.5 |
1.2 |
11.0 |
3,813 |
Dash8 400 |
277 |
3 |
0 |
2 |
11.0 |
0.0 |
5.6 |
1,379 |
DC10-30 |
1,848 |
41 |
9 |
25 |
22.2 |
5.0 |
13.5 |
1,040 |
DC9 |
6,868 |
71 |
4 |
29 |
10.3 |
0.7 |
4.2 |
10,954 |
F100 |
415 |
4 |
1 |
5 |
10.3 |
1.3 |
12.1 |
785 |
F28 |
1,111 |
11 |
34 |
36 |
10.0 |
30.6 |
32.3 |
2,387 |
F50 |
2,690 |
26 |
0 |
16 |
9.8 |
0.0 |
6.0 |
21,118 |
MD 82 |
21,725 |
326 |
30 |
98 |
15.0 |
1.4 |
4.5 |
28,706 |
RJ 100 |
665 |
5 |
1 |
8 |
7.5 |
1.1 |
11.6 |
4,372 |
S2000 |
188 |
1 |
0 |
1 |
7.3 |
0.2 |
5.3 |
1,400 |
Shorts 360 300 |
601 |
3 |
4 |
20 |
5.0 |
6.7 |
32.7 |
8,427 |
Total LTO |
69,807 |
973 |
121 |
517 |
13.9 |
1.7 |
7.4 |
126,313 |
Table 4.12
Danish international LTO mode fuel use and emission totals
Mode |
Fuel |
NOx |
VOC |
CO |
EINOx |
EIVOC |
EICO |
No. of LTOs |
|
[tonnes] |
[tonnes] |
[tonnes] |
[tonnes] |
[g/kg] |
[g/kg] |
[g/kg] |
|
Approach landing |
17,443 |
146 |
21 |
97 |
8.4 |
1.2 |
5.6 |
|
Climb out |
25,442 |
518 |
7 |
28 |
20.4 |
0.3 |
1.1 |
|
Take off |
9,851 |
237 |
2 |
8 |
24.1 |
0.2 |
0.8 |
|
Taxi in |
8,531 |
36 |
45 |
192 |
4.2 |
5.3 |
22.5 |
|
Taxi out |
8,539 |
36 |
45 |
192 |
4.2 |
5.3 |
22.5 |
|
Total LTO |
69,807 |
973 |
121 |
517 |
13.9 |
1.7 |
7.4 |
126,313 |
4.4.3 Fuel use and emissions for cruise
Cruise fuel use, emissions and emission indices calculated for domestic flights with origin and destination airports in Denmark are listed in table 4.13 and for the flights between Denmark, Greenland and the Faroe Islands in the tables 4.14 and 4.15, respectively. The same numbers are listed in table 4.18 for flights leaving Danish airports with foreign destinations.
Table 4.13 Look here!
Danish domestic cruise fuel use and emissions
Table 4.14
Cruise fuel use and emissions for flights between Denmark and Faroe islands
Rep. type |
Dist- |
Fuel |
NOx |
VOC |
CO |
EINOx |
EIVOC |
EICO |
No. of LTOs |
|
[1000 km] |
[tonnes] |
[kg] |
[kg] |
[kg] |
[g/kg] |
[g/kg] |
[g/kg] |
|
B737 400 |
296 |
1,637 |
16,125 |
163 |
2,933 |
9.8 |
0.1 |
1.8 |
424 |
BAe146 |
332 |
1,685 |
12,589 |
602 |
2,003 |
7.5 |
0.4 |
1.2 |
462 |
Dash8 400 |
6 |
19 |
285 |
0 |
96 |
15.1 |
0.0 |
5.1 |
10 |
F28 |
3 |
15 |
154 |
24 |
20 |
10.0 |
1.5 |
1.3 |
5 |
RJ 100 |
3 |
8 |
64 |
2 |
23 |
7.9 |
0.3 |
2.9 |
5 |
Total |
642 |
3,364 |
29,217 |
791 |
5,075 |
8.7 |
0.2 |
1.5 |
906 |
Table 4.15
Cruise fuel use and emissions for flights between Denmark and Greenland
Rep. type |
Dist- ance |
Fuel |
NOx |
VOC |
CO |
EINOx |
EIVOC |
EICO |
No. of LTOs |
|
[1000 km] |
[tonnes] |
[kg] |
[kg] |
[kg] |
[g/kg] |
[g/kg] |
[g/kg] |
|
B727 |
2 |
15 |
131 |
6 |
24 |
8.9 |
0.4 |
1.7 |
1 |
B737 400 |
22 |
121 |
1,134 |
8 |
160 |
9.4 |
0.1 |
1.3 |
12 |
B757 |
179 |
1,265 |
17,820 |
1,216 |
1,742 |
14.1 |
1.0 |
1.4 |
98 |
B767 300 ER |
382 |
3,523 |
47,235 |
1,628 |
4,410 |
13.4 |
0.5 |
1.3 |
205 |
Dash8 400 |
16 |
49 |
697 |
0 |
225 |
14.2 |
0.0 |
4.6 |
9 |
F28 |
32 |
140 |
1,331 |
153 |
93 |
9.5 |
1.1 |
0.7 |
17 |
MD 82 |
2 |
12 |
135 |
5 |
15 |
11.5 |
0.4 |
1.3 |
1 |
RJ 100 |
22 |
50 |
376 |
11 |
103 |
7.5 |
0.2 |
2.1 |
12 |
Total |
632 |
5,175 |
68,859 |
3,028 |
6,772 |
13.3 |
0.6 |
1.3 |
355 |
Table 4.16 Look here!
Danish international cruise fuel use and emissions
4.4.4 Result summary
Danish international flights stand for almost two third of all flights and have even larger shares of fuel use and emissions; in total between 80 and almost 90%. This is explained by the presence of larger sized aircraft in service and longer flying distances. For LTO the international shares are close to 80% - due to larger aircraft and more flights – and for cruise around 90% because of larger aircraft and more and longer flights. Although fuel use and emissions are only between 1 and 2% in total numbers North Atlantic flights between Denmark and Greenland/Faroes reveal the same trend by shares as for Danish international flights.
Table 4.17 Look here!
Summary of fuel use and emissions
Almost one third of all flights are Danish domestic flights. Opposed to international flights they have more moderate fuel use and emission shares compared to flight numbers. The reason is the use of smaller aircraft and shorter trips.
In grand totals the fuel use computed with the new methodology only amounts to 80% of the jet fuel sold in Danish airports for civil aviation purposes. Since international flights use almost 97% of all Danish jet fuel according to fuel sale statistics, variations between fuel sale figures and computed numbers are quite similar to the differences that appears for this sector.
Although helicopter operations are excluded by the new methodology, the smaller calculated fuel use amount and the large domestic fuel use deviation must primarily be explained by other factors. Many parameters have a potential effect on the precision of the fuel balance. These are the use of jet petrol for non-aviation purposes or military flying, fuel tankering and inaccurate domestic/international energy statistics. Factors which can affect the actual city-pair estimations are stacking at airports, the omittance of flights with the same origin and destination airports, model simulation uncertainties during the cruise flying phase, inaccurate LTO-modal timings or unrepresentative groupings for some of the aircraft into representative types.
Table 4.18
Fuel use and emission shares
|
|
Fuel |
NOx |
VOC |
CO |
CO2 |
SO2 |
No. of LTOs |
Totals |
Denmark, |
8.5 |
9.2 |
10.4 |
16.2 |
8.5 |
8.5 |
33.2 |
|
Denmark- |
1.6 |
1.4 |
1.1 |
1.1 |
1.6 |
1.6 |
0.7 |
|
Denmark, international |
90.0 |
89.4 |
88.5 |
82.7 |
90.0 |
90.0 |
66.2 |
|
Sum |
100.0 |
100.0 |
100.0 |
100.0 |
100.0 |
100.0 |
100.0 |
LTO |
Denmark, |
22.4 |
22.1 |
16.4 |
19.6 |
22.4 |
22.4 |
33.2 |
|
Denmark- |
0.9 |
0.9 |
0.5 |
0.9 |
0.9 |
0.9 |
0.7 |
|
Denmark, international |
76.7 |
76.9 |
83.2 |
79.5 |
76.7 |
76.7 |
66.2 |
|
|
100.0 |
100.0 |
100.0 |
100.0 |
100.0 |
100.0 |
100.0 |
Cruise |
Denmark, |
6.0 |
6.6 |
6.9 |
13.9 |
6.0 |
6.0 |
33.2 |
|
Denmark- |
1.7 |
1.5 |
1.5 |
1.3 |
1.7 |
1.7 |
0.7 |
|
Denmark, international |
92.4 |
91.9 |
91.6 |
84.9 |
92.4 |
92.4 |
66.2 |
|
Sum |
100.0 |
100.0 |
100.0 |
100.0 |
100.0 |
100.0 |
100.0 |
By the end of the present project period the domestic fuel sale figure was only half of
the present inventory’s computed fuel consumption. This difference is due to
inaccurate domestic/international energy statistics where the amount of fuel sold for
international aviation becomes accordingly bigger. After the finalisation of the present
project the fuel sale statistics have been revised jointly by the DEA and the Ministry of
Transport and the domestic fuel sale figure is now almost equal to the computed fuel
consumption in the present inventory.
In figure 4.1 the North Atlantic flights are classified as international air traffic. The international cruise emissions of NOx and CO2 amount to around 80% of the Danish aviation totals. Moreover, most of them are injected directly to the atmosphere by jet aircraft and at flying altitudes between 9 and 11 km. In these altitude bands the NOx emissions have the most harmful effects. Flying with turbo-props and the short distanced Danish domestic trips have less importance to the greenhouse effect. This is due to their limited share of total fuel burned and their typical flight profiles. The latter trips are flown at maximum altitudes between 5 and 7 km and for turbo-prop flying in general the ideel cruise levels are between 6 and 8 km.
Figure 4.1
Danish aviation emission shares
The domestic VOC and CO totals are very dominated by the high emissions during the LTO taxi-phase, see table 4.8. For both domestic and international flights the LTO emission shares of VOC and CO become 37 and 41%, respectively. Danish taxi-time intervals are around 11 mins in Copenhagen Airport (table 3.1) and five mins in the provincial airports. Both taxi-time durations are significantly lower than the 26 mins taxi-time in the ICAO LTO cycle. This emphasises the importance of using realistic LTO timings; if the ICAO standard LTO timings were used the VOC and CO emission factors would be overestimated, thus leading to even higher LTO emission percentages of air traffic emission totals.
4.4.5 Fuel use and emissions for typical flights
Table 4.19 Look here!
Some international flights from Copenhagen Airport
To assess the fuel use and CO2 emissions for transport modal shifts relevant data are obtained for one domestic trip and two European trips. Due to scarce data on occupancy rates for international travels a 100% occupancy rate is assumed for the four different transport modes in the scenario (private car: 5 persons). Moreover the emission components of NOx, CO, VOC and SO2 are omitted from the present exercise, mainly due to lack of consistent emission data from power plants outside Denmark producing electricity.
The TEMA2000 model is used to calculate the results for the domestic trip between Copenhagen and Aalborg (Trafikministeriet, 2000). The model has incorporated realistic transport route choices, vehicle types and driving conditions. For aviation TEMA2000 is evaluated in more details in paragraph 5.3. More specifically the private car data is valid for an engine size between 1.4 and 2.0 l. and data for a long distance tourist bus represent this transport category. It is also assumed that both vehicle types comply with the EURO II emission technology.
Table 4.20
Modal shift variations in fuel use and CO2 emissions per seat for three
trips
|
Energy [MJ/seat] |
|||
|
Private car |
Bus |
Train |
MD82 |
Copenhagen - Aalborg |
208.4 |
85.7 |
90.5 |
529.0 |
Copenhagen - Paris |
591.8 |
198.7 |
162.8 |
1,355.5 |
Copenhagen - Malaga |
1,475.5 |
495.3 |
479.7 |
2,759.9 |
|
CO2 [kg/seat] |
|||
|
Private car |
Bus |
Train |
MD82 |
Copenhagen - Aalborg |
15.3 |
6.3 |
6.7 |
38.1 |
Copenhagen - Paris |
43.4 |
14.6 |
19.5 |
97.6 |
Copenhagen - Malaga |
108.2 |
36.4 |
38.4 |
198.7 |
|
Distances [km] |
|||
|
Private car |
Bus |
Train |
MD82 |
Copenhagen - Aalborg |
415 |
415 |
469 |
239 |
Copenhagen - Paris |
1,233 |
1,233 |
1,528 |
1,005 |
Copenhagen - Malaga |
3,074 |
3,074 |
3,994 |
2,470 |
Other data sources are used to find the results for the two international trips. For
private cars and buses data are taken as background data from the COPERT III model
(Ntziachristos et al., 1999) using trip speeds of 110 and 90 km/h, respectively. The same
private car and bus types are used as for the domestic trip. A query on the present
study’s database has provided data for the trips flown with the MD82 aircraft type.
Information on international trains as regards locomotive types, electricity consumption per seat km and distance driven in each country are supplied by Danish Railways (Næraa, 2000). The electricity use data are listed per seat for each of the countries: Denmark, Germany, Belgium, France and Spain and are basically derived from own data (also implemented in TEMA2000) and the European MEET-project (1999).
For the distance driven in Denmark CO2 emission factors for electricity production are supplied by the Danish Energy Agency (Hansen, 2000). The international trip sections are simulated by combining data from the International Energy Agency (IEA, 1999c) and CO2 emission factors for the combustion of fossil fuels in power plants. IEA provides information on the quantity of electricity produced per fossil fuel type in Germany, Belgium, France and Spain and subsequently a fuel conversion efficiency of 40% is used to estimate the quantity of fossil fuel used specifically for electricity production.
The private car has high fuel consumption and correspondingly high CO2 emissions per seat compared to the figures for buses and trains. It is worthwhile to notice that if only two persons made the trips in a private car, the fuel consumption and CO2 emissions for the international trips would be higher than the figures for the aircraft. The latter vehicle type is without question the least fuel-efficient means of transportation at full occupancy for all transport modes. Buses and trains have about similar numbers for energy use and CO2 emissions. Trains are a little more energy efficient, but on the other hand have slightly higher CO2 emissions.
From the numbers it is possible to make other fuel use and CO2 scenarios by alternating the occupancy rates and varying the fuel use and CO2 numbers accordingly. Two persons in a private car and an occupancy rate of 70% for buses, trains and aircraft give only slightly lower energy use and CO2 emissions per person for international trips in a private car compared with the aircraft figures. With relatively low numbers buses and trains are still the most environmentally friendly modes of transport. Since the trip lengths for cars, buses and trains in particular are considerably longer than those flown by aircraft, the figures per person km turn out less environmentally friendly for the latter transportation type.
Table 4.21
Fuel use and CO2 emissions per person and person km for two persons in a
private car and an occupancy rate of 70% for buses, trains and aircraft
|
Energy [MJ/person] |
Energy [MJ/pkm] |
||||||
|
Private car |
Bus |
Train |
MD82 |
Private car |
Bus |
Train |
MD82 |
Copenhagen – Aalborg |
521.1 |
122.4 |
129.3 |
755.8 |
1.26 |
0.30 |
0.28 |
3.16 |
Copenhagen – Paris |
1479.6 |
283.8 |
232.6 |
1936.5 |
1.20 |
0.23 |
0.15 |
1.93 |
Copenhagen – Malaga |
3688.8 |
707.5 |
685.3 |
3942.7 |
1.20 |
0.23 |
0.17 |
1.60 |
|
CO2 [kg/person] |
CO2 [kg/pkm] |
||||||
|
Private car |
Bus |
Train |
MD82 |
Private car |
Bus |
Train |
MD82 |
Copenhagen – Aalborg |
38.2 |
9.0 |
9.6 |
54.4 |
92.1 |
21.6 |
20.4 |
227.8 |
Copenhagen – Paris |
108.5 |
20.9 |
27.9 |
139.4 |
88.0 |
16.9 |
18.2 |
138.7 |
Copenhagen – Malaga |
270.5 |
52.0 |
54.8 |
283.9 |
88.0 |
16.9 |
13.7 |
114.9 |
The impact on fuel use and emission performances if more modern DAC (Double Annular
Combustion) engine types such as CFM56-7B20/2 and CFM56-7B26/2 (fitted to the new SAS
B737-600 and -700 aircraft, - (N�s, 2000) are used in the entire SAS MD80 fleet was also
analysed. This exercise only focuses on comparisons for approved ICAO LTO test figures
since no cruise data are available for these two engine types.
Moreover it should be emphasised that ICAO LTO fuel flows and emissions for the different engines in some cases can be substantially different from observed values when the aircraft/engine combination is actually used in the airport vicinity. This is mainly due to differences in LTO times-in-modes, aircraft aerodynamic performance and the actual aircraft take off weight.
Three different engine types are used in the SAS MD80 fleet (Klee, 1999). These are JT8D-209, JT8D-217C and JT8D-219 with almost equal fuel flows and emission performances (see appendix 4) measured according to the approved ICAO test procedure. The engines are fitted to 1, 62 and 15 aircraft, respectively. From this distribution of engine types fuel flows, emission indices and total LTO figures are calculated for a generic engine.
Table 4.22
Generic engine for SAS MD80 aircraft fleet
|
Power setting |
Time |
Fuel flow |
Emission indices [g/kg] |
||
Mode |
[% Foo] |
[mins] |
[kg/s] |
VOC |
CO |
NOx |
|
|
|
|
|
|
|
Take off |
100 |
0.7 |
1.3270 |
0.28 |
0.79 |
25.91 |
Climb out |
85 |
2.2 |
1.0794 |
0.43 |
1.23 |
20.62 |
Approach |
30 |
4 |
0.3830 |
1.60 |
4.15 |
9.10 |
Idle |
7 |
26 |
0.1366 |
3.37 |
12.36 |
3.68 |
|
|
|
|
Total emissions [kg] |
||
|
|
|
Fuel |
VOC |
CO |
NOx |
Take off |
|
|
55.73 |
0.02 |
0.04 |
1.44 |
Climb out |
|
|
142.49 |
0.06 |
0.17 |
2.94 |
Approach |
|
|
91.91 |
0.15 |
0.38 |
0.84 |
Idle |
|
|
213.14 |
0.72 |
2.63 |
0.78 |
LTO total |
|
|
503.27 |
0.94 |
3.24 |
6.00 |
A shift to CFM56-7B20/2 would improve the fuel efficiency with almost 30% - thus reducing
the CO2 emissions - and give less than half of the NOx emission for
a full LTO cycle. Take off and climb out has the highest NOx emissions and for
these two modes the largest emission reductions are achieved. Since the NOx
emissions decrease for all four LTO modes, lower NOx emissions are expected
also during cruise and as a consequence the impact on global warming will be smaller.
Reversibly the use of the CFM56-7B20/2 engine type would lead to an increase in VOC and CO emissions of over 40 and 200%, respectively. The main concern of the two latter emission components is their impact on the local airport air quality. On the other hand it is the overall experience that the contribution from aircraft is negligible compared to the emissions from road vehicles driven on the airport ground and in neighbouring streets.
Table 4.23
Ratio between CFM56-7B20/2 and SAS MD80 generic engine
|
Power setting |
Time |
Fuel flow |
Emission indices |
||
Mode |
|
|
|
VOC |
CO |
NOx |
|
|
|
|
|
|
|
Take off |
1.00 |
1.00 |
0.68 |
0.25 |
5.40 |
0.51 |
Climb out |
1.00 |
1.00 |
0.70 |
0.54 |
9.28 |
0.52 |
Approach |
1.00 |
1.00 |
0.73 |
0.23 |
2.74 |
1.03 |
Idle |
1.00 |
1.00 |
0.75 |
2.41 |
4.02 |
1.02 |
|
|
|
|
Total emissions |
||
|
|
|
Fuel |
VOC |
CO |
NOx |
Take off |
|
|
0.68 |
0.17 |
3.67 |
0.35 |
Climb out |
|
|
0.70 |
0.37 |
6.48 |
0.37 |
Approach |
|
|
0.73 |
0.16 |
1.99 |
0.75 |
Idle |
|
|
0.75 |
1.80 |
3.00 |
0.76 |
LTO total |
|
|
0.72 |
1.42 |
3.08 |
0.47 |
Though the fuel efficiency is somewhat lower and the NOx emission performance
is not as good compared to the CFM56-7B26/2 engine type, in terms of global warming the
environment would still benefit from a shift to the CFM56-7B26/2 in the SAS MD80 fleet.
Almost the same increases in VOC and CO emissions are observed for the two new engine
types compared with the generic engine for the SAS MD80 fleet.
Table 4.24
Ratio between CFM56-7B26/2 and SAS MD80 generic engine
|
Power setting |
Time |
Fuel flow |
Emission indices |
||
Mode |
|
|
|
VOC |
CO |
NOx |
|
|
|
|
|
|
|
Take off |
1.00 |
1.00 |
0.91 |
0.11 |
0.98 |
0.74 |
Climb out |
1.00 |
1.00 |
0.92 |
0.14 |
2.05 |
0.72 |
Approach |
1.00 |
1.00 |
0.87 |
2.96 |
6.28 |
0.80 |
Idle |
1.00 |
1.00 |
0.83 |
1.75 |
3.23 |
1.16 |
|
|
|
|
Total emissions |
||
|
|
|
Fuel |
VOC |
CO |
NOx |
Take off |
|
|
0.91 |
0.10 |
0.88 |
0.67 |
Climb out |
|
|
0.92 |
0.13 |
1.88 |
0.66 |
Approach |
|
|
0.87 |
2.58 |
5.47 |
0.70 |
Idle |
|
|
0.83 |
1.44 |
2.67 |
0.96 |
LTO total |
|
|
0.87 |
1.51 |
2.93 |
0.71 |
5. Comparisons
Four comparisons are made to evaluate the results from chapter 4 with other findings.
First of all a comparison is made to the current CORINAIR methodology results. In this
exercise the database for flights is slightly modified in order to make comparable model
runs. Next the results from chapter 4 are compared with the findings from other aircraft
emission inventories. Then fuel use and emissions for single flights are evaluated with
results from the Danish TEMA2000-model. Finally the present study’s emission share
for IFR flights are related to the total Danish transport emission budget.
5.1 Current CORINAIR results
Two modifications of the database for flights presented in chapter 4 have been made in order to evaluate the new model with the current version. First of all flights from Denmark bound for Greenland and the Faroe islands are regarded as international, in order to suit the official fuel sale statistics. Next a distinction is made between flights from Copenhagen airport and all other Danish airports to support the current model’s available fuel use and emission data. The flight database is listed in appendix 5.
To obtain new model results fuel use and emissions were computed with (2) and (3) as described in chapter 4 – also in terms of representative aircraft types.
Table 5.1
Danish aviation fuel use and emissions with new CORINAIR methodology
|
|
|
Fuel |
NOx |
VOC |
CO |
No of flights |
|
|
|
[tonnes] |
[tonnes] |
[tonnes] |
[tonnes] |
|
Domestic |
Copen- |
LTO |
8,994 |
118 |
13 |
66 |
25,224 |
|
|
Cruise |
12,645 |
181 |
7 |
54 |
25,224 |
|
Other airports |
LTO |
11,349 |
163 |
11 |
61 |
38,071 |
|
|
Cruise |
17,635 |
249 |
10 |
77 |
38,071 |
|
|
Total |
50,623 |
710 |
41 |
259 |
63,295 |
Inter- |
Copen- |
LTO |
63,546 |
888 |
113 |
468 |
106,536 |
|
|
Cruise |
424,962 |
5,474 |
207 |
674 |
106,536 |
|
Other airports |
LTO |
7,082 |
97 |
9 |
54 |
21,038 |
|
|
Cruise |
52,682 |
591 |
26 |
142 |
21,038 |
|
|
Total |
548,272 |
7,050 |
354 |
1,338 |
127,574 |
|
|
Grand total |
598,895 |
7,761 |
395 |
1,597 |
190,869 |
Table 5.2
Danish aviation fuel use and emissions with current CORINAIR methodology
|
|
|
Fuel |
NOx |
VOC |
CO |
No of flights |
|
|
|
[tonnes] |
[tonnes] |
[tonnes] |
[tonnes] |
|
Domestic |
Copen- |
LTO |
7,484 |
72 |
6 |
72 |
25,224 |
|
|
Cruise |
3,780 |
36 |
1 |
6 |
25,224 |
|
Other airports |
LTO |
8,672 |
94 |
4 |
63 |
38,071 |
|
|
Cruise |
5,706 |
54 |
2 |
9 |
38,071 |
|
|
Total |
25,642 |
257 |
12 |
150 |
63,295 |
Inter- |
Copen- |
LTO |
59,147 |
767 |
101 |
496 |
106,536 |
|
|
Cruise |
550,290 |
7,594 |
825 |
385 |
106,536 |
|
Other airports |
LTO |
4,792 |
52 |
2 |
35 |
21,038 |
|
|
Cruise |
108,668 |
1,500 |
163 |
76 |
21,038 |
|
|
Total |
722,897 |
9,913 |
1,092 |
993 |
127,574 |
|
|
Grand total |
748,539 |
10,170 |
1,104 |
1,143 |
190,869 |
The allocation of LTOs to the current version’s representative aircraft types is also
viewed in appendix 5. The factors for fuel use and emissions are taken from table 3.4 and
the calculation method is explained in chapter 3.
5.1.1 Total differences
In grand totals the fuel use computed with the new methodology only amounts to 80% of the jet fuel sold in Danish airports for civil aviation purposes. Almost the same model difference occurs for NOx, while the new methodology calculates 40% more CO and inversely only 36% of the old VOC emissions estimate. Since international flights use almost 97% of all Danish jet fuel according to fuel sale statistics, variations in total fuel use and emission figures between the two methods are almost the same as the differences that appears for this sector.
A very bad fuel use agreement is obtained for domestic air traffic alone; the new fuel estimate is almost twice as high as fuel sale numbers. New emission estimates for national flights are 177, 72 and 236% more for NOx, CO and VOC, respectively.
The most likely reasons for fuel use deviations are discussed in paragraph 4.4.4.
Figure 5.1
Difference in percentage between new and current CORINAIR method
Table 5.3
Ratio between new and old CORINAIR fuel use and emissions estimates
|
|
|
Fuel |
NOx |
VOC |
CO |
|
|
|
[tonnes] |
[tonnes] |
[tonnes] |
[tonnes] |
Domestic |
Copen- |
LTO |
1.20 |
1.63 |
2.27 |
0.92 |
|
|
Cruise |
3.34 |
5.03 |
6.24 |
8.95 |
|
Other airports |
LTO |
1.31 |
1.72 |
2.93 |
0.97 |
|
|
Cruise |
3.09 |
4.60 |
5.95 |
8.45 |
|
|
Total |
1.97 |
2.77 |
3.36 |
1.72 |
Inter- |
Copen- |
LTO |
1.07 |
1.16 |
1.11 |
0.94 |
|
|
Cruise |
0.77 |
0.72 |
0.25 |
1.75 |
|
Other airports |
LTO |
1.48 |
1.86 |
4.10 |
1.55 |
|
|
Cruise |
0.48 |
0.39 |
0.16 |
1.87 |
|
|
Total |
0.76 |
0.71 |
0.32 |
1.35 |
|
|
Grand total |
0.80 |
0.76 |
0.36 |
1.40 |
5.1.2 Differences for LTO
Looking into the differences in LTO fuel use and emission estimates the most similar results are obtained for international LTOs in Copenhagen airport. This is also the part of the current model where precise details are given in terms of different aircraft types and LTO times-in-modes. For LTO the weakest part of the current methodology regards all domestic air traffic and international air traffic in the provincial airports. In these inventory categories the estimates are based on fuel use and emission information for only one aircraft (Fokker 50) and this data scarcity is reflected in the result deviations.
Appendix 4 displays the number of domestic and international flights from Copenhagen airport and other Danish airports. Apparently F50 is a little to small to be the fully representative choice of aircraft, since much flying is made with the larger jets MD80 and B737 thus influencing the total fuel consumption. In particular the fuel use is underestimated by the current model for international LTOs in provincial airports. Here the new methodology with a detailed fleet mix computes almost 50% more fuel.
Most comparable emission results for the three LTO classes appear for domestic LTO CO emissions, where the two model estimates are of similar size. The NOx emissions are over 60% up to almost twice as high for the new methodology in the three sectors. For VOC the differences are even bigger; the new estimates are from twice to over four times the emission amount computed with the current methodology.
5.1.3 Differences for cruise
For cruise the fuel use is found in the current methodology as the difference between national fuel sale numbers and calculated fuel use for LTO. The subdivision in cruise fuel use for flights from Copenhagen Airport and provincial airports is made according to the total number of flights irrespective of aircraft type. For domestic flights the aircraft size distributions in Copenhagen Airport and other airports are in the same range, while the larger aircraft in general make international flights from Copenhagen Airport. The latter airport therefore tends to get a too small cruise fuel use amount. This is displayed in table 5.3. The ratios between old and new international cruise fuel use totals should be more or less the same for Copenhagen Airport and the other Danish airports but are remarkably different; the ratios are 0.77 and 0.48, respectively.
5.1.4 Recommendations
Much time is needed to build an aircraft emission inventory following the new CORINAIR guidelines as explained in chapter 4. Even though it would be less time consuming to make an inventory update each year, the working time required will exceed the amount of time typically available for inventories.
Therefore it is recommended to maintain the current methodology for national emission reporting. Instead of a shift to the new model version, one should make an update of the current model’s background data for fuel use and emissions.
Real improvement of the current version for LTOs - except for international LTOs in Copenhagen Airport – could be achieved by applying new LTO fuel use and emission factors derived from the new methodology as aggregated figures. For cruise it is recommended to break down the fuel use used by flights from Copenhagen Airport and other Danish airports according to their LTO fuel use estimates. This should be done separately for domestic and international traffic. Also the cruise emission indices should be updated. Both for domestic and international flights these can be derived from the new methodology results. The new CORINAIR LTO and cruise data can also be used to make time series estimates of fuel use and emissions since new aircraft/engine combinations only have a slow speed of penetration in the aviation sector. All data in current CORINAIR format derived from the new CORINAIR method are given in table 5.4.
To estimate the fuel use and emissions for international LTOs in Copenhagen Airport the current model version should still be used. The differences between the new and current results are small and the airport can provide flight data to support the needs of the current model. The flight data describe the fleet mix each year and are easy to implement in the model. With flight data from other airports provided by official Danish statistics and by making some model assumptions – as described in chapter 3 - it is straightforward to make a complete and consistent Danish inventory.
This study’s findings clarify the need to further scrutinise for which purposes the aviation fuel is used in Danish Airports. A way to do this is to examine the most detailed data on aviation fuel delivered to the airports. Also the airport authorities on aviation fuel supply should be asked and their information should be verified by analysing other data available. Even though the fuel sale statistics have been improved after the finalisation of the present project the present study’s result could be valuable in a crosscheck examination of statistical data versus model estimates.
A double check on the fuel use from the CORINAIR databank with experiences from real world operation of aircraft during landing, taxiing, take off, climb out and cruise flying conditions would also add to more precise fuel balances in future aircraft emission inventories. To make these comparisons information must be obtained from the airline companies on fuel use figures for the aircraft most frequently operating from Danish airports.
Table 5.4
Fuel use and emission factors in current CORINAIR format derived from the new CORINAIR
method
|
|
|
Fuel |
NOx |
VOC |
CO |
CO2 |
|
|
|
[kg/ |
[kg/ |
[kg/ |
[kg/ |
[kg/ |
Domestic |
Copen- |
LTO |
357 |
4.66 |
0.50 |
2.63 |
1,117 |
|
Other airports |
LTO |
298 |
4.27 |
0.29 |
1.60 |
934 |
Inter- |
Copen- |
LTO |
596 |
8.33 |
1.06 |
4.40 |
1,868 |
|
Other airports |
LTO |
337 |
4.61 |
0.41 |
2.57 |
1,054 |
|
|
|
Fuel |
NOx |
VOC |
CO |
CO2 |
|
|
|
|
[g/kg fuel] |
[g/kg fuel] |
[g/kg fuel] |
[kg/kg fuel] |
Domestic |
Copen- |
Cruise |
|
14.29 |
0.56 |
4.28 |
3,132 |
|
Other airports |
Cruise |
|
14.14 |
0.58 |
4.37 |
3,132 |
Inter- |
Copen- |
Cruise |
|
12.88 |
0.49 |
1.59 |
3,132 |
|
Other airports |
Cruise |
|
11.23 |
0.50 |
2.69 |
3,132 |
5.2 International aircraft emission inventories
On a global level three important aircraft emission inventories have been made for the year 1992. All inventories make use of air traffic movement data, aircraft/engine combinations in operation and calculate fuel use and emissions for city-pairs using correspondent great circle distances. Short descriptions of the emission inventories are given in IPCC (1999).
NASA (Baughcum et al., 1996) makes separate inventories for scheduled jet and turbo-prop flights, charter flights, domestic air traffic movements in the Former Soviet Union and China, general aviation (piston-engined aircraft) and military flights. ANCAT/EC2 (1998) only includes jet aircraft in the inventory divided into civil and military flights. DLR (Schumann et al., 1997) use the ANCAT/EC2 database for civil aircraft movements.
Table 5.5
Emission indices from NASA, ANCAT/EC2, DLR and present study
|
NASA1 |
ANCAT/EC2 |
DLR |
Present study |
EI NOx |
13.0 |
14.0 |
14.2 |
13.0 |
EI CO |
5.1 |
|
3.72 |
2.7 |
EI VOC |
2.0 |
|
1.33 |
0.7 |
1
Scheduled and charter flightsThe present study’s emission indices are derived from the totals in table 4.20. The EINOx found in the present study are slightly smaller than the number from ANCAT/EC2. This is mostly due to the inclusion of turbo-props and differences in fleet mix for jet aircraft, since emission data for jets mainly come from the ANCAT/EC2 inventory. The aircraft in the Danish CORINAIR inventory tend to be relatively small and flights are mainly short and medium distances. The NASA findings underpin the above explanation. NASA also includes turbo-propelled aircraft and computes almost the same EINOx as the present study. For VOC and CO the differences in emission indices lie mainly in the simulation methods behind NASA, DLR, MEET and FFA. The two latter methods have provided CORINAIR with emission data for CO and VOC.
5.3 TEMA2000 model results
Individual model results widely depend on the modelling principles and the selected engine types, which determine the fuel flows and emission indices to be used in the simulation procedure. A comparison of results obtained with different models will inevitably reflect these individual choices. In CORINAIR the fuel use and emission factors are produced by weighting fuel use and emission performances for the most frequently used engines worldwide. The Danish TEMA2000 model1(Trafikministeriet, 2000) uses fuel use and emissions for domestic flights simulated with the ATEMIS model (Kalivoda and Feller, 1995). The latter model uses real world flight profiles and one aircraft/engine combination for each aircraft type. TEMA2000 results for all domestic flights are listed in appendix 6.
The flight distances in TEMA2000 and the present study’s great circle distances are almost the same. For fuel use the largest variations in results are observed for F50; the present study computes about 20% more fuel. In TEMA2000 the F50 simulations are not based on the actual engine fitted to the aircraft. Instead emission indices (EI) from another engine type is used together with fuel flow rates for F50. In CORINAIR the actual engine type (PW125B) is used with no VOC emissions reported. Except for F50 – with a smaller EINOx in TEMA2000 – the modelled EINOx have about equal numbers for all aircraft on both routes.
Table 5.6
Ratio between CORINAIR and TEMA2000 fuel use and EI results
Aircraft type |
Desti- |
Dist- |
Fuel |
EINOx |
EIVOC |
EICO |
MD 82 |
Århus |
95 |
103 |
107 |
78 |
75 |
F50 |
Århus |
95 |
121 |
132 |
0 |
82 |
DC9 |
Århus |
95 |
92 |
107 |
21 |
29 |
B737 400/ |
Århus |
95 |
115 |
110 |
65 |
73 |
B737 400/ |
Århus |
95 |
99 |
104 |
39 |
83 |
MD 82 |
Aalborg |
99 |
106 |
112 |
78 |
75 |
F50 |
Aalborg |
99 |
122 |
144 |
0 |
91 |
DC9 |
Aalborg |
99 |
94 |
110 |
24 |
32 |
B737 400/ |
Aalborg |
99 |
113 |
116 |
70 |
77 |
B737 400/ |
Aalborg |
99 |
102 |
111 |
39 |
82 |
For CO and VOC the present study’s EI’s are lower and most remarkable are the
deviations for DC9. The EI’s are only one third and one fourth of the TEMA2000
figures for CO and VOC, respectively. For DC9 several engines are used in combination in
CORINAIR. One of the engines with a minor share of 8% is behind the DC9 in TEMA2000.
Though a little lower the present study’s CO and VOC EI for B737-400 are comparable to the numbers for B737-500 and MD82 in TEMA2000. In CORINAIR the generic engine is mainly weighting of three engines of which the engines in TEMA2000 have a 45 and 40% share for B737-500 and MD82, respectively. The present study’s EIVOC for B737-400 is substantially lower than the B737-600 index in TEMA2000. The engine in the latter aircraft is not among the engines used by CORINAIR.
It is recommended to use the TEMA2000 numbers if fuel use and emissions are evaluated for those domestic trips flown with the aircraft comprised in TEMA2000. For domestic emission inventories the CORINAIR data should be used primarily because of data consistency and because CORINAIR contains data for small jets and turbo-props not present in TEMA2000. The latter reason fully compensates for the inaccuracy of the results for some aircraft due to model boundary conditions.
5.4 Other transport modes
The present aircraft emission inventory includes both domestic and international flights but do not encompass all aviation sectors. Piston engined flights and military aircraft movements are omitted due to lack of emission data. Moreover, the civil jet fuel use is underestimated by 20% compared with fuel sales. Bearing this in mind the emission results are compared with the Danish CORINAIR 1998 emissions from the remaining traffic sectors; road traffic, railway transport and internal navigation (Illerup et al., 2000). The latter sector includes the fuel used and the emissions from vessel movements between domestic ports and all fishing activities. Fuel use and emissions from international sea transportation are not included in the present exercise.
Road traffic is the most dominant traffic emission source with contributions of 77 and 72% of the total national CO2 and NOx traffic emissions totals. With 13% air traffic has the second largest CO2 share of the total traffic emissions load. The share would be even bigger - around 17% - if all aviation fuel use was accounted for.
In terms of NOx internal navigation has a rather high share of the total traffic emissions. This sector contributes with 19% of the total traffic emissions, while air traffic has a share of around 7%. For aviation this share would be around 10% if the present results comprised all fuel use and emissions. The CO and VOC emissions are totally dominated by the road traffic emissions, with shares of 96 and 89% of traffic emission totals, respectively.
Figure 5.2
NOX emissions from Danish transport
Figure 5.3
CO2 emissions from Danish transport
Table 5.7
1998 Emissions from aviation (present study) and other modes (CORINAIR)
NOx |
VOC |
CO |
CO2 |
||
[tonnes] |
[tonnes] |
[tonnes] |
[ktonnes] |
||
| Road traffic | 76,699 |
54,892 |
298,875 |
11,221 |
|
| Railways | 2,307 |
161 |
348 |
247 |
|
| Internal navigation | 20,105 |
6,233 |
11,745 |
1,151 |
|
| Air traffic | 7,761 |
395 |
1,597 |
1,876 |
|
| Sum | 106,872 |
61,680 |
312,564 |
14,495 |
|
NOx |
VOC |
CO |
CO2 |
||
| Share | Road traffic | 72 |
89 |
96 |
77 |
| Railways | 2 |
0 |
0 |
2 |
|
| Internal navigation | 19 |
10 |
4 |
8 |
|
| Air traffic | 7 |
1 |
1 |
13 |
|
| Sum | 100 |
100 |
100 |
100 |
TEMA2000 is developed for the Danish Ministry of Transport by COWI Consulting Engineers and Planners
6. Conclusions
This study has shown the feasibility of the new CORINAIR methodology for making city-pair aircraft emission inventories. Consistent data for individual flights and general classifications of aircraft types and airports exist together with fuel use and emission data for representative aircraft types. In this way EUROCONTROL provides information for individual IFR flights which correspond to essential data from ICAO on aircraft designators and airport codes. All data can be combined to build up the inventory system. In order to make the final grouping of aircraft into representative aircraft additional aircraft descriptions can be obtained from aircraft directories.
The new CORINAIR data bank consists of fuel use and emissions for several representative aircraft types. The data available was sufficient to underpin the fuel use and emission calculations in the inventory - both for LTO and for cruise at different flying distances. The established data bank is mainly a result of international co-operation. Not only in working groups set up in the CORINAIR framework but also in remote research networks and other working groups dealing with aircraft emissions. Here experts have participated, i.e. emission modellers, inventory makers and local airport traffic managers, together with EU experts.
Much time is needed to build an aircraft emission inventory following the new CORINAIR guidelines. Even though it would be less time consuming to make an inventory update each year, the working time required will exceed the time typically available for inventories. Therefore it is recommended to maintain the current methodology for national emission reporting. Instead of a shift to the new model version, one should make an update of the current model’s background data for fuel use and emissions.
Real improvement of the current version for LTOs - except for international LTOs in Copenhagen Airport – could be achieved by applying new LTO fuel use and emission factors derived from the new methodology as aggregated figures. For cruise it is recommended to break down the fuel use between Copenhagen Airport and other Danish airports according to their LTO fuel use estimates. Also the cruise emission indices should be updated. Both for domestic and international flights these can be derived from the new methodology results. The new CORINAIR LTO and cruise data can also be used to make time series estimates of fuel use and emissions since new aircraft/engine combinations only have a slow speed of penetration in the aviation sector.
It is recommended to use the TEMA2000 numbers if fuel use and emissions are evaluated for those domestic trips flown with the aircraft comprised in TEMA2000. For domestic emission inventories the CORINAIR data should be used primarily because of data consistency and because CORINAIR contains data for small jets and turbo-props not present in TEMA2000. The latter reason fully compensates for the inaccuracy in results for some aircraft due to model boundary conditions.
This study’s findings clarify the need to further scrutinise for which purposes the aviation fuel is used in Danish Airports. A way to do this is to examine the most detailed data on aviation fuel delivered to the airports. Also the airport authorities on aviation fuel supply should be asked and their information should be verified by analysing other data available. Even though the fuel sale statistics have been improved after the finalisation of the present project the present study’s result could be valuable in a crosscheck examination of statistical data versus model estimates.
A double check on the fuel use from the CORINAIR databank with experiences from real world operation of aircraft during landing, taxiing, take off, climb out and cruise flying conditions would also add to more precise fuel balances in future aircraft emission inventories. To make these comparisons information must be obtained from the airline companies on fuel use figures for the aircraft most frequently operating from Danish airports.
7. References
ANCAT/EC2 (1998): Global Aircraft Emissions Inventories for 1991/92 and 2015. Report by the ECAC/ANCAT and EC working group. EUR No: 18179, ISBN No: 92-828-2914-6.
Baughcum S. L., Tritz T. G., Henderson S. C., Pickett D. C. (1996): Scheduled Civil Aircraft Emissions Inventories for 1992: Data base Development and Analysis. NASA Contractor report 4700, NASA Langley Research Centre, U.S.
Copenhagen Airport (1996): VVM Fagprojekt - Luftforurening, Copenhagen Airport, Copenhagen (in Danish).
Copenhagen Airport (1999): Traffic Statistics 1999, Copenhagen Airport, Copenhagen (unpublished data material).
CORINAIR (1996): Atmospheric Emission Inventory Guidebook Vol. 2, First Edition, EMEP Task Force on Emission Inventories, European Environmental Agency, Copenhagen.
CORINAIR (1999): Atmospheric Emission Inventory Guidebook Vol. 3, Second Edition, EMEP Task Force on Emission Inventories, European Environmental Agency, Copenhagen.
DEA (1998): Energy Statistics 97, Danish Energy Agency, Copenhagen.
DEA (1999): Energy Statistics 98, Danish Energy Agency, Copenhagen.
FFA (2000): FFA Methods for Computing Exhaust Emissions from Aircraft: Description and Validation, Doc. no. FFA TN 2000-14, FFA, Bromma, Sweden.
Frawley (1999): The International Directory of Civil Aircraft 1999/2000, Airlife Publishing Ltd, Shrewsbury, England, ISBN NO: 1-84037-118-8.
Hansen, A. (2000): Pers. comm., the Danish Energy Agency.
Houghton, J. T., Meira Filho, L. G., Lim, B., Tréanton, K., Mamaty, I., Bonduki, Y. Griggs, D. J. and Callander, B. A. (Eds) (1997). Greenhouse Gas Inventory Reporting Instructions. Revised 1996 IPCC Guidelines for National Greenhouse Gas Inventories. Volume 1.
Houghton, J. T., Meira Filho, L. G., Lim, B., Tréanton, K., Mamaty, I., Bonduki, Y. Griggs, D. J. and Callander, B. A. (Eds) (1997). Greenhouse Gas Inventory Workbook. Revised 1996 IPCC Guidelines for National Greenhouse Gas Inventories. Volume 2.
Houghton, J. T., Meira Filho, L. G., Lim, B., Tréanton, K., Mamaty, I., Bonduki, Y. Griggs, D. J. and Callander, B. A. (Eds) (1997). Greenhouse Gas Inventory Reference Manual. Revised 1996 IPCC Guidelines for National Greenhouse Gas Inventories. Volume 3.
ICAO (1993): International Standards And Recommended Practises, Environmental Protection Annex 16, Volume II Aircraft Engine Emissions (second edition), ICAO, Montreal.
ICAO (1995): ICAO Engine Exhaust Emissions Data Bank, Doc 9646-AN/943, First Edition - 1995, ICAO, Montreal.
ICAO (1998): Aircraft Type Designators, Doc 8643/26, 26th Edition, ICAO, Montreal.
ICAO (1999): Location Indicators, Doc 7910/93, 93th Edition, ICAO, Montreal.
IEA (1999a): Energy Statistics of Non-OECD Countries 1996-1997, 1999 Edition, International Energy Agency.
IEA (1999b):, Energy Statistics of Non-OECD Countries 1996-1997, 1999 Edition, International Energy Agency.
IEA (1999c): International Energy Agency, Electricity Information 1998, 1999 Edition.
Illerup, J. B., Lyck, E., Winther, M. & Rasmussen, E. (2000): Denmark’s National Inventory Report – Submitted under the United Nations Framework Convention on Climate Change. Samfund og Miljø – Emissions Inventories. Research Notes from NERI no. 127.
IPCC (1999): Aviation and the Global Atmosphere, Cambridge University Press, Cambridge, ISBN No: 0-521-66404-7.
Kalivoda, M. T., Feller, R. (1995): ATEMIS - A tool for calculating air traffic exhaust emissions and its application, The Science of the Total Environment 169 (1995) 241-247.
Klee, U. (ed. 1999): jp airline - fleets international 1999/2000, 33rd edition, B�cher & Co. Publikationen, Zurich-Airport, Switzerland, ISBN NO: 3-85758-133-6.
MEET (1999): MEET - Methodology for calculating transport emissions and energy consumption, Transport Research fourth framework programme - strategic research, DG VII - 99, European Communities, 1999, ISBN NO: 92-828-6785-4.
Ntziachristos, L., Samaras, Z., Eggleston, S., Gorib en, N., Hassel, D., Hickman, A. -J., Joumard, R., Rijkeboer, R., & Zierock, K. -H. (1999): COPERT III Computer Programme to Calculate Emissions from Road Transport - Methodology and Emission Factors. Final Draft Report. European Environment Agency, July 1999, Copenhagen.
Næraa, R. (2000): Unpublished data material, Danish Railways.
N�s, B. O. (2000): Pers. comm., SAS Aircraft & Engine Analysis.
Schumann, U., Chlond, A.., Ebel, A., K�rcher, B., Pak, H., Schlager, H., Schmitt, A., Wendling, P. (Eds) (1997): Pollutants from Air Traffic – Results of Atmospheric Research 1992 – 1997, DLR Mitteilung 97-04, K�ln.
Statistics Denmark (1999): Statistical Yearbook 1999, Statistics Denmark, Copenhagen (in Danish).
Trafikministeriet (2000): TEMA2000. Technical report, Copenhagen (in Danish).
Winther, M., Illerup, J., Fenhann, J., Kilde, N.A., (1999a): The Danish CORINAIR Inventories - Timeseries 1975-1996 of Emissions to the Atmosphere. 83 pp. - NERI Technical Report no. 287.
Winther, M. (1999b): An Air Traffic Emission Inventory for Denmark in 1997 using the Detailed CORINAIR Calculation Methodology - And Suggestions for Improvements. In: Sturm, P. J. (ed): 8th International Symposium Transport and Air Pollution including COST 319 - Final Conference. Report of the Institute for Internal Combustion Engines and Thermodynamics. Volume 76.
Appendix 1
New CORINAIR fuel use and emission data for representative aircraft
Appendix 2
Representative aircraft types for turboprops and jets
Turboprops
ICAO-code |
Category |
No. of LTOs |
MTOW |
Rep. type |
C208 |
L1T |
356 |
3.3 |
Shorts360 300 |
TBM7 |
L1T |
19 |
3 |
Shorts360 300 |
PC12 |
L1T |
10 |
4.5 |
Shorts360 300 |
PC6T |
L1T |
8 |
2.2 |
Shorts360 300 |
PC7 |
L1T |
3 |
3 |
Shorts360 300 |
DH2T |
L1T |
2 |
2.4 |
Shorts360 300 |
TUCA |
L1T |
1 |
3 |
Shorts360 300 |
F50 |
L2T |
30324 |
20.8 |
F50 |
ATR |
L2T |
14392 |
18.6 |
F50 |
SHD3 |
L2T |
6219 |
12.3 |
Shorts360 300 |
JSTA |
L2T |
2559 |
7 |
Shorts360 300 |
E110 |
L2T |
1880 |
5.7 |
Shorts360 300 |
BE20 |
L2T |
1819 |
5.7 |
Shorts360 300 |
SW3 |
L2T |
1199 |
5 |
Shorts360 300 |
F27 |
L2T |
1181 |
20.4 |
F50 |
DHC8 |
L2T |
1071 |
27.3 |
Dash8 400 |
JSTB |
L2T |
908 |
10.4 |
Shorts360 300 |
ATP |
L2T |
884 |
22.9 |
Saab2000 |
SC7 |
L2T |
708 |
5.7 |
Shorts360 300 |
SB20 |
L2T |
699 |
22.8 |
Saab2000 |
SF34 |
L2T |
561 |
12.4 |
Shorts360 300 |
JS31 |
L2T |
492 |
7 |
Shorts360 300 |
B190 |
L2T |
480 |
7.5 |
Shorts360 300 |
F406 |
L2T |
442 |
3.3 |
Shorts360 300 |
AN26 |
L2T |
375 |
21 |
F50 |
CVLT |
L2T |
330 |
25.9 |
F50 |
B350 |
L2T |
277 |
6.8 |
Shorts360 300 |
E120 |
L2T |
235 |
11.5 |
Shorts360 300 |
BE9L |
L2T |
205 |
4.2 |
Shorts360 300 |
PA42 |
L2T |
205 |
5.1 |
Shorts360 300 |
JS41 |
L2T |
170 |
10.9 |
Shorts360 300 |
N262 |
L2T |
154 |
10.7 |
Shorts360 300 |
P31T |
L2T |
99 |
4.1 |
Shorts360 300 |
A748 |
L2T |
93 |
12.1 |
Shorts360 300 |
L410 |
L2T |
90 |
6.6 |
Shorts360 300 |
BE9T |
L2T |
76 |
4.2 |
Shorts360 300 |
D228 |
L2T |
74 |
5.7 |
Shorts360 300 |
AC6T |
L2T |
60 |
5 |
Shorts360 300 |
MU2 |
L2T |
51 |
4.1 |
Shorts360 300 |
BE30 |
L2T |
44 |
5.7 |
Shorts360 300 |
PAY3 |
L2T |
35 |
5.1 |
Shorts360 300 |
C212 |
L2T |
30 |
6.3 |
Shorts360 300 |
C425 |
L2T |
28 |
3.7 |
Shorts360 300 |
AN24 |
L2T |
15 |
21 |
F50 |
BE10 |
L2T |
15 |
5.4 |
Shorts360 300 |
G222 |
L2T |
10 |
20 |
F50 |
F60 |
L2T |
9 |
20 |
F50 |
C441 |
L2T |
8 |
3.7 |
Shorts360 300 |
C160 |
L2T |
7 |
20 |
F50 |
DHC6 |
L2T |
7 |
4.8 |
Shorts360 300 |
D328 |
L2T |
6 |
14 |
Shorts360 300 |
AN28 |
L2T |
3 |
6.5 |
Shorts360 300 |
E121 |
L2T |
3 |
5 |
Shorts360 300 |
G159 |
L2T |
3 |
20 |
F50 |
P180 |
L2T |
3 |
5 |
Shorts360 300 |
P68T |
L2T |
3 |
5 |
Shorts360 300 |
ATLA |
L2T |
2 |
20 |
F50 |
CN35 |
L2T |
2 |
20 |
F50 |
SW2 |
L2T |
2 |
5 |
Shorts360 300 |
STAR |
L2T |
1 |
5 |
Shorts360 300 |
C130 |
L4T |
267 |
70.3 |
Dash8 400 |
L188 |
L4T |
101 |
52.7 |
Dash8 400 |
P3 |
L4T |
14 |
63 |
Dash8 400 |
AN12 |
L4T |
9 |
61 |
Dash8 400 |
IL18 |
L4T |
2 |
64 |
Dash8 400 |
Jets
ICAO-code |
Category |
No. of LTOs |
MTOW |
Rep. type |
A7 |
L1J |
2 |
10 |
RJ 100 |
L39 |
L1J |
1 |
5 |
RJ 100 |
MD80 |
L2J |
44291 |
64 |
MD82-88 |
B73B |
L2J |
24390 |
63 |
B737-400 |
DC9 |
L2J |
11577 |
55 |
DC9 |
MD90 |
L2J |
5180 |
63 |
B737-400 |
A320 |
L2J |
4875 |
73.5 |
A320 |
B767 |
L2J |
3956 |
182 |
B767-300ER |
B73A |
L2J |
2265 |
52 |
B737-100 |
B73C |
L2J |
2177 |
63 |
B737-400 |
A300 |
L2J |
1781 |
142 |
A310 |
C500 |
L2J |
1599 |
5.2 |
RJ 100 |
B757 |
L2J |
1243 |
116 |
B757 |
F28 |
L2J |
1224 |
33 |
F28 |
F70 |
L2J |
1058 |
38 |
F28 |
E145 |
L2J |
615 |
21 |
RJ 100 |
F100 |
L2J |
583 |
43 |
F100 |
C650 |
L2J |
517 |
10.2 |
RJ 100 |
CARJ |
L2J |
430 |
24 |
RJ 100 |
S601 |
L2J |
388 |
6.6 |
RJ 100 |
CL60 |
L2J |
286 |
18 |
RJ 100 |
A310 |
L2J |
281 |
142 |
A310 |
C560 |
L2J |
268 |
9.1 |
RJ 100 |
LJ35 |
L2J |
260 |
8.3 |
RJ 100 |
FA20 |
L2J |
240 |
13 |
RJ 100 |
T134 |
L2J |
211 |
45 |
F100 |
H25B |
L2J |
202 |
10.6 |
RJ 100 |
BA11 |
L2J |
161 |
40 |
BAC1-11 |
GULF |
L2J |
147 |
31.6 |
F28 |
FA10 |
L2J |
88 |
8.5 |
RJ 100 |
LJ55 |
L2J |
75 |
9.5 |
RJ 100 |
TOR |
L2J |
67 |
10 |
RJ 100 |
AJET |
L2J |
34 |
10 |
RJ 100 |
LJ31 |
L2J |
29 |
7.7 |
RJ 100 |
H25A |
L2J |
25 |
10.6 |
RJ 100 |
SB05 |
L2J |
20 |
5 |
RJ 100 |
C525 |
L2J |
18 |
4.7 |
RJ 100 |
ASTR |
L2J |
13 |
10.7 |
RJ 100 |
LJ60 |
L2J |
9 |
10.7 |
RJ 100 |
JAGR |
L2J |
7 |
10 |
RJ 100 |
CNBR |
L2J |
6 |
10 |
RJ 100 |
VF14 |
L2J |
5 |
10 |
RJ 100 |
C750 |
L2J |
4 |
16.2 |
RJ 100 |
LJ24 |
L2J |
4 |
6.1 |
RJ 100 |
B777 |
L2J |
3 |
247 |
B777 |
A10 |
L2J |
2 |
10 |
RJ 100 |
LJ25 |
L2J |
2 |
5 |
RJ 100 |
P808 |
L2J |
2 |
10 |
RJ 100 |
AN72 |
L2J |
1 |
10 |
RJ 100 |
BE40 |
L2J |
1 |
10 |
RJ 100 |
H25C |
L2J |
1 |
10 |
RJ 100 |
LJ45 |
L2J |
1 |
10 |
RJ 100 |
WW24 |
L2J |
1 |
10 |
RJ 100 |
B727 |
L3J |
3315 |
95 |
B727 |
DC10 |
L3J |
777 |
259 |
DC10 |
YK40 |
L3J |
411 |
16 |
RJ 100 |
T154 |
L3J |
365 |
90 |
B727 |
MD11 |
L3J |
274 |
273 |
DC10 |
L101 |
L3J |
192 |
211 |
A330 |
FA50 |
L3J |
150 |
17.6 |
RJ 100 |
F900 |
L3J |
94 |
20.6 |
RJ 100 |
YK42 |
L3J |
28 |
57 |
DC9 |
BA46 |
L4J |
4402 |
42 |
BAe146 |
B74A |
L4J |
270 |
362 |
B747-400 |
A340 |
L4J |
158 |
275 |
A340 |
B74B |
L4J |
156 |
362 |
B747-400 |
DC8 |
L4J |
129 |
152 |
A310 |
B74S |
L4J |
71 |
362 |
B747-400 |
IL62 |
L4J |
35 |
162 |
A340 |
B707 |
L4J |
28 |
117 |
B757 |
IL76 |
L4J |
21 |
190 |
A340 |
C5 |
L4J |
7 |
275 |
A340 |
C141 |
L4J |
6 |
275 |
A340 |
IL86 |
L4J |
5 |
275 |
A340 |
A124 |
L4J |
3 |
275 |
A340 |
E3 |
L4J |
3 |
362 |
B747-400 |
C17 |
L4J |
1 |
275 |
A340 |
L29B |
L4J |
1 |
42 |
BAe146 |
VC10 |
L4J |
1 |
275 |
A340 |
Appendix 3
Representative aircraft types for turboprops and jets
Turboprops
ICAO-code |
Category |
No. of LTOs |
MTOW |
Rep. type |
C208 |
L1T |
356 |
3.3 |
Shorts360 300 |
TBM7 |
L1T |
19 |
3 |
Shorts360 300 |
PC12 |
L1T |
10 |
4.5 |
Shorts360 300 |
PC6T |
L1T |
8 |
2.2 |
Shorts360 300 |
PC7 |
L1T |
3 |
3 |
Shorts360 300 |
DH2T |
L1T |
2 |
2.4 |
Shorts360 300 |
TUCA |
L1T |
1 |
3 |
Shorts360 300 |
F50 |
L2T |
30324 |
20.8 |
F50 |
ATR |
L2T |
14392 |
18.6 |
F50 |
SHD3 |
L2T |
6219 |
12.3 |
Shorts360 300 |
JSTA |
L2T |
2559 |
7 |
Shorts360 300 |
E110 |
L2T |
1880 |
5.7 |
Shorts360 300 |
BE20 |
L2T |
1819 |
5.7 |
Shorts360 300 |
SW3 |
L2T |
1199 |
5 |
Shorts360 300 |
F27 |
L2T |
1181 |
20.4 |
F50 |
DHC8 |
L2T |
1071 |
27.3 |
Dash8 400 |
JSTB |
L2T |
908 |
10.4 |
Shorts360 300 |
ATP |
L2T |
884 |
22.9 |
Saab2000 |
SC7 |
L2T |
708 |
5.7 |
Shorts360 300 |
SB20 |
L2T |
699 |
22.8 |
Saab2000 |
SF34 |
L2T |
561 |
12.4 |
Shorts360 300 |
JS31 |
L2T |
492 |
7 |
Shorts360 300 |
B190 |
L2T |
480 |
7.5 |
Shorts360 300 |
F406 |
L2T |
442 |
3.3 |
Shorts360 300 |
AN26 |
L2T |
375 |
21 |
F50 |
CVLT |
L2T |
330 |
25.9 |
F50 |
B350 |
L2T |
277 |
6.8 |
Shorts360 300 |
E120 |
L2T |
235 |
11.5 |
Shorts360 300 |
BE9L |
L2T |
205 |
4.2 |
Shorts360 300 |
PA42 |
L2T |
205 |
5.1 |
Shorts360 300 |
JS41 |
L2T |
170 |
10.9 |
Shorts360 300 |
N262 |
L2T |
154 |
10.7 |
Shorts360 300 |
P31T |
L2T |
99 |
4.1 |
Shorts360 300 |
A748 |
L2T |
93 |
12.1 |
Shorts360 300 |
L410 |
L2T |
90 |
6.6 |
Shorts360 300 |
BE9T |
L2T |
76 |
4.2 |
Shorts360 300 |
D228 |
L2T |
74 |
5.7 |
Shorts360 300 |
AC6T |
L2T |
60 |
5 |
Shorts360 300 |
MU2 |
L2T |
51 |
4.1 |
Shorts360 300 |
BE30 |
L2T |
44 |
5.7 |
Shorts360 300 |
PAY3 |
L2T |
35 |
5.1 |
Shorts360 300 |
C212 |
L2T |
30 |
6.3 |
Shorts360 300 |
C425 |
L2T |
28 |
3.7 |
Shorts360 300 |
AN24 |
L2T |
15 |
21 |
F50 |
BE10 |
L2T |
15 |
5.4 |
Shorts360 300 |
G222 |
L2T |
10 |
20 |
F50 |
F60 |
L2T |
9 |
20 |
F50 |
C441 |
L2T |
8 |
3.7 |
Shorts360 300 |
C160 |
L2T |
7 |
20 |
F50 |
DHC6 |
L2T |
7 |
4.8 |
Shorts360 300 |
D328 |
L2T |
6 |
14 |
Shorts360 300 |
AN28 |
L2T |
3 |
6.5 |
Shorts360 300 |
E121 |
L2T |
3 |
5 |
Shorts360 300 |
G159 |
L2T |
3 |
20 |
F50 |
P180 |
L2T |
3 |
5 |
Shorts360 300 |
P68T |
L2T |
3 |
5 |
Shorts360 300 |
ATLA |
L2T |
2 |
20 |
F50 |
CN35 |
L2T |
2 |
20 |
F50 |
SW2 |
L2T |
2 |
5 |
Shorts360 300 |
STAR |
L2T |
1 |
5 |
Shorts360 300 |
C130 |
L4T |
267 |
70.3 |
Dash8 400 |
L188 |
L4T |
101 |
52.7 |
Dash8 400 |
P3 |
L4T |
14 |
63 |
Dash8 400 |
AN12 |
L4T |
9 |
61 |
Dash8 400 |
IL18 |
L4T |
2 |
64 |
Dash8 400 |
Jets
ICAO-code |
Category |
No. of LTOs |
MTOW |
Rep. type |
A7 |
L1J |
2 |
10 |
RJ 100 |
L39 |
L1J |
1 |
5 |
RJ 100 |
MD80 |
L2J |
44291 |
64 |
MD82-88 |
B73B |
L2J |
24390 |
63 |
B737-400 |
DC9 |
L2J |
11577 |
55 |
DC9 |
MD90 |
L2J |
5180 |
63 |
B737-400 |
A320 |
L2J |
4875 |
73.5 |
A320 |
B767 |
L2J |
3956 |
182 |
B767-300ER |
B73A |
L2J |
2265 |
52 |
B737-100 |
B73C |
L2J |
2177 |
63 |
B737-400 |
A300 |
L2J |
1781 |
142 |
A310 |
C500 |
L2J |
1599 |
5.2 |
RJ 100 |
B757 |
L2J |
1243 |
116 |
B757 |
F28 |
L2J |
1224 |
33 |
F28 |
F70 |
L2J |
1058 |
38 |
F28 |
E145 |
L2J |
615 |
21 |
RJ 100 |
F100 |
L2J |
583 |
43 |
F100 |
C650 |
L2J |
517 |
10.2 |
RJ 100 |
CARJ |
L2J |
430 |
24 |
RJ 100 |
S601 |
L2J |
388 |
6.6 |
RJ 100 |
CL60 |
L2J |
286 |
18 |
RJ 100 |
A310 |
L2J |
281 |
142 |
A310 |
C560 |
L2J |
268 |
9.1 |
RJ 100 |
LJ35 |
L2J |
260 |
8.3 |
RJ 100 |
FA20 |
L2J |
240 |
13 |
RJ 100 |
T134 |
L2J |
211 |
45 |
F100 |
H25B |
L2J |
202 |
10.6 |
RJ 100 |
BA11 |
L2J |
161 |
40 |
BAC1-11 |
GULF |
L2J |
147 |
31.6 |
F28 |
FA10 |
L2J |
88 |
8.5 |
RJ 100 |
LJ55 |
L2J |
75 |
9.5 |
RJ 100 |
TOR |
L2J |
67 |
10 |
RJ 100 |
AJET |
L2J |
34 |
10 |
RJ 100 |
LJ31 |
L2J |
29 |
7.7 |
RJ 100 |
H25A |
L2J |
25 |
10.6 |
RJ 100 |
SB05 |
L2J |
20 |
5 |
RJ 100 |
C525 |
L2J |
18 |
4.7 |
RJ 100 |
ASTR |
L2J |
13 |
10.7 |
RJ 100 |
LJ60 |
L2J |
9 |
10.7 |
RJ 100 |
JAGR |
L2J |
7 |
10 |
RJ 100 |
CNBR |
L2J |
6 |
10 |
RJ 100 |
VF14 |
L2J |
5 |
10 |
RJ 100 |
C750 |
L2J |
4 |
16.2 |
RJ 100 |
LJ24 |
L2J |
4 |
6.1 |
RJ 100 |
B777 |
L2J |
3 |
247 |
B777 |
A10 |
L2J |
2 |
10 |
RJ 100 |
LJ25 |
L2J |
2 |
5 |
RJ 100 |
P808 |
L2J |
2 |
10 |
RJ 100 |
AN72 |
L2J |
1 |
10 |
RJ 100 |
BE40 |
L2J |
1 |
10 |
RJ 100 |
H25C |
L2J |
1 |
10 |
RJ 100 |
LJ45 |
L2J |
1 |
10 |
RJ 100 |
WW24 |
L2J |
1 |
10 |
RJ 100 |
B727 |
L3J |
3315 |
95 |
B727 |
DC10 |
L3J |
777 |
259 |
DC10 |
YK40 |
L3J |
411 |
16 |
RJ 100 |
T154 |
L3J |
365 |
90 |
B727 |
MD11 |
L3J |
274 |
273 |
DC10 |
L101 |
L3J |
192 |
211 |
A330 |
FA50 |
L3J |
150 |
17.6 |
RJ 100 |
F900 |
L3J |
94 |
20.6 |
RJ 100 |
YK42 |
L3J |
28 |
57 |
DC9 |
BA46 |
L4J |
4402 |
42 |
BAe146 |
B74A |
L4J |
270 |
362 |
B747-400 |
A340 |
L4J |
158 |
275 |
A340 |
B74B |
L4J |
156 |
362 |
B747-400 |
DC8 |
L4J |
129 |
152 |
A310 |
B74S |
L4J |
71 |
362 |
B747-400 |
IL62 |
L4J |
35 |
162 |
A340 |
B707 |
L4J |
28 |
117 |
B757 |
IL76 |
L4J |
21 |
190 |
A340 |
C5 |
L4J |
7 |
275 |
A340 |
C141 |
L4J |
6 |
275 |
A340 |
IL86 |
L4J |
5 |
275 |
A340 |
A124 |
L4J |
3 |
275 |
A340 |
E3 |
L4J |
3 |
362 |
B747-400 |
C17 |
L4J |
1 |
275 |
A340 |
L29B |
L4J |
1 |
42 |
BAe146 |
VC10 |
L4J |
1 |
275 |
A340 |
Appendix 4
ICAO fuel flows and emission indices for selected engines
Motor id: |
JT8D-217C |
Power setting |
Time |
Fuel flow |
Emission indices [g/kg] |
||
Mode |
|
[% Foo] |
[mins] |
[kg/s] |
HC |
CO |
NOx |
|
|
|
|
|
|
|
|
Take off |
|
100 |
0.7 |
1.32 |
0.28 |
0.80 |
25.70 |
Climb out |
|
85 |
2.2 |
1.078 |
0.43 |
1.23 |
20.60 |
Approach |
|
30 |
4 |
0.3833 |
1.60 |
4.17 |
9.10 |
Idle |
|
7 |
26 |
0.1372 |
3.33 |
12.27 |
3.70 |
|
|
|
|
|
Total emissions [kg] |
||
|
|
|
|
Fuel |
HC |
CO |
NOx |
Take off |
|
|
|
55.44 |
0.02 |
0.04 |
1.42 |
Climb out |
|
|
|
142.296 |
0.06 |
0.18 |
2.93 |
Approach |
|
|
|
91.992 |
0.15 |
0.38 |
0.84 |
Idle |
|
|
|
214.032 |
0.71 |
2.63 |
0.79 |
LTO total |
|
|
|
503.76 |
0.94 |
3.23 |
5.99 |
|
|
|
|
|
|
|
|
Motor id: |
JT8D-219 |
Power setting |
Time |
Fuel flow |
Emission indices [g/kg] |
||
Mode |
|
[% Foo] |
[mins] |
[kg/s] |
HC |
CO |
NOx |
|
|
|
|
|
|
|
|
Take off |
|
100 |
0.7 |
1.354 |
0.27 |
0.73 |
27.00 |
Climb out |
|
85 |
2.2 |
1.085 |
0.42 |
1.20 |
20.80 |
Approach |
|
30 |
4 |
0.3817 |
1.59 |
4.07 |
9.13 |
Idle |
|
7 |
26 |
0.1344 |
3.48 |
12.63 |
3.60 |
|
|
|
|
|
Total emissions [kg] |
||
|
|
|
|
Fuel |
HC |
CO |
NOx |
Take off |
|
|
|
56.868 |
0.02 |
0.04 |
1.54 |
Climb out |
|
|
|
143.22 |
0.06 |
0.17 |
2.98 |
Approach |
|
|
|
91.608 |
0.15 |
0.37 |
0.84 |
Idle |
|
|
|
209.664 |
0.73 |
2.65 |
0.75 |
LTO total |
|
|
|
501.36 |
0.95 |
3.23 |
6.11 |
|
|
|
|
|
|
|
|
Motor id: |
JT8D-209 |
Power setting |
Time |
Fuel flow |
Emission indices [g/kg] |
||
Mode |
|
[% Foo] |
[mins] |
[kg/s] |
HC |
CO |
NOx |
|
|
|
|
|
|
|
|
Take off |
|
100 |
0.7 |
1.354 |
0.35 |
1.03 |
22.80 |
Climb out |
|
85 |
2.2 |
1.085 |
0.50 |
1.40 |
19.00 |
Approach |
|
30 |
4 |
0.3817 |
1.69 |
4.37 |
8.80 |
Idle |
|
7 |
26 |
0.1344 |
4.03 |
14.10 |
3.50 |
|
|
|
|
|
Total emissions [kg] |
||
|
|
|
|
Fuel |
HC |
CO |
NOx |
Take off |
|
|
|
56.868 |
0.02 |
0.06 |
1.30 |
Climb out |
|
|
|
143.22 |
0.07 |
0.20 |
2.72 |
Approach |
|
|
|
91.608 |
0.15 |
0.40 |
0.81 |
Idle |
|
|
|
209.664 |
0.84 |
2.96 |
0.73 |
LTO total |
|
|
|
501.36 |
1.09 |
3.62 |
5.56 |
Motor id: |
CFM56-7B20/2 |
Power setting |
Time |
Fuel flow |
Emission indices [g/kg] |
||
Mode |
|
[% Foo] |
[mins] |
[kg/s] |
HC |
CO |
NOx |
|
|
|
|
|
|
|
|
Take off |
|
100 |
0.7 |
0.903 |
0.07 |
4.26 |
13.25 |
Climb out |
|
85 |
2.2 |
0.754 |
0.23 |
11.38 |
10.81 |
Approach |
|
30 |
4 |
0.278 |
0.36 |
11.37 |
9.39 |
Idle |
|
7 |
26 |
0.102 |
8.11 |
49.71 |
3.75 |
|
|
|
|
|
Total emissions [kg] |
||
|
|
|
|
Fuel |
HC |
CO |
NOx |
Take off |
|
|
|
37.926 |
0.00 |
0.16 |
0.50 |
Climb out |
|
|
|
99.528 |
0.02 |
1.13 |
1.08 |
Approach |
|
|
|
66.72 |
0.02 |
0.76 |
0.63 |
Idle |
|
|
|
159.12 |
1.29 |
7.91 |
0.60 |
LTO total |
|
|
|
363.294 |
1.34 |
9.96 |
2.80 |
|
|
|
|
|
|
|
|
Motor id: |
CFM56-7B26/2 |
Power setting |
Time |
Fuel flow |
Emission indices [g/kg] |
||
Mode |
|
[% Foo] |
[mins] |
[kg/s] |
HC |
CO |
NOx |
|
|
|
|
|
|
|
|
Take off |
|
100 |
0.7 |
1.203 |
0.03 |
0.77 |
19.20 |
Climb out |
|
85 |
2.2 |
0.989 |
0.06 |
2.51 |
14.77 |
Approach |
|
30 |
4 |
0.334 |
4.73 |
26.07 |
7.26 |
Idle |
|
7 |
26 |
0.113 |
5.88 |
39.93 |
4.27 |
|
|
|
|
|
Total emissions [kg] |
||
|
|
|
|
Fuel |
HC |
CO |
NOx |
Take off |
|
|
|
50.526 |
0.00 |
0.04 |
0.97 |
Climb out |
|
|
|
130.548 |
0.01 |
0.33 |
1.93 |
Approach |
|
|
|
80.16 |
0.38 |
2.09 |
0.58 |
Idle |
|
|
|
176.28 |
1.04 |
7.04 |
0.75 |
LTO total |
|
|
|
437.514 |
1.43 |
9.50 |
4.23 |
Appendix 5
Data for previous CORINAIR methodology
No. of domestic LTO’s in Copenhagen Airport
ICAO-code |
No. of LTO's |
Category |
MTOW |
Rep. Type |
MD80 |
6632 |
L2J |
64 |
md81 |
B73B |
2077 |
L2J |
63 |
b737 |
DC9 |
297 |
L2J |
55 |
f50 |
B73C |
166 |
L2J |
63 |
b737 |
A320 |
111 |
L2J |
73,5 |
ea320 |
C500 |
105 |
L2J |
5,2 |
sf34 |
A300 |
71 |
L2J |
142 |
ea300 |
S601 |
42 |
L2J |
6,6 |
sf34 |
CL60 |
40 |
L2J |
18 |
f50 |
C650 |
37 |
L2J |
10,2 |
sf34 |
LJ35 |
37 |
L2J |
8,3 |
sf34 |
B767 |
35 |
L2J |
182 |
b767 |
C560 |
24 |
L2J |
9,1 |
sf34 |
FA20 |
22 |
L2J |
13 |
sf34 |
H25B |
12 |
L2J |
10,6 |
sf34 |
LJ55 |
8 |
L2J |
9,5 |
sf34 |
F28 |
6 |
L2J |
33 |
f50 |
MD90 |
5 |
L2J |
63 |
md81 |
B73A |
2 |
L2J |
52 |
b737 |
GULF |
2 |
L2J |
31,6 |
f50 |
A310 |
1 |
L2J |
142 |
ea310 |
FA10 |
1 |
L2J |
8,5 |
sf34 |
B727 |
322 |
L3J |
95 |
b727 |
FA50 |
14 |
L3J |
17,6 |
f50 |
F900 |
11 |
L3J |
20,6 |
f50 |
L101 |
11 |
L3J |
211 |
dc10 |
DC10 |
4 |
L3J |
259 |
dc10 |
T154 |
2 |
L3J |
90 |
b727 |
BA46 |
6 |
L4J |
42 |
ba46 |
C208 |
107 |
L1T |
3,3 |
sf34 |
ATR |
5815 |
L2T |
18,6 |
f50 |
F50 |
4946 |
L2T |
20,8 |
f50 |
SHD3 |
2018 |
L2T |
12,3 |
sf34 |
E110 |
864 |
L2T |
5,7 |
sf34 |
JSTA |
567 |
L2T |
7 |
sf34 |
SC7 |
310 |
L2T |
5,7 |
sf34 |
CVLT |
147 |
L2T |
25,9 |
f50 |
JS31 |
73 |
L2T |
7 |
sf34 |
N262 |
66 |
L2T |
10,7 |
sf34 |
SW3 |
60 |
L2T |
5 |
sf34 |
B350 |
55 |
L2T |
6,8 |
sf34 |
A748 |
21 |
L2T |
12,1 |
sf34 |
ATP |
15 |
L2T |
22,9 |
f50 |
B190 |
15 |
L2T |
7,5 |
sf34 |
F27 |
10 |
L2T |
20,4 |
f50 |
C212 |
8 |
L2T |
6,3 |
sf34 |
E120 |
8 |
L2T |
11,5 |
sf34 |
BE20 |
5 |
L2T |
5,7 |
sf34 |
JSTB |
3 |
L2T |
10,4 |
sf34 |
MU2 |
3 |
L2T |
4,1 |
sf34 |
BE9L |
2 |
L2T |
4,2 |
sf34 |
BE9T |
1 |
L2T |
4,2 |
sf34 |
F406 |
1 |
L2T |
3,3 |
sf34 |
PA42 |
1 |
L2T |
5,1 |
sf34 |
Total |
25224 |
No. of international LTO’s in Copenhagen Airport
ICAO-code |
No. of LTO's |
Category |
MTOW |
Rep. Type |
MD80 |
28192 |
L2J |
64 |
md81 |
B73B |
11218 |
L2J |
63 |
b737 |
DC9 |
10037 |
L2J |
55 |
dc9 |
MD90 |
5168 |
L2J |
63 |
md81 |
A320 |
3989 |
L2J |
73,5 |
ea320 |
B767 |
3635 |
L2J |
182 |
b767 |
B73A |
2251 |
L2J |
52 |
b737 |
A300 |
1436 |
L2J |
142 |
ea300 |
F28 |
1208 |
L2J |
33 |
f50 |
B757 |
1133 |
L2J |
116 |
b757 |
F70 |
1048 |
L2J |
38 |
f100 |
B73C |
1006 |
L2J |
63 |
b737 |
E145 |
615 |
L2J |
21 |
f50 |
F100 |
581 |
L2J |
43 |
f100 |
CARJ |
411 |
L2J |
24 |
f50 |
A310 |
269 |
L2J |
142 |
ea310 |
T134 |
167 |
L2J |
45 |
f100 |
BA11 |
161 |
L2J |
40 |
ba11 |
C500 |
148 |
L2J |
5,2 |
sf34 |
CL60 |
109 |
L2J |
18 |
f50 |
S601 |
101 |
L2J |
6,6 |
sf34 |
LJ35 |
91 |
L2J |
8,3 |
sf34 |
C650 |
56 |
L2J |
10,2 |
sf34 |
GULF |
47 |
L2J |
31,6 |
f50 |
H25B |
46 |
L2J |
10,6 |
sf34 |
C560 |
26 |
L2J |
9,1 |
sf34 |
FA20 |
22 |
L2J |
13 |
sf34 |
LJ55 |
20 |
L2J |
9,5 |
sf34 |
FA10 |
6 |
L2J |
8,5 |
sf34 |
LJ31 |
6 |
L2J |
7,7 |
sf34 |
B777 |
3 |
L2J |
247 |
dc10 |
C525 |
3 |
L2J |
4,7 |
sf34 |
LJ60 |
2 |
L2J |
10,7 |
sf34 |
AN72 |
1 |
L2J |
10 |
sf34 |
ASTR |
1 |
L2J |
10,7 |
sf34 |
C750 |
1 |
L2J |
16,2 |
f50 |
H25A |
1 |
L2J |
10,6 |
sf34 |
B727 |
2413 |
L3J |
95 |
b727 |
DC10 |
489 |
L3J |
259 |
dc10 |
T154 |
321 |
L3J |
90 |
b727 |
MD11 |
270 |
L3J |
273 |
md11 |
L101 |
137 |
L3J |
211 |
dc10 |
FA50 |
35 |
L3J |
17,6 |
f50 |
YK42 |
27 |
L3J |
57 |
dc9 |
F900 |
16 |
L3J |
20,6 |
f50 |
YK40 |
2 |
L3J |
16 |
f50 |
No. of international LTO’s in Copenhagen Airport
ICAO-code |
No. of LTO's |
Category |
MTOW |
Rep. Type |
BA46 |
3577 |
L4J |
42 |
ba46 |
B74A |
255 |
L4J |
362 |
b747 |
A340 |
158 |
L4J |
275 |
md11 |
B74B |
153 |
L4J |
362 |
b747 |
DC8 |
129 |
L4J |
152 |
ea310 |
B74S |
71 |
L4J |
362 |
b747 |
IL62 |
35 |
L4J |
162 |
ea300 |
B707 |
5 |
L4J |
117 |
b757 |
IL86 |
5 |
L4J |
275 |
md11 |
IL76 |
4 |
L4J |
190 |
ea300 |
A124 |
3 |
L4J |
275 |
md11 |
L29B |
1 |
L4J |
42 |
ba46 |
C208 |
3 |
L1T |
3,3 |
sf34 |
F50 |
17075 |
L2T |
20,8 |
f50 |
ATR |
2365 |
L2T |
18,6 |
f50 |
SHD3 |
1443 |
L2T |
12,3 |
sf34 |
DHC8 |
1059 |
L2T |
27,3 |
f50 |
SB20 |
695 |
L2T |
22,8 |
f50 |
AN26 |
339 |
L2T |
21 |
f50 |
SF34 |
244 |
L2T |
12,4 |
sf34 |
JSTA |
183 |
L2T |
7 |
sf34 |
F27 |
173 |
L2T |
20,4 |
f50 |
E110 |
106 |
L2T |
5,7 |
sf34 |
E120 |
88 |
L2T |
11,5 |
sf34 |
JS31 |
88 |
L2T |
7 |
sf34 |
BE20 |
55 |
L2T |
5,7 |
sf34 |
SW3 |
47 |
L2T |
5 |
sf34 |
A748 |
22 |
L2T |
12,1 |
sf34 |
MU2 |
18 |
L2T |
4,1 |
sf34 |
ATP |
15 |
L2T |
22,9 |
f50 |
N262 |
9 |
L2T |
10,7 |
sf34 |
SC7 |
9 |
L2T |
5,7 |
sf34 |
BE30 |
8 |
L2T |
5,7 |
sf34 |
CVLT |
8 |
L2T |
25,9 |
f50 |
BE10 |
7 |
L2T |
5,4 |
sf34 |
C425 |
5 |
L2T |
3,7 |
sf34 |
B350 |
4 |
L2T |
6,8 |
sf34 |
BE9L |
4 |
L2T |
4,2 |
sf34 |
C212 |
4 |
L2T |
6,3 |
sf34 |
JSTB |
4 |
L2T |
10,4 |
sf34 |
AC6T |
2 |
L2T |
5 |
sf34 |
C441 |
2 |
L2T |
3,7 |
sf34 |
D328 |
2 |
L2T |
14 |
sf34 |
P31T |
2 |
L2T |
4,1 |
sf34 |
PA42 |
2 |
L2T |
5,1 |
sf34 |
AN28 |
1 |
L2T |
6,5 |
sf34 |
F406 |
1 |
L2T |
3,3 |
sf34 |
L410 |
1 |
L2T |
6,6 |
sf34 |
L188 |
54 |
L4T |
52,7 |
l188 |
AN12 |
9 |
L4T |
61 |
b737 |
C130 |
6 |
L4T |
70,3 |
ea320 |
Total |
105483 |
|
|
|
No. of flights from Copenhagen Airport bound for Greenland
ICAO-code |
No. of LTO's |
Category |
MTOW |
Rep. Type |
B767 |
204 |
L2J |
182 |
b767 |
B757 |
97 |
L2J |
116 |
b757 |
B73B |
6 |
L2J |
63 |
b737 |
B73C |
5 |
L2J |
63 |
b737 |
ASTR |
1 |
L2J |
10,7 |
sf34 |
CL60 |
1 |
L2J |
18 |
f50 |
MD80 |
1 |
L2J |
64 |
md81 |
B727 |
1 |
L3J |
95 |
b727 |
FA50 |
1 |
L3J |
17,6 |
f50 |
Total |
317 |
No. of flights from Copenhagen Airport bound for Faroe Islands
ICAO-code |
No. of LTO's |
Category |
MTOW |
Rep. Type |
B73B |
308 |
L2J |
63 |
b737 |
C650 |
1 |
L2J |
10,2 |
sf34 |
BA46 |
427 |
L4J |
42 |
ba46 |
No. of domestic LTO’s in other Danish airports
ICAO-code |
No. of LTO's |
Category |
MTOW |
Rep. Type |
C208 |
161 |
L1T |
3,3 |
sf34 |
PC12 |
1 |
L1T |
4,5 |
sf34 |
PC6T |
1 |
L1T |
2,2 |
sf34 |
TBM7 |
1 |
L1T |
3 |
sf34 |
F50 |
8111 |
L2T |
20,8 |
f50 |
ATR |
5870 |
L2T |
18,6 |
f50 |
SHD3 |
2017 |
L2T |
12,3 |
sf34 |
BE20 |
1022 |
L2T |
5,7 |
sf34 |
JSTA |
977 |
L2T |
7 |
sf34 |
E110 |
887 |
L2T |
5,7 |
sf34 |
F27 |
509 |
L2T |
20,4 |
f50 |
SW3 |
451 |
L2T |
5 |
sf34 |
SC7 |
361 |
L2T |
5,7 |
sf34 |
B190 |
259 |
L2T |
7,5 |
sf34 |
JS31 |
172 |
L2T |
7 |
sf34 |
ATP |
168 |
L2T |
22,9 |
f50 |
F406 |
157 |
L2T |
3,3 |
sf34 |
CVLT |
115 |
L2T |
25,9 |
f50 |
B350 |
79 |
L2T |
6,8 |
sf34 |
JSTB |
74 |
L2T |
10,4 |
sf34 |
BE9L |
67 |
L2T |
4,2 |
sf34 |
N262 |
66 |
L2T |
10,7 |
sf34 |
E120 |
56 |
L2T |
11,5 |
sf34 |
BE9T |
54 |
L2T |
4,2 |
sf34 |
PA42 |
45 |
L2T |
5,1 |
sf34 |
P31T |
28 |
L2T |
4,1 |
sf34 |
L410 |
23 |
L2T |
6,6 |
sf34 |
A748 |
21 |
L2T |
12,1 |
sf34 |
AC6T |
14 |
L2T |
5 |
sf34 |
AN26 |
8 |
L2T |
21 |
f50 |
C212 |
6 |
L2T |
6,3 |
sf34 |
MU2 |
6 |
L2T |
4,1 |
sf34 |
JS41 |
5 |
L2T |
10,9 |
sf34 |
DHC8 |
4 |
L2T |
27,3 |
f50 |
PAY3 |
4 |
L2T |
5,1 |
sf34 |
BE30 |
3 |
L2T |
5,7 |
sf34 |
C425 |
2 |
L2T |
3,7 |
sf34 |
G159 |
1 |
L2T |
20 |
f50 |
L188 |
45 |
L4T |
52,7 |
l188 |
C130 |
17 |
L4T |
70,3 |
ea320 |
No. of domestic LTO’s in other Danish airports
ICAO-code |
No. of LTO's |
Category |
MTOW |
Rep. Type |
MD80 |
8952 |
L2J |
64 |
md81 |
B73B |
4787 |
L2J |
63 |
b737 |
C500 |
581 |
L2J |
5,2 |
sf34 |
DC9 |
354 |
L2J |
55 |
dc9 |
B73C |
278 |
L2J |
63 |
b737 |
A320 |
120 |
L2J |
73,5 |
ea320 |
C650 |
107 |
L2J |
10,2 |
sf34 |
S601 |
107 |
L2J |
6,6 |
sf34 |
A300 |
71 |
L2J |
142 |
ea300 |
CL60 |
65 |
L2J |
18 |
f50 |
LJ35 |
55 |
L2J |
8,3 |
sf34 |
H25B |
54 |
L2J |
10,6 |
sf34 |
B767 |
50 |
L2J |
182 |
b767 |
FA20 |
44 |
L2J |
13 |
sf34 |
C560 |
40 |
L2J |
9,1 |
sf34 |
FA10 |
16 |
L2J |
8,5 |
sf34 |
LJ55 |
16 |
L2J |
9,5 |
sf34 |
LJ31 |
13 |
L2J |
7,7 |
sf34 |
GULF |
12 |
L2J |
31,6 |
f50 |
F28 |
8 |
L2J |
33 |
f50 |
T134 |
7 |
L2J |
45 |
f100 |
MD90 |
6 |
L2J |
63 |
md81 |
B73A |
4 |
L2J |
52 |
b737 |
A310 |
2 |
L2J |
142 |
ea310 |
ASTR |
2 |
L2J |
10,7 |
sf34 |
F100 |
2 |
L2J |
43 |
f100 |
C525 |
1 |
L2J |
4,7 |
sf34 |
H25A |
1 |
L2J |
10,6 |
sf34 |
LJ60 |
1 |
L2J |
10,7 |
sf34 |
B727 |
253 |
L3J |
95 |
b727 |
T154 |
24 |
L3J |
90 |
b727 |
FA50 |
18 |
L3J |
17,6 |
f50 |
F900 |
14 |
L3J |
20,6 |
f50 |
DC10 |
7 |
L3J |
259 |
dc10 |
L101 |
5 |
L3J |
211 |
dc10 |
YK40 |
1 |
L3J |
16 |
f50 |
BA46 |
122 |
L4J |
42 |
ba46 |
B707 |
1 |
L4J |
117 |
b757 |
B74A |
1 |
L4J |
362 |
b747 |
B74B |
1 |
L4J |
362 |
b747 |
Total |
38071 |
|
|
|
No. of international LTO’s in other Danish airports
ICAO-code |
No. of LTO's |
Category |
MTOW |
Rep. Type |
A7 |
2 |
L1J |
10 |
sf34 |
L39 |
1 |
L1J |
5 |
sf34 |
B73B |
5877 |
L2J |
63 |
b737 |
DC9 |
889 |
L2J |
55 |
dc9 |
C500 |
761 |
L2J |
5,2 |
sf34 |
B73C |
722 |
L2J |
63 |
b737 |
A320 |
655 |
L2J |
73,5 |
ea320 |
MD80 |
514 |
L2J |
64 |
md81 |
C650 |
316 |
L2J |
10,2 |
sf34 |
A300 |
203 |
L2J |
142 |
ea300 |
C560 |
178 |
L2J |
9,1 |
sf34 |
FA20 |
151 |
L2J |
13 |
sf34 |
S601 |
138 |
L2J |
6,6 |
sf34 |
H25B |
90 |
L2J |
10,6 |
sf34 |
LJ35 |
77 |
L2J |
8,3 |
sf34 |
CL60 |
69 |
L2J |
18 |
f50 |
TOR |
67 |
L2J |
10 |
sf34 |
FA10 |
65 |
L2J |
8,5 |
sf34 |
GULF |
64 |
L2J |
31,6 |
f50 |
T134 |
37 |
L2J |
45 |
f100 |
AJET |
34 |
L2J |
10 |
sf34 |
B767 |
31 |
L2J |
182 |
b767 |
LJ55 |
31 |
L2J |
9,5 |
sf34 |
H25A |
23 |
L2J |
10,6 |
sf34 |
SB05 |
20 |
L2J |
5 |
sf34 |
CARJ |
19 |
L2J |
24 |
f50 |
C525 |
14 |
L2J |
4,7 |
sf34 |
B757 |
13 |
L2J |
116 |
b757 |
F70 |
10 |
L2J |
38 |
f100 |
LJ31 |
10 |
L2J |
7,7 |
sf34 |
A310 |
9 |
L2J |
142 |
ea310 |
ASTR |
9 |
L2J |
10,7 |
sf34 |
B73A |
8 |
L2J |
52 |
b737 |
JAGR |
7 |
L2J |
10 |
sf34 |
CNBR |
6 |
L2J |
10 |
sf34 |
LJ60 |
6 |
L2J |
10,7 |
sf34 |
VF14 |
5 |
L2J |
10 |
sf34 |
LJ24 |
4 |
L2J |
6,1 |
sf34 |
C750 |
3 |
L2J |
16,2 |
f50 |
A10 |
2 |
L2J |
10 |
sf34 |
F28 |
2 |
L2J |
33 |
f50 |
LJ25 |
2 |
L2J |
5 |
sf34 |
P808 |
2 |
L2J |
10 |
sf34 |
BE40 |
1 |
L2J |
10 |
sf34 |
H25C |
1 |
L2J |
10 |
sf34 |
LJ45 |
1 |
L2J |
10 |
sf34 |
MD90 |
1 |
L2J |
63 |
md81 |
WW24 |
1 |
L2J |
10 |
sf34 |
No. of international LTO’s in other Danish airports
ICAO-code |
No. of LTO's |
Category |
MTOW |
Rep. Type |
YK40 |
408 |
L3J |
16 |
f50 |
B727 |
326 |
L3J |
95 |
b727 |
DC10 |
277 |
L3J |
259 |
dc10 |
FA50 |
76 |
L3J |
17,6 |
f50 |
F900 |
53 |
L3J |
20,6 |
f50 |
L101 |
39 |
L3J |
211 |
dc10 |
T154 |
18 |
L3J |
90 |
b727 |
MD11 |
4 |
L3J |
273 |
md11 |
YK42 |
1 |
L3J |
57 |
dc9 |
BA46 |
235 |
L4J |
42 |
ba46 |
B707 |
21 |
L4J |
117 |
b757 |
IL76 |
17 |
L4J |
190 |
ea300 |
B74A |
14 |
L4J |
362 |
b747 |
C5 |
7 |
L4J |
275 |
md11 |
C141 |
6 |
L4J |
275 |
md11 |
E3 |
3 |
L4J |
362 |
b747 |
B74B |
2 |
L4J |
362 |
b747 |
C17 |
1 |
L4J |
275 |
md11 |
VC10 |
1 |
L4J |
275 |
md11 |
C208 |
85 |
L1T |
3,3 |
sf34 |
TBM7 |
18 |
L1T |
3 |
sf34 |
PC12 |
9 |
L1T |
4,5 |
sf34 |
PC6T |
7 |
L1T |
2,2 |
sf34 |
PC7 |
3 |
L1T |
3 |
sf34 |
DH2T |
2 |
L1T |
2,4 |
sf34 |
TUCA |
1 |
L1T |
3 |
sf34 |
JSTA |
832 |
L2T |
7 |
sf34 |
JSTB |
827 |
L2T |
10,4 |
sf34 |
SHD3 |
741 |
L2T |
12,3 |
sf34 |
BE20 |
737 |
L2T |
5,7 |
sf34 |
ATP |
686 |
L2T |
22,9 |
f50 |
SW3 |
641 |
L2T |
5 |
sf34 |
F27 |
489 |
L2T |
20,4 |
f50 |
ATR |
342 |
L2T |
18,6 |
f50 |
SF34 |
317 |
L2T |
12,4 |
sf34 |
F406 |
283 |
L2T |
3,3 |
sf34 |
B190 |
206 |
L2T |
7,5 |
sf34 |
F50 |
192 |
L2T |
20,8 |
f50 |
JS41 |
165 |
L2T |
10,9 |
sf34 |
JS31 |
159 |
L2T |
7 |
sf34 |
PA42 |
157 |
L2T |
5,1 |
sf34 |
B350 |
139 |
L2T |
6,8 |
sf34 |
BE9L |
132 |
L2T |
4,2 |
sf34 |
E120 |
83 |
L2T |
11,5 |
sf34 |
D228 |
74 |
L2T |
5,7 |
sf34 |
P31T |
69 |
L2T |
4,1 |
sf34 |
L410 |
66 |
L2T |
6,6 |
sf34 |
CVLT |
60 |
L2T |
25,9 |
f50 |
AC6T |
44 |
L2T |
5 |
sf34 |
BE30 |
33 |
L2T |
5,7 |
sf34 |
PAY3 |
31 |
L2T |
5,1 |
sf34 |
A748 |
29 |
L2T |
12,1 |
sf34 |
AN26 |
28 |
L2T |
21 |
f50 |
SC7 |
28 |
L2T |
5,7 |
sf34 |
MU2 |
24 |
L2T |
4,1 |
sf34 |
E110 |
23 |
L2T |
5,7 |
sf34 |
BE9T |
21 |
L2T |
4,2 |
sf34 |
C425 |
21 |
L2T |
3,7 |
sf34 |
AN24 |
15 |
L2T |
21 |
f50 |
N262 |
13 |
L2T |
10,7 |
sf34 |
C212 |
12 |
L2T |
6,3 |
sf34 |
G222 |
10 |
L2T |
20 |
f50 |
F60 |
9 |
L2T |
20 |
f50 |
BE10 |
8 |
L2T |
5,4 |
sf34 |
DHC8 |
8 |
L2T |
27,3 |
f50 |
C160 |
7 |
L2T |
20 |
f50 |
DHC6 |
7 |
L2T |
4,8 |
sf34 |
C441 |
6 |
L2T |
3,7 |
sf34 |
D328 |
4 |
L2T |
14 |
sf34 |
SB20 |
4 |
L2T |
22,8 |
f50 |
E121 |
3 |
L2T |
5 |
sf34 |
P180 |
3 |
L2T |
5 |
sf34 |
P68T |
3 |
L2T |
5 |
sf34 |
AN28 |
2 |
L2T |
6,5 |
sf34 |
ATLA |
2 |
L2T |
20 |
f50 |
CN35 |
2 |
L2T |
20 |
f50 |
G159 |
2 |
L2T |
20 |
f50 |
SW2 |
2 |
L2T |
5 |
sf34 |
STAR |
1 |
L2T |
5 |
sf34 |
C130 |
225 |
L4T |
70,3 |
ea320 |
P3 |
14 |
L4T |
63 |
md81 |
IL18 |
2 |
L4T |
64 |
md81 |
L188 |
2 |
L4T |
52,7 |
l188 |
Total |
20830 |
|
|
|
No. of flights from other Danish airports bound for Greenland
ICAO-code |
No. of LTO's |
Category |
MTOW |
Rep. Type |
GULF |
17 |
L2J |
31,6 |
f50 |
CL60 |
2 |
L2J |
18 |
f50 |
B73B |
1 |
L2J |
63 |
b737 |
B767 |
1 |
L2J |
182 |
b767 |
FA20 |
1 |
L2J |
13 |
sf34 |
FA50 |
6 |
L3J |
17,6 |
f50 |
B707 |
1 |
L4J |
117 |
b757 |
C130 |
9 |
L4T |
70,3 |
ea320 |
Total |
38 |
|
|
|
No. of flights from other Danish airports bound for Faroe Islands
ICAO-code |
No. of LTO's |
Category |
MTOW |
Rep. Type |
B73B |
116 |
L2J |
63 |
b737 |
GULF |
5 |
L2J |
31,6 |
f50 |
C500 |
4 |
L2J |
5,2 |
sf34 |
BA46 |
35 |
L4J |
42 |
ba46 |
C130 |
10 |
L4T |
70,3 |
ea320 |
Total |
170 |
|
|
|
Bilag 5
Data for previous CORINAIR methodology
No. of domestic LTO’s in Copenhagen Airport
ICAO-code |
No. of LTO's |
Category |
MTOW |
Rep. Type |
MD80 |
6632 |
L2J |
64 |
md81 |
B73B |
2077 |
L2J |
63 |
b737 |
DC9 |
297 |
L2J |
55 |
f50 |
B73C |
166 |
L2J |
63 |
b737 |
A320 |
111 |
L2J |
73,5 |
ea320 |
C500 |
105 |
L2J |
5,2 |
sf34 |
A300 |
71 |
L2J |
142 |
ea300 |
S601 |
42 |
L2J |
6,6 |
sf34 |
CL60 |
40 |
L2J |
18 |
f50 |
C650 |
37 |
L2J |
10,2 |
sf34 |
LJ35 |
37 |
L2J |
8,3 |
sf34 |
B767 |
35 |
L2J |
182 |
b767 |
C560 |
24 |
L2J |
9,1 |
sf34 |
FA20 |
22 |
L2J |
13 |
sf34 |
H25B |
12 |
L2J |
10,6 |
sf34 |
LJ55 |
8 |
L2J |
9,5 |
sf34 |
F28 |
6 |
L2J |
33 |
f50 |
MD90 |
5 |
L2J |
63 |
md81 |
B73A |
2 |
L2J |
52 |
b737 |
GULF |
2 |
L2J |
31,6 |
f50 |
A310 |
1 |
L2J |
142 |
ea310 |
FA10 |
1 |
L2J |
8,5 |
sf34 |
B727 |
322 |
L3J |
95 |
b727 |
FA50 |
14 |
L3J |
17,6 |
f50 |
F900 |
11 |
L3J |
20,6 |
f50 |
L101 |
11 |
L3J |
211 |
dc10 |
DC10 |
4 |
L3J |
259 |
dc10 |
T154 |
2 |
L3J |
90 |
b727 |
BA46 |
6 |
L4J |
42 |
ba46 |
C208 |
107 |
L1T |
3,3 |
sf34 |
ATR |
5815 |
L2T |
18,6 |
f50 |
F50 |
4946 |
L2T |
20,8 |
f50 |
SHD3 |
2018 |
L2T |
12,3 |
sf34 |
E110 |
864 |
L2T |
5,7 |
sf34 |
JSTA |
567 |
L2T |
7 |
sf34 |
SC7 |
310 |
L2T |
5,7 |
sf34 |
CVLT |
147 |
L2T |
25,9 |
f50 |
JS31 |
73 |
L2T |
7 |
sf34 |
N262 |
66 |
L2T |
10,7 |
sf34 |
SW3 |
60 |
L2T |
5 |
sf34 |
B350 |
55 |
L2T |
6,8 |
sf34 |
A748 |
21 |
L2T |
12,1 |
sf34 |
ATP |
15 |
L2T |
22,9 |
f50 |
B190 |
15 |
L2T |
7,5 |
sf34 |
F27 |
10 |
L2T |
20,4 |
f50 |
C212 |
8 |
L2T |
6,3 |
sf34 |
E120 |
8 |
L2T |
11,5 |
sf34 |
BE20 |
5 |
L2T |
5,7 |
sf34 |
JSTB |
3 |
L2T |
10,4 |
sf34 |
MU2 |
3 |
L2T |
4,1 |
sf34 |
BE9L |
2 |
L2T |
4,2 |
sf34 |
BE9T |
1 |
L2T |
4,2 |
sf34 |
F406 |
1 |
L2T |
3,3 |
sf34 |
PA42 |
1 |
L2T |
5,1 |
sf34 |
Total |
25224 |
No. of international LTO’s in Copenhagen Airport
ICAO-code |
No. of LTO's |
Category |
MTOW |
Rep. Type |
MD80 |
28192 |
L2J |
64 |
md81 |
B73B |
11218 |
L2J |
63 |
b737 |
DC9 |
10037 |
L2J |
55 |
dc9 |
MD90 |
5168 |
L2J |
63 |
md81 |
A320 |
3989 |
L2J |
73,5 |
ea320 |
B767 |
3635 |
L2J |
182 |
b767 |
B73A |
2251 |
L2J |
52 |
b737 |
A300 |
1436 |
L2J |
142 |
ea300 |
F28 |
1208 |
L2J |
33 |
f50 |
B757 |
1133 |
L2J |
116 |
b757 |
F70 |
1048 |
L2J |
38 |
f100 |
B73C |
1006 |
L2J |
63 |
b737 |
E145 |
615 |
L2J |
21 |
f50 |
F100 |
581 |
L2J |
43 |
f100 |
CARJ |
411 |
L2J |
24 |
f50 |
A310 |
269 |
L2J |
142 |
ea310 |
T134 |
167 |
L2J |
45 |
f100 |
BA11 |
161 |
L2J |
40 |
ba11 |
C500 |
148 |
L2J |
5,2 |
sf34 |
CL60 |
109 |
L2J |
18 |
f50 |
S601 |
101 |
L2J |
6,6 |
sf34 |
LJ35 |
91 |
L2J |
8,3 |
sf34 |
C650 |
56 |
L2J |
10,2 |
sf34 |
GULF |
47 |
L2J |
31,6 |
f50 |
H25B |
46 |
L2J |
10,6 |
sf34 |
C560 |
26 |
L2J |
9,1 |
sf34 |
FA20 |
22 |
L2J |
13 |
sf34 |
LJ55 |
20 |
L2J |
9,5 |
sf34 |
FA10 |
6 |
L2J |
8,5 |
sf34 |
LJ31 |
6 |
L2J |
7,7 |
sf34 |
B777 |
3 |
L2J |
247 |
dc10 |
C525 |
3 |
L2J |
4,7 |
sf34 |
LJ60 |
2 |
L2J |
10,7 |
sf34 |
AN72 |
1 |
L2J |
10 |
sf34 |
ASTR |
1 |
L2J |
10,7 |
sf34 |
C750 |
1 |
L2J |
16,2 |
f50 |
H25A |
1 |
L2J |
10,6 |
sf34 |
B727 |
2413 |
L3J |
95 |
b727 |
DC10 |
489 |
L3J |
259 |
dc10 |
T154 |
321 |
L3J |
90 |
b727 |
MD11 |
270 |
L3J |
273 |
md11 |
L101 |
137 |
L3J |
211 |
dc10 |
FA50 |
35 |
L3J |
17,6 |
f50 |
YK42 |
27 |
L3J |
57 |
dc9 |
F900 |
16 |
L3J |
20,6 |
f50 |
YK40 |
2 |
L3J |
16 |
f50 |
No. of international LTO’s in Copenhagen Airport
ICAO-code |
No. of LTO's |
Category |
MTOW |
Rep. Type |
BA46 |
3577 |
L4J |
42 |
ba46 |
B74A |
255 |
L4J |
362 |
b747 |
A340 |
158 |
L4J |
275 |
md11 |
B74B |
153 |
L4J |
362 |
b747 |
DC8 |
129 |
L4J |
152 |
ea310 |
B74S |
71 |
L4J |
362 |
b747 |
IL62 |
35 |
L4J |
162 |
ea300 |
B707 |
5 |
L4J |
117 |
b757 |
IL86 |
5 |
L4J |
275 |
md11 |
IL76 |
4 |
L4J |
190 |
ea300 |
A124 |
3 |
L4J |
275 |
md11 |
L29B |
1 |
L4J |
42 |
ba46 |
C208 |
3 |
L1T |
3,3 |
sf34 |
F50 |
17075 |
L2T |
20,8 |
f50 |
ATR |
2365 |
L2T |
18,6 |
f50 |
SHD3 |
1443 |
L2T |
12,3 |
sf34 |
DHC8 |
1059 |
L2T |
27,3 |
f50 |
SB20 |
695 |
L2T |
22,8 |
f50 |
AN26 |
339 |
L2T |
21 |
f50 |
SF34 |
244 |
L2T |
12,4 |
sf34 |
JSTA |
183 |
L2T |
7 |
sf34 |
F27 |
173 |
L2T |
20,4 |
f50 |
E110 |
106 |
L2T |
5,7 |
sf34 |
E120 |
88 |
L2T |
11,5 |
sf34 |
JS31 |
88 |
L2T |
7 |
sf34 |
BE20 |
55 |
L2T |
5,7 |
sf34 |
SW3 |
47 |
L2T |
5 |
sf34 |
A748 |
22 |
L2T |
12,1 |
sf34 |
MU2 |
18 |
L2T |
4,1 |
sf34 |
ATP |
15 |
L2T |
22,9 |
f50 |
N262 |
9 |
L2T |
10,7 |
sf34 |
SC7 |
9 |
L2T |
5,7 |
sf34 |
BE30 |
8 |
L2T |
5,7 |
sf34 |
CVLT |
8 |
L2T |
25,9 |
f50 |
BE10 |
7 |
L2T |
5,4 |
sf34 |
C425 |
5 |
L2T |
3,7 |
sf34 |
B350 |
4 |
L2T |
6,8 |
sf34 |
BE9L |
4 |
L2T |
4,2 |
sf34 |
C212 |
4 |
L2T |
6,3 |
sf34 |
JSTB |
4 |
L2T |
10,4 |
sf34 |
AC6T |
2 |
L2T |
5 |
sf34 |
C441 |
2 |
L2T |
3,7 |
sf34 |
D328 |
2 |
L2T |
14 |
sf34 |
P31T |
2 |
L2T |
4,1 |
sf34 |
PA42 |
2 |
L2T |
5,1 |
sf34 |
AN28 |
1 |
L2T |
6,5 |
sf34 |
F406 |
1 |
L2T |
3,3 |
sf34 |
L410 |
1 |
L2T |
6,6 |
sf34 |
L188 |
54 |
L4T |
52,7 |
l188 |
AN12 |
9 |
L4T |
61 |
b737 |
C130 |
6 |
L4T |
70,3 |
ea320 |
Total |
105483 |
|
|
|
No. of flights from Copenhagen Airport bound for Greenland
ICAO-code |
No. of LTO's |
Category |
MTOW |
Rep. Type |
B767 |
204 |
L2J |
182 |
b767 |
B757 |
97 |
L2J |
116 |
b757 |
B73B |
6 |
L2J |
63 |
b737 |
B73C |
5 |
L2J |
63 |
b737 |
ASTR |
1 |
L2J |
10,7 |
sf34 |
CL60 |
1 |
L2J |
18 |
f50 |
MD80 |
1 |
L2J |
64 |
md81 |
B727 |
1 |
L3J |
95 |
b727 |
FA50 |
1 |
L3J |
17,6 |
f50 |
Total |
317 |
No. of flights from Copenhagen Airport bound for Faroe Islands
ICAO-code |
No. of LTO's |
Category |
MTOW |
Rep. Type |
B73B |
308 |
L2J |
63 |
b737 |
C650 |
1 |
L2J |
10,2 |
sf34 |
BA46 |
427 |
L4J |
42 |
ba46 |
No. of domestic LTO’s in other Danish airports
ICAO-code |
No. of LTO's |
Category |
MTOW |
Rep. Type |
C208 |
161 |
L1T |
3,3 |
sf34 |
PC12 |
1 |
L1T |
4,5 |
sf34 |
PC6T |
1 |
L1T |
2,2 |
sf34 |
TBM7 |
1 |
L1T |
3 |
sf34 |
F50 |
8111 |
L2T |
20,8 |
f50 |
ATR |
5870 |
L2T |
18,6 |
f50 |
SHD3 |
2017 |
L2T |
12,3 |
sf34 |
BE20 |
1022 |
L2T |
5,7 |
sf34 |
JSTA |
977 |
L2T |
7 |
sf34 |
E110 |
887 |
L2T |
5,7 |
sf34 |
F27 |
509 |
L2T |
20,4 |
f50 |
SW3 |
451 |
L2T |
5 |
sf34 |
SC7 |
361 |
L2T |
5,7 |
sf34 |
B190 |
259 |
L2T |
7,5 |
sf34 |
JS31 |
172 |
L2T |
7 |
sf34 |
ATP |
168 |
L2T |
22,9 |
f50 |
F406 |
157 |
L2T |
3,3 |
sf34 |
CVLT |
115 |
L2T |
25,9 |
f50 |
B350 |
79 |
L2T |
6,8 |
sf34 |
JSTB |
74 |
L2T |
10,4 |
sf34 |
BE9L |
67 |
L2T |
4,2 |
sf34 |
N262 |
66 |
L2T |
10,7 |
sf34 |
E120 |
56 |
L2T |
11,5 |
sf34 |
BE9T |
54 |
L2T |
4,2 |
sf34 |
PA42 |
45 |
L2T |
5,1 |
sf34 |
P31T |
28 |
L2T |
4,1 |
sf34 |
L410 |
23 |
L2T |
6,6 |
sf34 |
A748 |
21 |
L2T |
12,1 |
sf34 |
AC6T |
14 |
L2T |
5 |
sf34 |
AN26 |
8 |
L2T |
21 |
f50 |
C212 |
6 |
L2T |
6,3 |
sf34 |
MU2 |
6 |
L2T |
4,1 |
sf34 |
JS41 |
5 |
L2T |
10,9 |
sf34 |
DHC8 |
4 |
L2T |
27,3 |
f50 |
PAY3 |
4 |
L2T |
5,1 |
sf34 |
BE30 |
3 |
L2T |
5,7 |
sf34 |
C425 |
2 |
L2T |
3,7 |
sf34 |
G159 |
1 |
L2T |
20 |
f50 |
L188 |
45 |
L4T |
52,7 |
l188 |
C130 |
17 |
L4T |
70,3 |
ea320 |
No. of domestic LTO’s in other Danish airports
ICAO-code |
No. of LTO's |
Category |
MTOW |
Rep. Type |
MD80 |
8952 |
L2J |
64 |
md81 |
B73B |
4787 |
L2J |
63 |
b737 |
C500 |
581 |
L2J |
5,2 |
sf34 |
DC9 |
354 |
L2J |
55 |
dc9 |
B73C |
278 |
L2J |
63 |
b737 |
A320 |
120 |
L2J |
73,5 |
ea320 |
C650 |
107 |
L2J |
10,2 |
sf34 |
S601 |
107 |
L2J |
6,6 |
sf34 |
A300 |
71 |
L2J |
142 |
ea300 |
CL60 |
65 |
L2J |
18 |
f50 |
LJ35 |
55 |
L2J |
8,3 |
sf34 |
H25B |
54 |
L2J |
10,6 |
sf34 |
B767 |
50 |
L2J |
182 |
b767 |
FA20 |
44 |
L2J |
13 |
sf34 |
C560 |
40 |
L2J |
9,1 |
sf34 |
FA10 |
16 |
L2J |
8,5 |
sf34 |
LJ55 |
16 |
L2J |
9,5 |
sf34 |
LJ31 |
13 |
L2J |
7,7 |
sf34 |
GULF |
12 |
L2J |
31,6 |
f50 |
F28 |
8 |
L2J |
33 |
f50 |
T134 |
7 |
L2J |
45 |
f100 |
MD90 |
6 |
L2J |
63 |
md81 |
B73A |
4 |
L2J |
52 |
b737 |
A310 |
2 |
L2J |
142 |
ea310 |
ASTR |
2 |
L2J |
10,7 |
sf34 |
F100 |
2 |
L2J |
43 |
f100 |
C525 |
1 |
L2J |
4,7 |
sf34 |
H25A |
1 |
L2J |
10,6 |
sf34 |
LJ60 |
1 |
L2J |
10,7 |
sf34 |
B727 |
253 |
L3J |
95 |
b727 |
T154 |
24 |
L3J |
90 |
b727 |
FA50 |
18 |
L3J |
17,6 |
f50 |
F900 |
14 |
L3J |
20,6 |
f50 |
DC10 |
7 |
L3J |
259 |
dc10 |
L101 |
5 |
L3J |
211 |
dc10 |
YK40 |
1 |
L3J |
16 |
f50 |
BA46 |
122 |
L4J |
42 |
ba46 |
B707 |
1 |
L4J |
117 |
b757 |
B74A |
1 |
L4J |
362 |
b747 |
B74B |
1 |
L4J |
362 |
b747 |
Total |
38071 |
|
|
|
No. of international LTO’s in other Danish airports
ICAO-code |
No. of LTO's |
Category |
MTOW |
Rep. Type |
A7 |
2 |
L1J |
10 |
sf34 |
L39 |
1 |
L1J |
5 |
sf34 |
B73B |
5877 |
L2J |
63 |
b737 |
DC9 |
889 |
L2J |
55 |
dc9 |
C500 |
761 |
L2J |
5,2 |
sf34 |
B73C |
722 |
L2J |
63 |
b737 |
A320 |
655 |
L2J |
73,5 |
ea320 |
MD80 |
514 |
L2J |
64 |
md81 |
C650 |
316 |
L2J |
10,2 |
sf34 |
A300 |
203 |
L2J |
142 |
ea300 |
C560 |
178 |
L2J |
9,1 |
sf34 |
FA20 |
151 |
L2J |
13 |
sf34 |
S601 |
138 |
L2J |
6,6 |
sf34 |
H25B |
90 |
L2J |
10,6 |
sf34 |
LJ35 |
77 |
L2J |
8,3 |
sf34 |
CL60 |
69 |
L2J |
18 |
f50 |
TOR |
67 |
L2J |
10 |
sf34 |
FA10 |
65 |
L2J |
8,5 |
sf34 |
GULF |
64 |
L2J |
31,6 |
f50 |
T134 |
37 |
L2J |
45 |
f100 |
AJET |
34 |
L2J |
10 |
sf34 |
B767 |
31 |
L2J |
182 |
b767 |
LJ55 |
31 |
L2J |
9,5 |
sf34 |
H25A |
23 |
L2J |
10,6 |
sf34 |
SB05 |
20 |
L2J |
5 |
sf34 |
CARJ |
19 |
L2J |
24 |
f50 |
C525 |
14 |
L2J |
4,7 |
sf34 |
B757 |
13 |
L2J |
116 |
b757 |
F70 |
10 |
L2J |
38 |
f100 |
LJ31 |
10 |
L2J |
7,7 |
sf34 |
A310 |
9 |
L2J |
142 |
ea310 |
ASTR |
9 |
L2J |
10,7 |
sf34 |
B73A |
8 |
L2J |
52 |
b737 |
JAGR |
7 |
L2J |
10 |
sf34 |
CNBR |
6 |
L2J |
10 |
sf34 |
LJ60 |
6 |
L2J |
10,7 |
sf34 |
VF14 |
5 |
L2J |
10 |
sf34 |
LJ24 |
4 |
L2J |
6,1 |
sf34 |
C750 |
3 |
L2J |
16,2 |
f50 |
A10 |
2 |
L2J |
10 |
sf34 |
F28 |
2 |
L2J |
33 |
f50 |
LJ25 |
2 |
L2J |
5 |
sf34 |
P808 |
2 |
L2J |
10 |
sf34 |
BE40 |
1 |
L2J |
10 |
sf34 |
H25C |
1 |
L2J |
10 |
sf34 |
LJ45 |
1 |
L2J |
10 |
sf34 |
MD90 |
1 |
L2J |
63 |
md81 |
WW24 |
1 |
L2J |
10 |
sf34 |
No. of international LTO’s in other Danish airports
ICAO-code |
No. of LTO's |
Category |
MTOW |
Rep. Type |
YK40 |
408 |
L3J |
16 |
f50 |
B727 |
326 |
L3J |
95 |
b727 |
DC10 |
277 |
L3J |
259 |
dc10 |
FA50 |
76 |
L3J |
17,6 |
f50 |
F900 |
53 |
L3J |
20,6 |
f50 |
L101 |
39 |
L3J |
211 |
dc10 |
T154 |
18 |
L3J |
90 |
b727 |
MD11 |
4 |
L3J |
273 |
md11 |
YK42 |
1 |
L3J |
57 |
dc9 |
BA46 |
235 |
L4J |
42 |
ba46 |
B707 |
21 |
L4J |
117 |
b757 |
IL76 |
17 |
L4J |
190 |
ea300 |
B74A |
14 |
L4J |
362 |
b747 |
C5 |
7 |
L4J |
275 |
md11 |
C141 |
6 |
L4J |
275 |
md11 |
E3 |
3 |
L4J |
362 |
b747 |
B74B |
2 |
L4J |
362 |
b747 |
C17 |
1 |
L4J |
275 |
md11 |
VC10 |
1 |
L4J |
275 |
md11 |
C208 |
85 |
L1T |
3,3 |
sf34 |
TBM7 |
18 |
L1T |
3 |
sf34 |
PC12 |
9 |
L1T |
4,5 |
sf34 |
PC6T |
7 |
L1T |
2,2 |
sf34 |
PC7 |
3 |
L1T |
3 |
sf34 |
DH2T |
2 |
L1T |
2,4 |
sf34 |
TUCA |
1 |
L1T |
3 |
sf34 |
JSTA |
832 |
L2T |
7 |
sf34 |
JSTB |
827 |
L2T |
10,4 |
sf34 |
SHD3 |
741 |
L2T |
12,3 |
sf34 |
BE20 |
737 |
L2T |
5,7 |
sf34 |
ATP |
686 |
L2T |
22,9 |
f50 |
SW3 |
641 |
L2T |
5 |
sf34 |
F27 |
489 |
L2T |
20,4 |
f50 |
ATR |
342 |
L2T |
18,6 |
f50 |
SF34 |
317 |
L2T |
12,4 |
sf34 |
F406 |
283 |
L2T |
3,3 |
sf34 |
B190 |
206 |
L2T |
7,5 |
sf34 |
F50 |
192 |
L2T |
20,8 |
f50 |
JS41 |
165 |
L2T |
10,9 |
sf34 |
JS31 |
159 |
L2T |
7 |
sf34 |
PA42 |
157 |
L2T |
5,1 |
sf34 |
B350 |
139 |
L2T |
6,8 |
sf34 |
BE9L |
132 |
L2T |
4,2 |
sf34 |
E120 |
83 |
L2T |
11,5 |
sf34 |
D228 |
74 |
L2T |
5,7 |
sf34 |
P31T |
69 |
L2T |
4,1 |
sf34 |
L410 |
66 |
L2T |
6,6 |
sf34 |
CVLT |
60 |
L2T |
25,9 |
f50 |
AC6T |
44 |
L2T |
5 |
sf34 |
BE30 |
33 |
L2T |
5,7 |
sf34 |
PAY3 |
31 |
L2T |
5,1 |
sf34 |
A748 |
29 |
L2T |
12,1 |
sf34 |
AN26 |
28 |
L2T |
21 |
f50 |
SC7 |
28 |
L2T |
5,7 |
sf34 |
MU2 |
24 |
L2T |
4,1 |
sf34 |
E110 |
23 |
L2T |
5,7 |
sf34 |
BE9T |
21 |
L2T |
4,2 |
sf34 |
C425 |
21 |
L2T |
3,7 |
sf34 |
AN24 |
15 |
L2T |
21 |
f50 |
N262 |
13 |
L2T |
10,7 |
sf34 |
C212 |
12 |
L2T |
6,3 |
sf34 |
G222 |
10 |
L2T |
20 |
f50 |
F60 |
9 |
L2T |
20 |
f50 |
BE10 |
8 |
L2T |
5,4 |
sf34 |
DHC8 |
8 |
L2T |
27,3 |
f50 |
C160 |
7 |
L2T |
20 |
f50 |
DHC6 |
7 |
L2T |
4,8 |
sf34 |
C441 |
6 |
L2T |
3,7 |
sf34 |
D328 |
4 |
L2T |
14 |
sf34 |
SB20 |
4 |
L2T |
22,8 |
f50 |
E121 |
3 |
L2T |
5 |
sf34 |
P180 |
3 |
L2T |
5 |
sf34 |
P68T |
3 |
L2T |
5 |
sf34 |
AN28 |
2 |
L2T |
6,5 |
sf34 |
ATLA |
2 |
L2T |
20 |
f50 |
CN35 |
2 |
L2T |
20 |
f50 |
G159 |
2 |
L2T |
20 |
f50 |
SW2 |
2 |
L2T |
5 |
sf34 |
STAR |
1 |
L2T |
5 |
sf34 |
C130 |
225 |
L4T |
70,3 |
ea320 |
P3 |
14 |
L4T |
63 |
md81 |
IL18 |
2 |
L4T |
64 |
md81 |
L188 |
2 |
L4T |
52,7 |
l188 |
Total |
20830 |
|
|
|
No. of flights from other Danish airports bound for Greenland
ICAO-code |
No. of LTO's |
Category |
MTOW |
Rep. Type |
GULF |
17 |
L2J |
31,6 |
f50 |
CL60 |
2 |
L2J |
18 |
f50 |
B73B |
1 |
L2J |
63 |
b737 |
B767 |
1 |
L2J |
182 |
b767 |
FA20 |
1 |
L2J |
13 |
sf34 |
FA50 |
6 |
L3J |
17,6 |
f50 |
B707 |
1 |
L4J |
117 |
b757 |
C130 |
9 |
L4T |
70,3 |
ea320 |
Total |
38 |
|
|
|
No. of flights from other Danish airports bound for Faroe Islands
ICAO-code |
No. of LTO's |
Category |
MTOW |
Rep. Type |
B73B |
116 |
L2J |
63 |
b737 |
GULF |
5 |
L2J |
31,6 |
f50 |
C500 |
4 |
L2J |
5,2 |
sf34 |
BA46 |
35 |
L4J |
42 |
ba46 |
C130 |
10 |
L4T |
70,3 |
ea320 |
Total |
170 |
|
|
|
Appendix 6
Danish domestic fuel use and emissions from TEMA