Water Prices in CEE and CIS Countries. Volume II: Case Studies
Chapter 5.
Willingness to pay
5.1 Introduction
The objective of this chapter is to present the methodology applied and the results of the stated preference survey.
The methodology comprises a number of steps. These include background research, qualitative research and quantitative research. Each of the steps is discussed in the section on methodology.
The quantitative research is based on interviews with 150 consumers living in Poznan and being responsible for paying the household water bill.
In order to assess the willingness to pay a stated preference approach has been used, and the results indicate some willingness to pay. There is willingness to pay both to avoid a worsening and to obtain improvements of present services.
5.2 Stated preference survey methodology
The method applied in this stated preference survey contains a number of tasks. These include:
- Background research;
- Qualitative research;
- Design of questionnaire;
- Pilot survey;
- Final survey;
- Data analysis.
Each of the points are discussed below.
5.2.1 Background researchThe first step in the analyses is background research. The purposes of the background research are to:
| Understand the realistic technical options/alternatives and in particular their impact on realistic service levels; | |
| understand payment collection, enforcement and usage measuring principles and practices, and the financial standing of the utility; | |
| understand the socio-economic context, in particular income levels and distribution and types of households. |
The background research have also included:
5.2.2 Qualitative research
![]()
Discussions with other team members covering technical and financial issues; ![]()
consultation of earlier reports, statistics, working papers giving general introduction
to the utility and the local economy in Poznan.
Following the background research, qualitative research amongst customers is undertaken. The purposes of the qualitative research are to:
| Gain a first understanding of which service factors are perceived as important by customers, and which factors are the more important; | |
| gain a first rough understanding of willingness to pay for water and waste water services and the most important factors; | |
| understand the cultural context and wordings/formulations understood by consumers in relation to water and waste water utilities. |
Two types of interviews were carried out in Poznan. Six face-to-face interviews and one focus group with six respondents. An open-ended topic guide was applied in both types of interviews.
The face-to-face interviews were conducted in an interview room. Two interviewers interviewed each respondent with consecutive translation by a professional interpreter. Each interview lasted between 30 minutes and 50 minutes.
The focus group was carried out with simultaneous translation when respondents were speaking and consecutive translation when the moderator was speaking. There was one moderator supported by an assistant moderator. The focus group was taped on video. The focus group lasted about 2 hours and 15 minutes.
The qualitative research is critical, as the outputs form the limitations to what is going to be explored during the quantitative research.
5.2.3 Design of questionnaireOn the basis of the information gathered in the background research and the qualitative work the questionnaire is designed. The questionnaire includes:
| present water and wastewater services; | |
| attitude toward the water services; | |
| willingness to pay for improvements and to avoid a worsening; | |
| socio-economic background. |
Many subjects can be covered by a questionnaire. However, a selection has to be made in order to keep the length of an interview acceptable to the respondent. Therefore e.g. wastewater treatment has not been covered in depth in the research for Poznan.
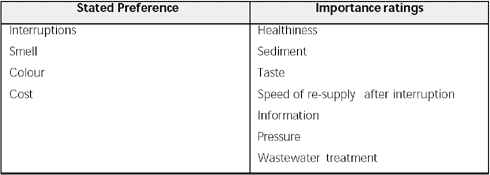
A long list of possible improvements to and worsening of the water services was identified in the qualitative research. The possible changes in service levels are divided into three groups. The most important services are included in a stated preference game as described below, but only a limited number of services can be evaluated in the stated preference game. Importance-rating questions are included in the questionnaire to have the respondents' evaluation of other services. Finally, some possible changes of service levels were assessed to be of minor relevance/importance and they have not been included in the questionnaire.
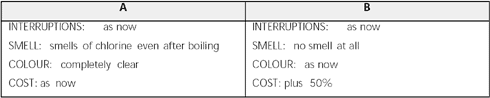
The willingness to pay is examined by using stated preference games. An example of a choice task in the stated preference game is presented in Table 5.1. Here the respondent must decide whether they would prefer to pay 50% more to have water without any smell at all, or whether they would prefer to have completely clear water with a chlorine smell and pay the same amount as at present. If smell is an important issue to the respondent B is preferred, if clear water and/or money saving is important to the respondent A is preferred.
Table 5.1:
Example of a choice pair
A number of choice-tasks, such as the above, are presented to each respondent. There is a limit to the number of choices a respondent can make while remaining concentrated and while still presenting a realistic choice.
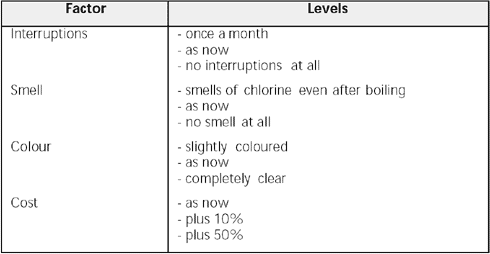
The stated preference game consists of four factors:
| Interruptions; | |
| Smell; | |
| Colour; | |
| Cost. |
The stated preference analysis explores both the willingness to pay for improvements and the willingness to pay to avoid worsening. Three levels represent each of the factors. The levels describe different service levels and they are the service levels that can be evaluated when analysing the game. For the service factors the first level is a worsening, the second status quo, and the third is an improvement. The costs only increase in comparison to the present situation.
Table 5.2:
Factor and levels in the stated preference game
5.2.4 Pilot survey
The pilot survey is used to test the design of the questionnaire and to identify necessary changes. In Poznan, 25 interviews were conducted and the results were analysed. The answers are checked in order to ensure that all questions are well understood and that the stated preference game was working well. Checking the stated preference games includes assessing if all parameters are relevant to the consumers, and if the levels of e.g. cost are perceived to be within realistic limits. As an example if respondents choose alternatives with the lowest cost in most stated preference questions the cost levels should be adjusted downward.
In the pilot, the respondents were presented with 12 choice-tasks, and in the final the number of choice-tasks was reduced to eight. In this stated preference game, eight choice-tasks are within the capabilities of the respondent, while 12 choices were too many. In other applications, eg with a shorter total questionnaire, the number of choices can be higher without incurring problems.
5.2.5 Final surveyIncluding the changes to the questionnaire from the pilot survey the final questionnaire was made. 125 respondents where chosen at random and interviewed. However, only respondents responsible for paying the water bill were interviewed.
5.2.6 Data analysisBoth the data from the pilot questionnaire and the data from final questionnaire is included in the statistical analysis. This is possible because only few changes were made to the pilot questionnaire. However, where questions differ in the two versions the results from the pilot questionnaire are excluded.
The stated preference data is analysed by applying advanced statistical tools. A so-called logit model is estimated. Before estimating the model a set of a priori hypotheses is described and these are tested in the model. Examples of such a priori hypotheses are:
| consumers with higher income have a higher willingness to pay; | |
| consumers with a water meter have a higher willingness to pay because they are able to adjust consumption as a response to an increase in tariffs. |
The model also allows for different willingness to pay for consumers with different backgrounds, e.g. age and gender. For age and gender the model process is exploratory, that is no priori hypotheses are needed. However, all effects in the model must have a clear interpretation.
In order to ensure that the sample is representative, it is tested whether the age and gender distribution in the sample differs from the distribution in the Poznan region. Census data from 1996 on urban inhabitants is used. The test indicates that some groups are over represented in the sample, and therefore all results are weighted by age and gender. By weighting with the age and gender distribution of entire population, it is assumed that all groups are equally responsible for paying the water bill. Hence, the results can be interpreted as representative.
5.3 Qualitative researchThe qualitative interviews were based on a topic guide prepared using background information about Poznan including information from the technical part of the team.
Respondents were selected by random. The respondents covered a large variety of age, household size, income and employment status. Also, respondents from different districts of Poznan were included. However, there was an over-representing of respondents with higher education. In general, the target should be to have all groups of the population represented.
Results from the qualitative work
A wide variety of subjects were discussed.
Water quality
The tap water is perceived as undrinkable. The interviewees boil the water before using and buying bottled water is normal. Few of the interviewees have water filters installed. The interviewees mentioned the following problems with service: Pressure, chlorine taste, bad taste, sediments, and rust. Several of the interviewees have experienced service interruptions.
The interviewees did not receive information from PWiK on water services. Some of the interviewees obtain limited information on the water services through local media.
Water consumption and metering
Metering is common and most of the consumers interviewed in the qualitative research have individual metering and some pay per head in the household. However, PWiK does not manage the individual meters in a block of flats.
Some of the interviewees have undertaken measures to reduce consumption. However, saving water was not a key issue.
Water cost
The interviewees were aware of how much their normal monthly payment is but were not aware of the unit costs. Some of them thought water and wastewater services had increased in price at the same rate as other prices, but some thought there have been no increase for water services the last two years. Prices for gas and electricity and petrol were in general perceived to have increased much more.
The respondents in the qualitative research would pay for better quality of tap water, but they would probably continue to buy bottled water and continue to boil water for drinking. People would in general not accept lower prices with lower service. This could indicate that there is still some willingness to pay. In the group, there was some resistance against tariff increases. However, this is a natural "defensive" reaction by respondents when prompted directly about price increases.
Table 5.3:
Subjects discussed in the qualitative research included in the stated preference game
and the importance ratings.
5.4 Quantitative research
In this section the results of the questionnaire are presented. The socioeconomic characteristics of the respondents are analysed in order to see if all groups of respondents are represented in the sample. However, the respondents in the sample are all responsible for paying the water bill.
The results from the questionnaire indicate that the consumers are quite positive towards the water services in Poznan but only few drink the water straight from the tap. There is some willingness to pay for improved service and for some aspects an even higher willingness to pay to avoid a worsening.
5.4.1 Socio-economic characteristicsThere is an overrepresentation of women in the sample. 63% of the respondents are women. In Poznan women are also over represented - 53% of the inhabitants in Poznan are women.
The age distribution is illustrated in Figure 5.1. All age groups are represented among the respondents.
The age and gender distribution is compared to the age distribution of urban part of the Poznan region in 1996 (population 960.859). There is no general overrepresentation of e.g. young people or retired people, cf. Figure 5.1. However, e.g. males between 35 and 44 years of age are underrepresented, while women between 45 and 60 are over represented. To make the results of the analysis representative the observations have been weighted to reflect the population in the region.
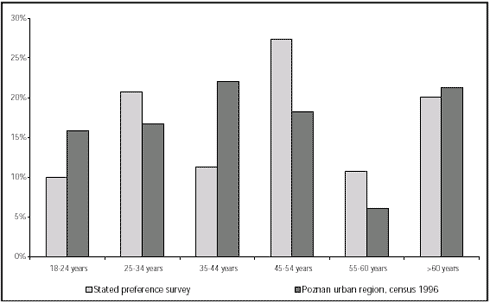
Figure 5.1:
Age distribution of respondents
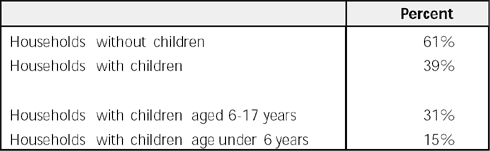
Most of the respondents do not have children living in the household. In 31% of the households there are children aged 6 to 17 years, and in 15% of the households there are infants less than 6 years old, cf. Table 5.4. Most of the households with children have only one child living in the household.
Table 5.4:
Type of household
Note: The data is not weighted.
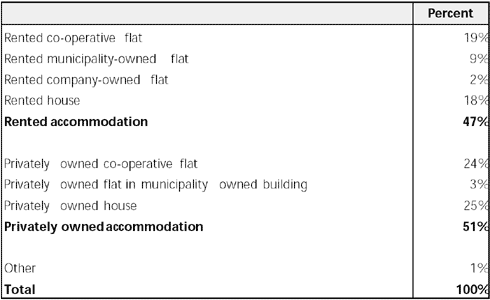
The households are equally divided into respondents living in rented accommodation and privately owned accommodation, cf. Table 5.5. More than half of the respondents live in flats.
Table 5.5:
Type of accommodation
Note: The data is not weighted.
A majority of the respondents are employed, both in the public sector and the private sector as well as self-employed. No farmers are represented in the sample, cf. Figure 5.2.
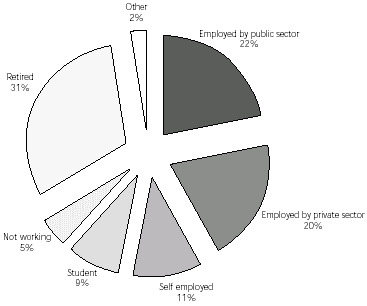
Figure 5.2:
Employment status of the chief earner of the household
Note: The data is not weighted.
The distribution of the monthly household income after tax is illustrated in Figure 5.3. Most of the households have an income between 500 and 2,000 PLN. One fifth of the respondents did not wish to state their income.
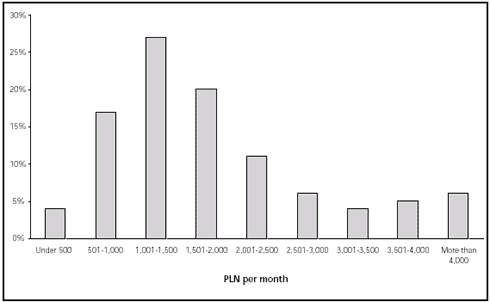
Figure 5.3:
Household income distribution
Note: The distribution in the table is based on 100 households; 26 respondent refused to state their income and the pilot data is omitted because of a different categorisation. The data is not weighted.
5.4.2 Water and Wastewater services
The results presented in the rest of this chapter are weighted to reflect the age and gender distribution in Poznan. As basis for the weights, the urban population in the Poznan region is used (population: 960.859). By weighting the observations, the results reflect the entire population in Poznan. However, there are only minor differences between the weighted results and the unweighted results.
Payment
The consumption on water is likely to be affected by the way consumers are billed. If consumers are billed according to the amount of water consumed they are more likely to reduce water consumption as a result of an increase in prices.
Two thirds of the respondents interviewed have their own household meter for cold water. 10% of the respondents have a meter for the block of flats where they live, and 19% have no meter at all. Almost all households with meter are billed according to the consumption.
More than one fourth of the households pay the water bill directly to PWiK, cf. Figure 5.4. Almost all households living in their own private house pay directly to the PWiK. The rest of the households pay to administration, co-operative, landlord etc.
People living in households not paying directly to PWiK are not interested in doing so; 12% of all households would like to pay to the PWiK.
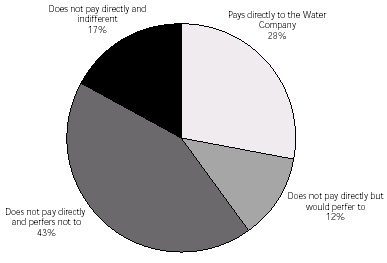
Figure 5.4:
Payment of water bill
Note: The data is weighted by the aged and gender distribution of the Poznan urban region, census 1996.
One third of the consumers in the sample pay the water bill with other items that is especially the consumers not paying directly to PWiK. Consumers living in privately owned house pay the bill separately.
20% of all households know the water company PWiK. The knowledge of the name of the company is highest among the consumers paying directly to the company. Among the consumers paying their bills somewhere else only 10 percent know the name of the water company.
The distribution of the amount paid for water services is illustrated in Figure 5.5. The average amount spend on water services is 43 PLN per month and it is increasing with the number of people in the household, especially children.
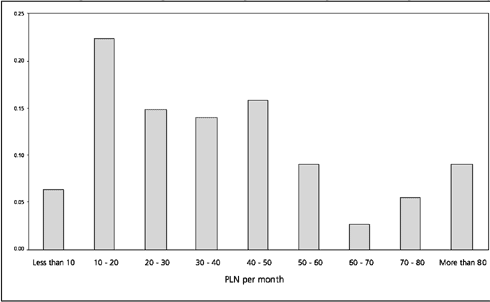
Figure 5.5:
Household payments for cold water services
Note: The figure is based on 141 consumers. 9 consumers were not able state the amount paid. 51 respondents gave estimate on water bill, 90 respondents brought their water bills to the interview. The data is weighted by the age and gender distribution of the Poznan urban region, census 1996.
On average around 3% of the household income after tax are spent on water services, but the percentage varies between different income groups, cf. Figure 5.6. 17% of the households pay more than 5% of the income.
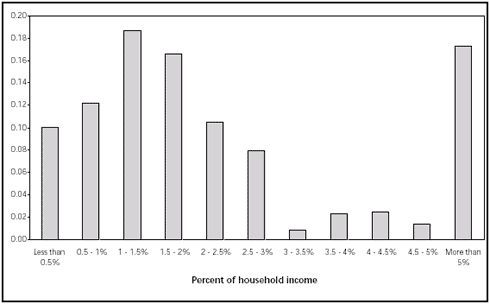
Figure 5.6:
Water bill as a percentage of the household income after tax
Note: The figure is based on 114 consumers. The data is weighted by the age and gender distribution of the Poznan urban region, census 1996.
The average household consumption of water is ca. 11 m3 per month. This is equivalent to between 3 and 4 m3 water per member of household. More than half of the consumers has not changed the water consumption the last two years. One fourth have increased the water consumption mostly because a change in the number of members of the household and for reasons like garden watering and the children getting older.
12% of the households have decreased the water consumption. More than half of these respondents give money saving as the reason for the decrease and some consumers have reduced their consumption after having a water meter installed. None has reduced the water consumption for environmental reasons.
A majority of the consumers do not find themselves able to reduce water consumption. The consumers able to reduce water consumption will do it e.g. by using less water when they wash the dishes and by watering the garden less often.
Quite few consumers are aware of the increases in water tariffs within the last two years. One out if six gives their opinion about the increases and they vary from a 15% to a 100% increase.
Compared to other utilities fewer consumers find that the cold-water services and wastewater services is not worth the money. However, 40%of the consumers think that the cold-water services and wastewater services is not worth the money at present, cf. Figure 5.7.
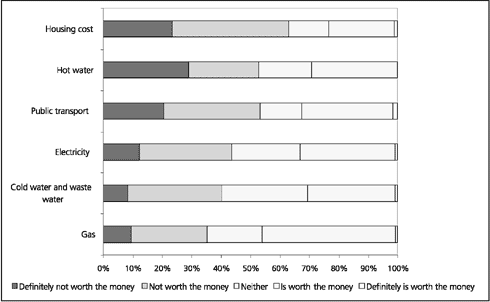
Figure 5.7:
Rating of services in terms of the money paid for the services
Note: Not all of the services are relevant to all respondents. This applies especially to hot water, public transport and housing cost (consumers who have their own private house do not find the question applicable). The data is weighted by the age and gender distribution of the Poznan urban region, census 1996.
Quality of water services
The consumers are divided in equally sized groups in the question of water quality, cf. Figure 5.8. Almost 40% of the consumers find that the water quality is neither good nor bad. Most consumers have not experienced a change in the water quality within the last few years. 13% think that water quality has improved at 8% find that water quality has worsened.
The consumers have less knowledge about the standard of wastewater treatment. A large proportion does not know the standard of wastewater treatment, and there is the same number of consumers finding the wastewater treatment poor as finding the wastewater treatment good. 86% of the consumers are not aware of a change in the wastewater treatment within the last few years, and the last 14% have experienced an improvement.
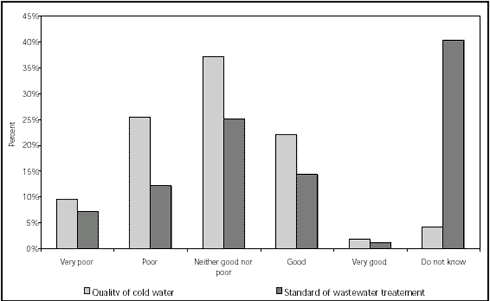
Figure 5.8:
Rating of the quality of cold water and the standard of wastewater treatment
Note: The data is weighted by the age and gender distribution of the Poznan urban region, census 1996.
Few consumers drink the water straight from the tap, cf. Figure 5.9. Compared to the number of household that does not drink the water straight from the tap, the overall rating of the water quality is quite positive. The most important reasons for not drinking the water straight from the tap are:
| healthiness/pollution of the water, 54% | |
| taste, 24 % | |
| habit, 15 % | |
| smell, 3 % | |
| colour, 2 % |
There is a large proportion referring to healthiness and pollution as the reason for not drinking the water straight from the tap, and these are aspects not easily monitored by the consumers. Hence, the perception that the water is unhealthy might also be due to habits. If the water is healthy to drink as most tests indicate, cf. Chapter 3, there is a need to inform the consumers that the water is actually drinkable.
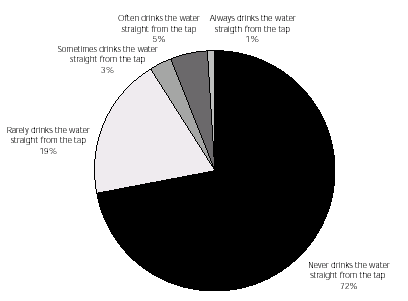
Figure 5.9:
Drink tap water straight from the tap
Note: The data is weighted by the age and gender distribution of the Poznan urban region, census 1996.
Instead of drinking the water straight from the tap 85 % of the households buy bottled water. Each household buys almost 7 litres per week on average. Only few households have a water filter; 8% have a separate small container to filter the water, and 4% have a filter in the pipe.
Most consumers are very satisfied with the water pressure. The quality of the water in terms of colour and smell is also not rated poor by a lot of respondents, cf. Figure 5.10. On the other hand the consumers are dissatisfied with the healthiness and the sediment in the water.
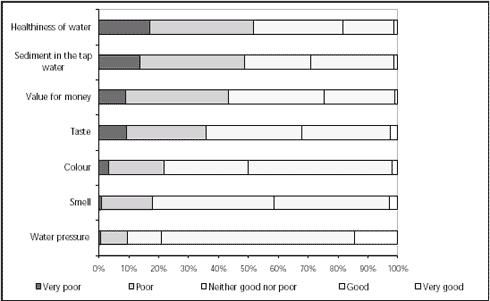
Figure 5.10:
Rating of various aspects of the water quality
Note: Between 1% and 5% were not able to rate the quality aspects. The data is weighted by the age and gender distribution of the Poznan urban region, census 1996.
Consumers are quite satisfied with the frequency of interruptions and also the speed of resupply after an interruption, cf. Figure 5.11. Hence the frequency of interruptions is not a matter a large proportion of the consumers find important to improve.
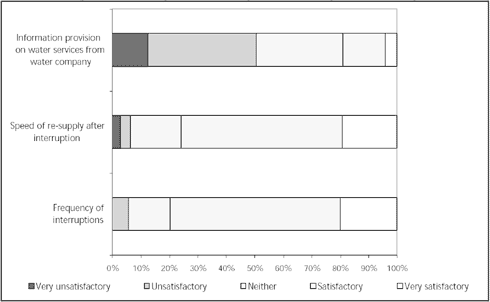
Figure 5.11:
Satisfaction with information provision and the speed of re-supply after interruption
Note: Between 1% and 5% were not able to rate the quality aspects. The data is weighted by the age and gender distribution of the Poznan urban region, census 1996.
There is more dissatisfaction concerning information provision from PWiK. Less than one third receives information about the water services. Those consumers that do get information are primarily obtaining the information from local newspapers, radio and television. Hardly any consumers receive information from PWiK.
5.4.3 Willingness to pay for water servicesAlthough few consumers drink the water directly from the tap not all consumers think water services should be improved - that is if improvements are accompanied with an increase in the cost. On the other hand only 3% think that water charges and water services should be decreased, cf. Figure 5.12. 49% of the consumers think that charges should be increased and quality should be improved.
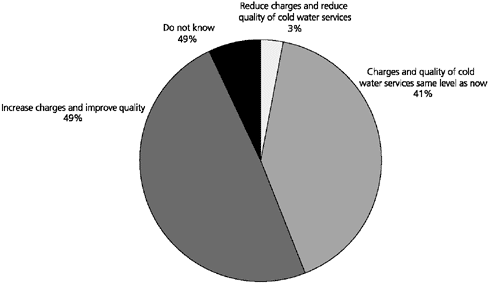
Figure 5.12:
Preferred strategy concerning water services and water charges
Note: The data is weighted by the age and gender distribution of the Poznan urban region, census 1996.
Reasons given for not improving water quality and increasing water charges are e.g. that consumers find that charges are already too high (24 %), and that the consumers find that they are not able to pay more (16 %).
Stated preference analysis
The stated preference analysis is exploring both the willingness to pay for improvements and the willingness to pay to avoid worsening. Factors included in the analysis are:
| Interruptions; | |
| Colour; | |
| Smell. |
The purpose of the analysis is to find the willingness to pay for improvements or to avoid a worsening of these factors.
Unplanned interruptions are included because a lack of investment might imply an increasing number of interruptions and therefore it is relevant to assess the willingness to pay to avoid interruptions. However, it should be noted that the average age of water supply pipes is reasonably young and current level of interruptions is better than most cities in the region.
Two possible changes in the frequency of interruptions are included in the analysis:
| Monthly unplanned interruptions; | |
| No unplanned interruptions at all. |
Colour and smell are included in the analysis because the qualitative work indicated that these are important parameters to the respondents. As for interruptions two changes are included in the analysis, a worsening of the colour and an improvement:
| The water is slightly coloured; | |
| The water is always completely clear. |
Finally smell is represented by the changes:
| The cold water has no smell at all; | |
| The cold water smells of chlorine even after boiling. |
The average willingness to pay for the interruption changes is illustrated in Figure 5.13. The willingness to pay is reported in PLN per cubic meter.
There is no measurable willingness to pay to avoid monthly, unplanned interruptions. On the other hand there is a willingness to pay to have no interruptions at all. The respondents are on average willing to pay 12% of the current average cost per cubic meter.
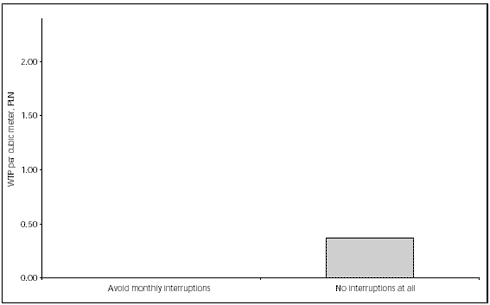
Figure 5.13:
Average willingness to pay to avoid monthly interruptions, and to have no
interruptions at all
Note: The data is weighted by the age and gender distribution of the Poznan urban region, census 1996.
Interruptions are rather infrequent at present, e.g. the frequency is lower than in Brno and in most CIS countries. So the consumers might have difficulties in eva-luating the disutility of a monthly interruption.
In terms of willingness to accept higher tariffs, avoidance of more frequent interruptions does not seem to be an argument that is appreciated by the consumers.
The highest willingness to pay is to avoid a smell of chlorine in the cold water; the consumers are willing to pay 64% more to avoid the chlorine smell. The willingness to pay to have water with no smell at all is insignificant but positive. This indicates that the consumers find that the smell of the water is very good at present, cf. Figure 5.14.
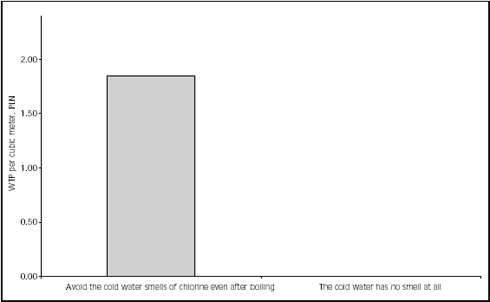
Figure 5.14:
Average willingness to pay to avoid that the cold water smells of chlorine even after
boiling, and the cold water has no smell at all
Note: The data is weighted by the age and gender distribution of the Poznan urban region, census 1996.
The water is chlorinated at present. The result here indicates that the consumers are not heavily dissatisfied with the present smell of the water, but that consumers would be willing to pay higher tariffs to avoid even more chlorine in the cold water.
If an investment in water services makes it possible to avoid using more chlorine consumers are willing to accept higher tariffs.
The consumers are willing to pay both to avoid the water getting slightly coloured (with traces of rust) and to have the water completely clear. This indicates that the water is not perceived completely clear at present and that the water is not slightly coloured. The consumers are on average willing to pay 41% more on the monthly bill to avoid that the water gets slightly coloured, and they are willing to pay 24% more to have completely clear cold water.
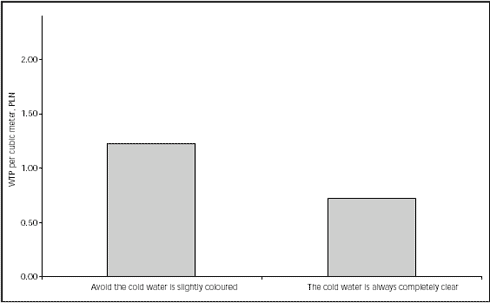
Figure 5.15:
Average willingness to pay to avoid that the cold water is slightly coloured, and the
cold water is completely clear
Note: The data is weighted by the age and gender distribution of the Poznan urban region, census 1996.
Improvements to the colour of the water can be appreciated as an argument for increasing tariffs in Poznan. Also, avoiding that the colour of the water gets stronger can generate some willingness to pay.
The willingness to pay varies somewhat between age groups and between income groups. The consumers are divided into two income groups based on the household income per member of household:
| Consumers with income in the lowest quartile (25%). That is less than 375 PLN/capita monthly; | |
| Consumers with income above the lowest quartile. |
The willingness to pay as a percentage of the present water cost is given in Table 5.6.
Table 5.6:
Willingness to pay for improvement and to avoid worsening. Increase in current
payments
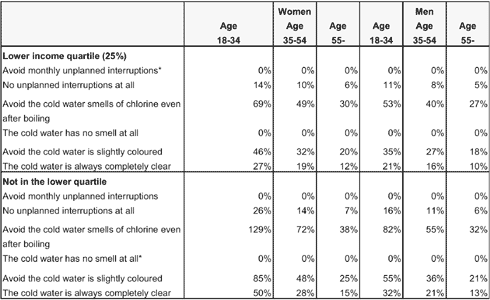
Note: * represents that the effect is not significantly different from zero. The data is weighted by the age and gender distribution of the Poznan urban region, census 1996.
Consumers with a low income per member of household are in general willing to pay less than consumers with a higher income. For instance, the willingness to pay to avoid the chlorine smell varies between 27 and 69% extra for consumers in the lowest quartile and between 32 and 129% extra for rest of the consumers. The variations depend on age and gender.
Young consumers are in general willing to pay more for the water services than older consumers are. When seeking acceptability of the water tariffs special attention should be given to make consumers above 55 years accept the increasing charges. Also, the willingness to pay is in general higher for women than for men.
Various hypotheses that did not lead to an affirmative conclusion were explored during the data analysis. These are:
| Consumers with income in the highest quartile (75%) do not have a willingness to pay that exceed the willingness to pay among other consumers above the 25% quartile; | |
| A different willingness to pay depending on if the water bill is based on consumption or not. Consumers having the water bill based on consumption were expected to have a higher willingness to pay because they are able to adjust the consumption but this is not the case; | |
| Households with children are not in general willing to pay more for better water services than households without. But there is some evidence in the sample that people with infants are willing to pay more in order to get improved services. However, this effect is omitted due to the low number of respondents with infants. |
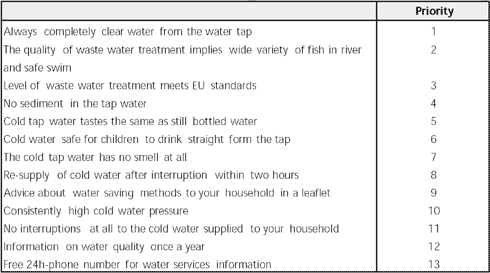
Importance ratings
The willingness to pay for changes in the services can be compared to the importance ratings of other items. This is possible because some of the service improvements included in the stated preference game are included in the importance ratings as well.
The respondent was asked to rate the items on a scale from "very important" to "very unimportant". In order to compare the results, an index was calculated from the importance ratings. The values of the index give a priority of the items, cf. Table 5.7.
Completely clear water is the most important improvement. This indicates that the consumers are willing to pay less that 24% extra for each of the other service improvements in the table. Having no unplanned interruptions at all is prioritised no. 11. This indicates that consumers are willing to pay less than 12% extra in average for the service improvements at priority 12-13.
Table 5.7:
Priority of service improvements
Note: The data is weighted by the age and gender distribution of the Poznan urban region, census 1996.
There are two environmental aspects in the table and they are prioritised second and third. Although respondents can find an improvement important without being willing to pay for it the results indicate a willingness to pay for better wastewater treatment. Therefore environmental improvements can be used as an argument for increasing tariffs5.
Also, no sediment in the tap water is a possible improvement that will enhance the acceptability of an increase in water tariffs.
Uncertainty
The results of the stated preference analysis are statistically uncertain. In order to illustrate the uncertainty a confidence interval is calculated for the willingness to pay to avoid chlorine smell of the water. This is the willingness to pay that is estimated with the best precision. The confidence interval is calculated for men aged between 34 and 44 in the income group with an income above the lower quantile, cf. Figure 5.16.
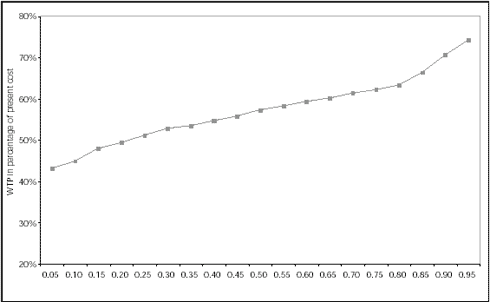
Figure 5.16:
Confidence interval for the willingness to pay to avoid the water smells of chlorine
even after boiling, males with income higher than 25% quantile, 35-44 years old.
The willingness to pay varies within 45%and a good 75%in a 90% confidence interval. This illustrates that while the magnitude of the result is reasonable the exact figure is quite uncertain.
Finance
Finally, the consumers were asked if they prefer an increase in water charges up front or they prefer an increase water charges that is implemented over five years. The options are:
| Full 20% increase next year and no further increase for the next four years; | |
| 7% increase year on year for the next five years. |
The consumers are divided equally between the two options. 46% prefer the full increase upfront, while 52% prefer the more slow adjustment of prices. The consumers preferring the full increase up front have a higher average household income.
5.4.4 Market study on water and wastewater by AnkieterThe market research company Ankieter conducted a study on water and wastewater services in Poznan and surrounding municipalities in 1999. In total 999 interviews were conducted, 802 in Poznan and 127 in the surrounding municipalities.
The results from the Ankieter report do not differ substantially from the research presented in this report. The results for Poznan were:
| 72% of the household pay based on consumption. In the stated preference sample used in this report 67% pay based on consumption. | |
| 20% of the respondent do know the actual tariffs for water (1.47 PLN) and wastewater (1.55 PLN). A majority of the respondents find wa-ter tariffs are too high. | |
| Most consumers think that households should economise on water usage, and most respondents find that the current tariffs make them economise on water usage. | |
| 79% of the households never drinks the water but most households use tap water for tea and coffee, etc. In the sample used in this report 72% never drink the water straight form the tap. | |
| Among the four items taste, smell, colour, and pressure, taste is found the most unsatisfactory, smell is the second most unsatisfactory and colour third most unsatisfactory - respondent are quite satisfied with the pressure. In the sample used in this report the taste of tap water is also found poorest of the four, but not the most important to improve. | |
| 39% of the respondents have had at least one interruption of the water supply during the last 12 month - most consumers find interruptions onerous. | |
| A majority does not know how wastewater is treated, but 72% think that authorities should spend more on wastewater treatment. In this report it is found that to improve the environment is also very important. |
There are a lot of common results when comparing the results of the research by Ankieter and the results in this report. So the main conclusions of this report are supported by the report by Ankieter.
5.5 Conclusions on market researchThe consumers in Poznan are not, in general, dissatisfied with either the cold water quality or the standard of wastewater treatment. However, few consumers drink the water straight from the tap, and almost half of the interviewed respondents are willing to pay higher tariffs to improve quality. Quite few prefer a worsening combined with lower tariffs.
The consumers find healthiness of the water poor and there is a willingness to pay for improving the colour of the water and a decrease in the frequency of interruption, although the consumers are not unsatisfied with the present situation.
The willingness to pay to avoid a worsening of the present water quality is higher than the willingness to pay for an improvement. In particular, this applies to the colour of the water and the chlorine smell. This indicates that consumers are willing to accept higher water tariffs if a worsening of the water quality can be avoided.
The willingness to pay varies between different income and age groups. The higher income the higher willingness to pay, and the group of respondents more than 55 years of age are not willing to pay as much as the younger consumers.
The following policy guidelines can be derived from the analysis:
| Significant WTP to avoid decreasing quality; | |
| WTP is not fully exploited; | |
| Avoid smelling water is very important argument for price increases; | |
| Avoid unclear water is very important argument for price increases; | |
| Environment is an argument for price increases (for waste water services); | |
| Information level is considered low; | |
| Different information approaches for different age groups; and | |
| Metering will not increase WTP. |
Qualitative research
| Both the focus group and in-depth interviews worked well and did provide valuable information about the water services in Poznan. The tested translation concept worked well and this is important, especially in the focus group. |
Quantitative research
| The stated preference method worked well. The consumers understood the trade-offs and chose logically. | |
| It was not possible to identify a willingness to pay to avoid a worsening of the frequency of interruptions. The reason might be that most consumers are not familiar with the consequences of an unplanned interruption. It is important that all factors and levels of the game should be easy to understand and evaluate for the consumers. | |
| The sampling and interviews worked well. The method of conducting the interviews is very important to the quality of the results. Therefore the research aspect is dependent on good local counterparts. | |
| When deciding on the number of observations, a trade off between number of interviews and precision is made. If more respondents are interviewed more precise estimates can be estimated and the modelling procedure becomes easier. |
| 5 | The willingness to pay for a less polluted environment is examined in depth in a parallel study for Brno. |