Indicator Report
9. Food production, food safety, agriculture and fisheries
| 9.1 | Food safety |
| 9.2 | Agriculture |
| 9.3 | Fisheries |
Objectives
The objective for food production in Denmark is to ensure that the food produced and sold to consumers is healthy and of high quality and that the level of information on food is high. Production methods that preserve the resource basis of the agricultural and fisheries sectors and secure the environment, nature, animal welfare and good working conditions must be promoted. Simultaneously, cost-effective production and marketing should be promoted in the foodproducing sectors.
Sustainable development of food production requires the right legislative framework, visionary utilisation and development of technological possibilities, and constructive interplay between the authorities, industry, and the public.
The Danish Government regards it as important that assessment of safety and risk in relation to food must be based on the precautionary principle in situations where scientifically based suspicions exist, but where a sufficient scientific basis for confirming or refuting such suspicions is not yet available.
Agricultural production must contribute to sustainable development and to life in rural districts. At the same time, terrestrial and marine biodiversity must be ensured. Agricultural development must be a balanced interplay between the environment, nature, and the local community.
The fisheries sector depends on fish stocks remaining a renewable natural resource. Sustainable fishing that helps safeguard marine fish populations and ecosystems will also contribute to the sector's future development.
Developments - a summary
The total number of food-related cases of illness in Denmark has increased constantly since 1990, from approximately 4,300 registered cases in 1990 to approximately 8,000 in 2001. Until 1999, salmonella was the most frequent cause of food-related illness. The year 1999 was, however, the first year ever where more incidences of illness caused by campylobacter than salmonella were registered. Various monitoring schemes and action plans have been initiated in order to obtain a high level of food safety.
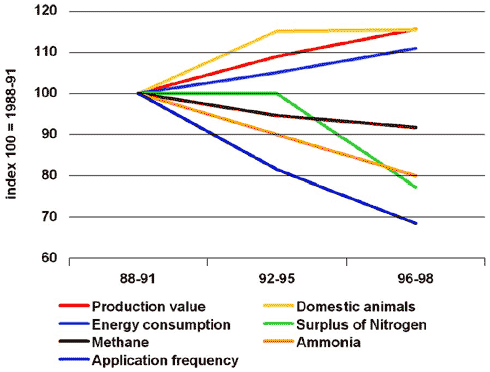
In total, a number of environmental impacts from agriculture have been reduced in the last ten years. At the same time, production value within the agricultural sector has grown by 20 per cent from 1988 to 1998. This is to say that there has been economic growth without a corresponding increase in environmental impacts. Energy consumption within agriculture has increased almost as much as the production value. The number of farm animals per hectare farmland (livestock) has risen from 1.07 to 1.23. Agricultural emissions of ammonia, which may cause acidification and excessive nutrient contents in natural areas, are down by 20 per cent, but further reductions are needed in order to meet the targets.
The agricultural sector uses nitrogen and phosphorus in the form of e.g. commercial fertilisers and livestock manure. Some of these nutrients are bound up in animal production and crops. The remaining materials are known as surplus nutrients. Surplus nitrogen and phosphorus from agricultural production can have a negative impact on nature and the environment. During the period 1985 to 1999, the total nitrogen surplus within the agricultural sector fell by approximately 24 per cent, while the total phosphorus surplus fell by approximately 36 per cent. Following an adjustment (in 2000) of the initiatives already implemented, it is expected that the objectives of the Action Plans for the Aquatic Environment I and II, which were launched in order to reduce the nitrogen surplus, will be reached in 2003. Opportunities for limiting agricultural discharges of phosphorus will also be addressed in connection with the preparation of the Action Plan for the Aquatic Environment III.
Green accounts within agriculture raises awareness on resource consumption in day-to-day operation. Subsidies for green accounts were introduced in 2001, and approximately 340 farms were granted a subsidy. Simply by virtue of the areas covered by the green accounts, these accounts entail considerable improvements in the consumption of input factors which are relevant in connection with the Action Plan for the Aquatic Environment II and the Pesticides Reduction Action Plan.
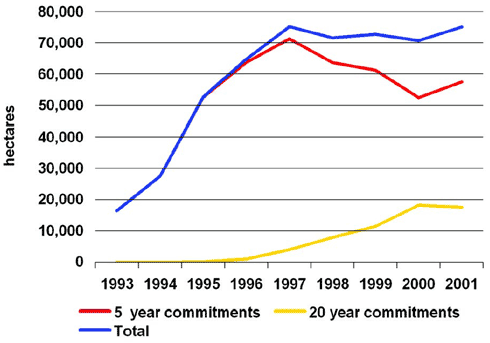
The extent of agro-environmental schemes (MVJ) has increased since 1993. Since 1997, the scheme seems to have become stabilised around 75,000 hectares. The scheme is currently being adjusted, with the adjustments taking effect from 2003. The objective is to make it more attractive, thereby ensuring that even larger areas fall within the scheme. The actual area covered is directly related to the concrete effect in the form of reduction of discharges of nitrogen from agriculture.
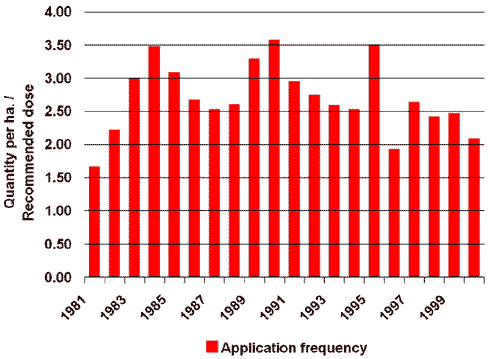
The treatment frequency constitutes a measure of how many times a year the total agricultural area of a given country can be treated with the amount of pesticides sold if these pesticides are used in the standard doses recommended.
The treatment frequency peaked in the early 1990s, but has shown a decreasing tendency since then. In the early 1990s, the treatment frequency was approximately 3, which is to say that farmers treated their fields with pesticides three times a year. The Pesticides Reduction Action Plan II calls for a treatment frequency of less than two before the end of 2002. This target was almost met in 2000, where the treatment frequency was 2.0. After 2002, a new objective will be established to reduce application frequency even further.
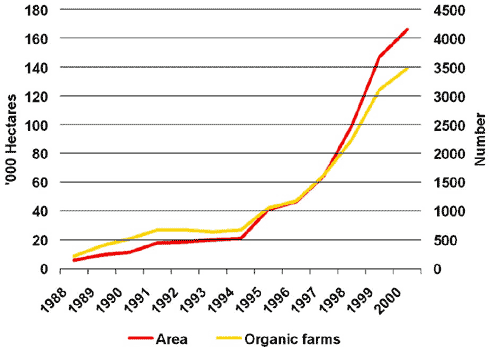
The number of authorised organic farms has increased, particularly from 1995, which saw an increase of 55 per cent compared to 1994 levels. The year 1996 featured a smaller increase of 11 per cent, but for the period 1997 to 1999, the increase was approximately 39 per cent per year. The rate of increase has declined from 1999, arriving at a level slightly above 10 per cent. Seen in relation to the size of the country, Denmark's organic sector is among the largest in Europe.
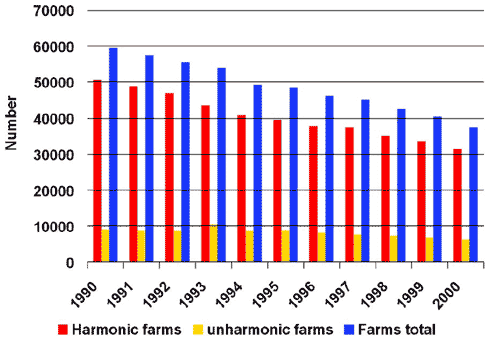
The number of livestock farms decreased significantly during the period 1990 to 2000. This applies to harmonic and unharmonic farms alike. If the production of manure exceeds the norm, the farm is defined as unharmonic. If a farm does not have adequate area (owned or rented) suitable for fertilisation to satisfy the harmony rules, agreements must be made about disposal of manure. In view of the current developments in separation plants for semi-liquid manure, it must be expected that a larger percentage of unharmonic farms will be observed, as it will be possible to sell a larger percentage of the manure to others. Thus, more unharmonic farms cannot be regarded as a sign of increased environmental problems, since the requirements for harmony ensure manure is exported to other farms, such that it does not oversupply nutrients to the land of the farms in question.
When considered over a period of ten years, the indicators for fisheries show that improvements have been made as regards the spawning biomass. At the same time, however, they show that fishery has in most cases not been sustainable, as illustrated by fishing mortality.
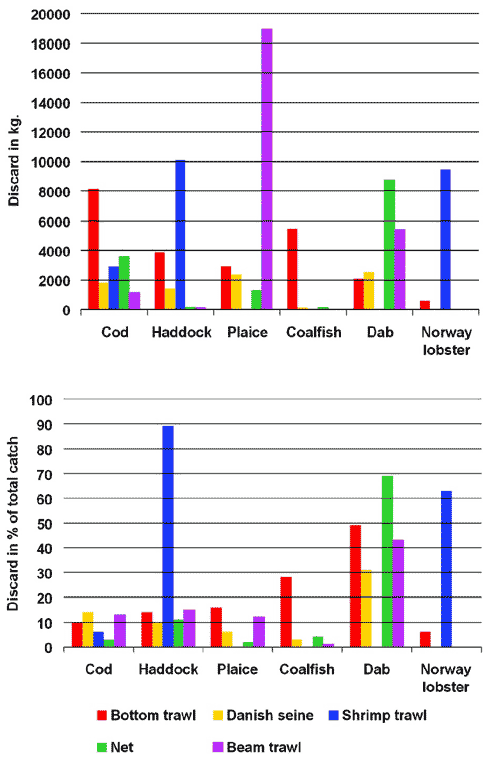
For some fisheries, it is important that discards be documented better. The amounts of discards should be reduced, e.g. through development of selective and gentle fishing equipment.
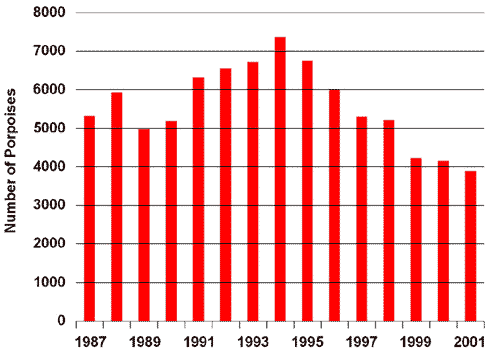
It is estimated that the by-catches of porpoise in the North Sea have been reduced from approximately 7,300 in 1994 to approximately 3,900 in 2000 as a result of the general development in net fishing and the use of pingers (acoustic alarms) on fisheries tackle.
The capacity of the fishing fleet was significantly reduced during the first half of the 1990s, which means that total capacity is now approximately 20 per cent below the agreed ceiling; both in general terms and within each vessel category. The development conforms to the targets agreed within the EU.
Perspectives for development of indicators
The indicators presented above are available at present. The indicator set will be developed on an ongoing basis.
The EU has initiated extensive efforts to develop indicators for the economic, social, and environmental dimensions of sustainable agriculture and sustainable development of rural districts. The results of the international efforts will be incorporated in the national set of indicators.
There is a need for supplementing the indicator for the number and size (area) of organic farms with indicators for production or sales of organic products. For example, as soon as data on consumers' purchases or retailers' sales of organic products become available, these indicators will be included in the set.
As regards the role played by agriculture in terms of nature management, it may be relevant to develop an indicator which elucidates zoning of farmlands by various types of area. As nature plans become used and registered in all counties, they may be used as indicators.
There may be a need to continue development of the indicators in order to achieve greater certainty in calculations.
A clean marine environment is important in order to ensure the natural basis of fisheries. It would be relevant to assess the opportunities for developing indicators capable of elucidating the condition of the marine environment. Work will be carried out to investigate the opportunities for identifying particularly harmful impacts (pollution, etc.), and for registering the effect of initiatives aimed at reducing such impacts.
The national efforts made to develop indicators must be carried out while keeping informed of international considerations as regards selection and development of suitable indicators in order to elucidate sustainable development. Important discussions of these issues are being held within the EU and the ICES (International Council for the Exploration of the Sea).
9.1. Food safety
Indicator 9.1:
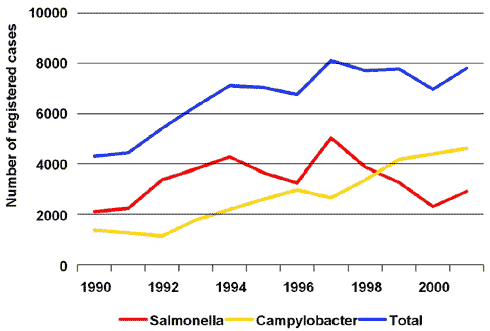
Number of incidences of illness caused by food
Source: Statens Serum Institut (the Danish serum institute)
This indicator serves to illustrate food safety. The figure shows the trend regarding incidences of illness for the most frequent causes of food-related illness: salmonella and campylobacter. It is estimated that the actual number of infections is 10-20 times higher than the diagnosed number of cases.
The total number of food-related cases of illness in Denmark has increased constantly since 1990, from approximately 4,300 registered cases in 1990 to approximately 8,000 in 2001. Until 1999, salmonella was the most frequent cause of food-related illness. The year 1999 was, however, the first year ever where more incidences of illness caused by campylobacter than salmonella were registered. These two types of bacteria account for the majority of all registered cases of illness caused by food.
Various monitoring schemes and action plans have been initiated in order to achieve a high level of food safety. The programmes launched have been effective, as the number of salmonella infections has fallen strongly. The efforts have been followed up in the entire chain, from the animals to the consumer. The efforts aimed against campylobacter and salmonella will be continued in order to reduce the incidence of foodrelated illness.
9.2. Agriculture
Indicator 9.2.1:
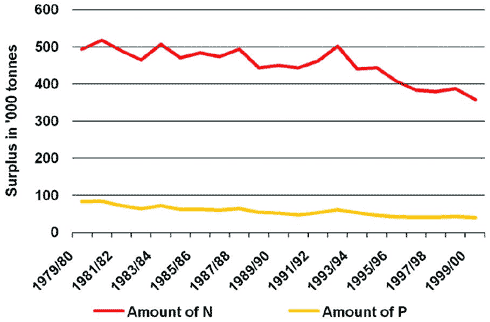
Balance sheet of inputs and outputs of N and P
Source: The National Environmental Research Institute, Denmark and the Danish Institute of
Agricultural Sciences.
This indicator elucidates the objective concerning agricultural loss of nutrients to the aquatic environment. Not all of the nutrients added in agricultural production are fully utilised. The difference between the inputs and outputs of nutrients constitutes a surplus which may be regarded as a potential loss. Loss of nitrogen and phosphorus can have a negative impact on nature and the environment.
During the period 1985 to 1999, the total nitrogen surplus within the agricultural sector fell by approximately 24 per cent, while the total phosphorus surplus fell by approximately 36 per cent. However, the continued input of surplus nutrients means that phosphorus is accumulated in soil. The level of saturation is increased, and this causes an increased risk of losses into the aquatic environment.
The objective stipulated in the Action Plans for the Aquatic Environment I and II is to reduce nitrogen runoffs from farmland by 100,000 tonnes N compared to the runoffs observed in the mid 1980s (230,000 tonnes N). This objective has been pursued through a number of action plans, e.g. Action Plan for the Aquatic Environment II from 1998. Following an adjustment (in 2000) of the initiatives already implemented, it is expected that the objective will be reached in 2003. The Action Plans for the Aquatic Environment do not include any targets for reductions in phosphorus losses from farmland. Nevertheless, further improvement of the condition of lakes and inlets requires that phosphorus discharges from agriculture be reduced.
Indicator 9.2.2:
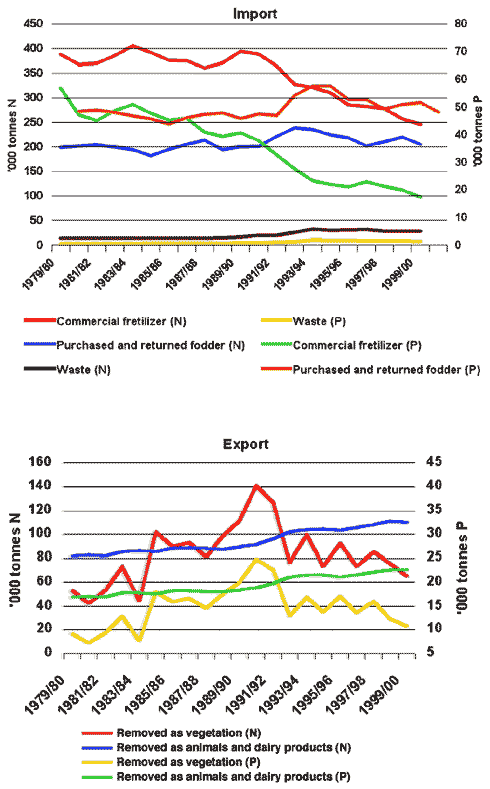
Total imports and exports of N and P within the agricultural sector
Source: The Danish Environmental Research Institute and the Danish Institute of
Agricultural Sciences.
The agricultural sector uses nitrogen and phosphorus in the form of e.g. commercial fertilisers and livestock manure. Some of these nutrients are bound up in the animal production and crops. Nutrients which are not removed from the farms in the form of meat, eggs, milk, or vegetable products are absorbed by the soil or lost to the surroundings. Losses in the form of ammonia evaporation are harmful to natural areas, and discharges of nitrogen and phosphorus into the aquatic environment may cause eutrophication. Nitrate runoffs may also cause contamination of drinking water.
As regards nitrogen, imports of commercial fertilisers fell by 37 per cent during the period 1985 to 1999, whereas animal feed imports increased by 14 per cent. During the same period, exports of nitrogen decreased slightly. This means that utilisation of nitrogen inputs rose from approximately 28 per cent in 1985 to approximately 32 per cent in 1999. As regards phosphorus, imports of commercial fertilisers fell by 62 per cent during the period 1985 to 1999, whereas the import of animal feed increased by 9 per cent. During the same period, exports of phosphorus decreased slightly. This means that utilisation of phosphorus inputs rose from approximately 36 per cent in 1985 to approximately 45 per cent in 1999.
One objective within the agricultural sector is to improve utilisation of imported nutrients. Various action plans have contributed to achieving this objective, and have included efforts aimed at reducing consumption of commercial fertilisers, requirements regarding better utilisation of manure, and introduction of nitrogen norms for crops. The objectives stipulated in the Action Plans for the Aquatic Environment I and II were exclusively aimed at reducing nitrogen consumption, but regulations within the agricultural sector have also had an impact on the consumption of phosphorus. With a view to preparing the Action Plan for the Aquatic Environment III, and as a basis for continued efforts to limit agricultural impacts on the environment, work will be initiated to address not only nitrogen, but also the opportunities for limiting agricultural discharges of phosphorus.
Indicator 9.2.3:
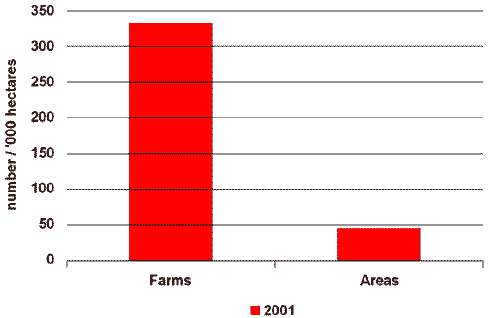
Number of farms and areas which have green accounting/environmental
management
Source: The Danish Ministry of Food, Agriculture and Fisheries
This indicator elucidates the role which agriculture plays in nature management. The figure illustrates the use of green accounting within agriculture in 2001, as illustrated by the total area and number of farms covered by agreements. Green accounting within agriculture raises awareness and focuses greater attention on resource consumption in day-to-day operation.
The possibility of applying for subsidies for preparing green accounts commenced in 2001. A total of 1,000 applications were anticipated each year, but this turned out to be an excessive estimate - certainly in relation to the first round of applications for the scheme. In 2001, approximately 340 farms received a promise for subsidies for preparation of green accounts, corresponding to a total area of approximately 45,000 hectares. It is estimated that several years will pass before general interest reaches the desired level.
Simply by virtue of the areas covered by the green accounts, these accounts entail considerable improvements in the consumption of input factors which are relevant in connection with the Action Plan for the Aquatic Environment II and the Pesticides Reduction Action Plan. It is expected that the greater awareness will result in less resource-intensive production to the benefit of nature, the environment, and farm finances.
Indicator 9.2.4:
Area with agro-environmental schemes (MVJ)
Source: The Danish Ministry of Food, Agriculture and Fisheries
This indicator elucidates the role which agriculture plays in nature management. The figure illustrates developments in the extent of agro-environmental schemes in the form of the number of commitments (agreements) regarding environmentally friendly agricultural production and the number of hectares covered. The actual area covered is directly related to the concrete effect in the form of reduction of discharges of nitrogen from agriculture. These figures have been calculated for 5-year and 20-year commitments, as the duration is crucial to the effect.
Since 1997, the extent of the commitments made appears to have stabilised around 75,000 hectares. This indicates a need for innovation as regards the forms of agreement in order to make the entire scheme more attractive. The scheme is currently being adjusted, with the adjustments taking effect from 2003.
It is expected that the scheme will contribute to achieving the objective outlines in the Action Plan for the Aquatic Environment II and to improving the quality of nature in the areas in question.
Indicator 9.2.5:
Application frequency for pesticides on conventionally cultivated areas
Source: Danish Pesticides Statistics
This indicator elucidates efforts to reduce pesticide consumption. The treatment frequency constitutes a measure of how many times a year the total agricultural area of a given country can be treated with the amount of pesticides sold if these pesticides are used in the standard doses recommended. The treatment frequency indicates the treatment intensity within agriculture, and also serves as an indicator for environmental impact. Several Danish studies have shown that there is a correlation between the treatment frequency and the population of animals and plants in agricultural areas.
The treatment frequency peaked in the early 1990s, but has shown a decreasing tendency since then. In the early 1990s, the treatment frequency was approximately 3, which is to say that farmers treated their fields with pesticides three times a year. In 1998, the number of treatments had fallen to 2.3 times a year. Some years, e.g. 1995, show large fluctuations in the treatment frequency due to hoarding of pesticides which are about to be phased out.
The Pesticides Reduction Action Plan II calls for a treatment frequency of less than two before the end of 2002. This target was almost met in 2000, where the treatment frequency was 2.0. The results of the work carried out by the so-called Bichel Committee showed that it would be possible to reduce the treatment frequency further, to 1.4-1.7 without incurring any significant costs for farmers. The Government wishes to minimise pesticide consumption within the years to come. After 2002, a new target will be established with a view to reducing the treatment frequency even more.
Indicator 9.2.6:
Number and area of organic farms
Source: The Danish Ministry of Food, Agriculture and Fisheries
This indicator elucidates developments in the organic farming sector. The figure comprises the number of authorisations and the development in farm production area up until 2001. The data for this survey have been generated on the basis of the Danish Plant Directorate's monitoring of organic farms.
The number of authorised organic farms remained relatively constant during the period 1991 to 1994. The year 1995 saw a large net increase in the number of organic farms, corresponding to an increase of 55 per cent in relation to 1994. In 1996, there was a small net increase in the number of farms of 116 farms, corresponding to 11 per cent. The net increase for 1997 to 1999 was approximately 39 per cent per year. The net increase from 1999 to 2000 was 367 farms, corresponding to 11.8 per cent. In 2001, the net increase was 66. Generally speaking, the new applicants (276) have smaller farms and fewer farm animals than the established organic farmers. More detailed studies also reveal that half of all new applicants exclusively grow crops, which is a relative increase in relation to previous years. Greater production of organic grain, seed, and feeds is important in order to meet the requirement that as of 2005, all feed for organically farmed animals must be 100 per cent organic.
Denmark's organic sector is among the largest in Europe. As part of sustainable food production, the Government wants continued development of the organic sector based on consumer demand and common EU regulations.
Indicator 9.2.7:
Environmental impacts from agriculture as illustrated by energy consumption,
frequency of pesticide treatment, number of livestock, methane emissions, ammonia losses,
and nitrogen surpluses in relation to changes in value of production
Source: The National Environmental Research Institute, Denmark
This indicator elucidates developments pertaining to a range of environmental impacts within agricultural production. The figure shows indexed values in relation to index 100 in 1988-91.
The agricultural production value has increased by around 20 per cent from 1988 to 1998 (1990 prices). Energy consumption within agriculture has increased almost as much as the production value. Agriculture accounts for approximately 18 per cent of Denmark's total emissions of greenhouse gases. The gases emitted by agriculture are mainly methane and laughing gas (nitrous oxide). Emissions of methane have been reduced by approximately 10 per cent. The number of farm animals per hectare farmland (livestock) has gone up from 1.07 to 1.23. Agricultural consumption of commercial fertilisers has decreased, and manure is being utilised more efficiently. As a result, the quantities of surplus nitrogen and phosphorus (inputs less outputs bound in crops, etc.) have fallen by more than 20 per cent. Agricultural emissions of ammonia have decreased by 20 per cent.
Overall, a number of environmental impacts from agriculture have been reduced in the last ten years, even as agricultural production has gone up. Agricultural emissions of ammonia, which may cause acidification and excessive nutrient contents in natural areas, are down by 20 per cent. Further reductions are, however, needed in order to meet objectives. Pesticide consumption has fallen more than the treatment frequency. This is because many of the pesticides used today are effective in very small doses. This entails lower quantities, but not necessarily lower impacts on the environment.
Indicator 9.2.8:
Number of farms, size and specialisation (harmonic and unharmonic farms)
Source: Statistics Denmark
The number of unharmonic farms is one of several indicators for the balance between manure generation and the size of farms (area). The distinction between harmonic and unharmonic farms is made on the basis of the amount of manure generated at each farm and the corresponding number of hectares suitable for fertilisation belong to the farm in question (owned and rented areas). Calculations are carried out in accordance with the rules in the Statutory Order on Manure. If the production of manure exceeds the norm, the farm is defined as unharmonic.
The figure shows that the number of livestock farms fell significantly during the period 1990 to 2000. This applies to harmonic and unharmonic farms alike. The percentage of unharmonic farms increases with the size of livestock production. The relative distribution has been relatively stable. For example, unharmonic farms accounted for a total of 18.1 per cent in 1994. The corresponding figure in 2000 was 16.4 per cent.
The number of unharmonic farms is likely to rise due to stricter harmony regulations. In view of the current development in separation plants for semi-liquid manure, it must be expected that a larger percentage of unharmonic farms will be observed, as it would be possible to sell a larger percentage of manure to others. Thus, more unharmonic farms cannot be regarded as a sign of increased environmental problems, since the requirements for harmony ensure manure is exported to other farms, such that it does not oversupply nutrients to the land of the farms in question.
9.3. Fisheries

Indicator 9.3.1:
The number of fish stocks where the spawning biomass (SSB) is within safe
biological limits and the number of fisheries operated within safe biological limits (i.e.
where fishing mortality (F) is within safe biological limits).
Source: Danish Institute for Fisheries Research
This indicator elucidates the objective concerning conservation of marine fish stocks and ecosystems. The SSB indicator measures the percentage of all stocks which are within safe biological limits, while the F indicator measures the percentage of fisheries operated within safe biological limits. The indicators have been calculated for the period 1990 to 2000 and cover ten stocks of great significance to Danish fisheries. No data for (F) is available for 1992, 1995, 1997, 2000 and 2001. The diagram shows that an average of 50-60 per cent of the ten selected stocks have been within safe biological limits during the period 1990 to 2001 (the SSB indicator), and that a total of approximately 10 per cent of fisheries on the same stocks are operated within safe biological limits (the F indicator).
Seen over a ten-year period, the indicators show that the spawning biomass has improved during the last three years (SSB). In most cases, fishery expressed by fishing mortality F has in most cases not been sustainable. This means that the objective of having fishery carried out at a sustainable level has not yet been achieved.
Indicator 9.3.2:
The percentage of discards compared to the total catch (landings and discards) for
selected species, analysed by the fishing equipment used. The data are based on samples
(estimates) from selected fisheries in the North Sea, 1995-2000.
Source: Danish Institute for Fisheries Research
This indicator elucidates the objective concerning reduction of the amounts of discards. The figures show the discards for cod, haddock, plaice, coalfish, dab, and Norway lobster, analysed in terms of quantities and as percentages of total catch by fishery type. The data are based on spot tests. The figures only concern calculations for those fisheries in the North Sea where observers have participated during the period 1995 to 2000.
The calculations are subject to some uncertainty, but do indicate the levels of discards within the fisheries specified. It should be noted that relatively large variations in the amount of discards can be observed, depending on the species and tackle involved.
For fisheries involving stocks that are under pressure and where the amounts of discards are considerable, it is important to monitor and reduce discards. The data basis must be extended in collaboration between the countries participating in fisheries, and the efforts to reduce discards must be adapted to individual fisheries.
Indicator 9.3.3:
The extent of by-catches of porpoise (estimated) by Danish net fishing in the North
Sea
Source: Danish Institute for Fisheries Research
This indicator elucidates the objective on avoiding by-catches of porpoise as far as possible. The figure shows the trend as regards the total Danish by-catches of porpoise in connection with net fishing in the North Sea. The figures have been calculated on the basis of sample data collected from commercial vessels by observers from Danish Institute for Fisheries Research. The rates of by-catches from the observed expeditions have been extrapolated to the total fleet on the basis of the overall fishing performance.
It is estimated that the by-catches of porpoise in the North Sea have been reduced from approximately 7,300 in 1994 to approximately 3,900 in 2001 as a result of the general developments within net fishing.
The monitoring carried out by the Danish Institute of Fisheries Sciences of by-catches of porpoise indicates that use of pingers (acoustic alarms) in the fisheries where by-catches typically occur is an efficient method for reducing by-catches. As yet, however, no definite conclusions can be arrived at concerning the effectiveness of pingers. This is partly because the relevant method of fishing (net fishing for cod near wrecks in the North Sea) has declined significantly during the observation period, and because it has not yet been possible to observe the longterm effect of pingers. The work on monitoring the effect of pingers and studies involving alternative equipment is planned to continue.

Indicator 9.3.4:
Capacity of the fishing fleet (tonnage, engine power, etc.) and composition in 2000
Source: The Danish Ministry of Food, Agriculture and Fisheries
This indicator elucidates developments in the adaptability of the size of the fleet to the catch possibilities. The figures show the composition of the fishing fleet as well as fleet capacity in gross tonnage (GT) and engine power (kW). The statistics are also presented by vessel category.
The capacity and development of the fishing fleet conforms to the targets agreed within the EU. The capacity of the fishing fleet was significantly reduced during the first half of the 1990s, which means that the total capacity is now approximately 20 per cent below the agreed ceiling; both in general terms and within each vessel category.
Seen in a wider perspective, the Government aims to continue adapting the capacity with a view to greater profitability and sustainability within the fishing fleet.