Ranking of Industrial Products
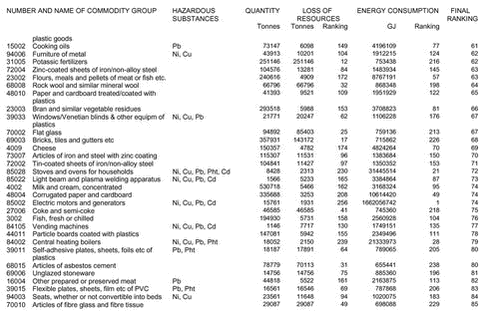
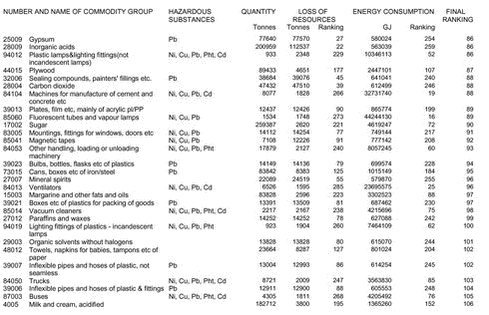
Appendix 1b Ranking of industrial products as to energy and resources. Based on mean value of production and supply quantities
Introduction In this appendix the commodity groups are listed according to the average ranking in relation to loss of resources and energy consumption. The calculation of loss of resources and energy consumption is based on supply quantities, cf. section 1.3 (page 29) in the main report. The table includes the approx. 200 highest ranking commodity groups. Explanation of the table: In the table the following information is provided: First column: The number and title of the commodity group Second columm The environmentally harmful substances contained in the products of the commodity group (cf. section 1.6). The substances are stated as the following abbreviations: Cu (copper), Pb (lead), Cd (cadmium), Ni (nickel), Pht (phthalates). Third column: Uncorrected commodity quantities in tonnes, i.e. quantities have not been multiplied by correction factor. The quantities stated represent the mean value of the production and supply quantities of each commodity group. Fourth column: Calculated loss of resources in tonnes Ranking according to loss of resources exclusively. Fifth column: Calculated energy consumption in GJ (Gigajoule) Ranking according to energy consumption exclusively. Sixth column: Final ranking calculated on the basis of the sum of ranking according to loss of resources and ranking according to energy consumption. It should be noted that more than one commodity group can have the same ranking. The detailed calculations of each commodity group are shown in Appendix 2. For further information of each commodity group, see Appendices 4 and 5. |


