Dry deposition and spray drift of pesticides to nearby water bodies
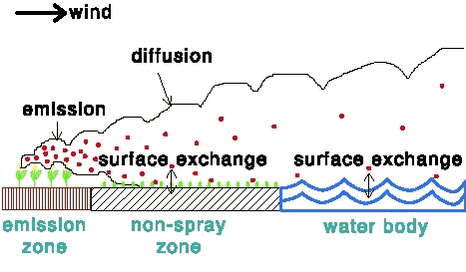
2 Modelling dry deposition of to water bodies2.1 Introduction2.2 Emission 2.3 Atmospheric diffusion 2.4 Exchange between the air and the surface: general principles 2.5 Exchange between the air and the surface: vegetation 2.6 Exchange between the air and the surface: water 2.6.1 Laminar boundary layer resistance for water 2.6.2 Surface resistance for water 2.7 Results for example situations 2.8 Possibilities for generalisation 2.9 Dependence on the wind speed 2.10 Effect of the upwind field length 2.11 Effect of the length of the non-spray zone 2.12 Parameter choice in the decision tool PestSurf 2.1 IntroductionA model called PESTDEP was developed that can be used to estimate the (maximum) dry deposition of gaseous pesticides to a water body adjacent to a field onto which a pesticide is applied. The water body can be a stream, a lake or a sea area. The basic situation that the model describes is given in Figure 1a. A pesticide is applied to a field. Part of the pesticide volatilises and is transported first over a non-spray zone (“buffer zone”) and then over a water body. The pesticide is then transported further away, but that process is not described by this version of PESTDEP. The pesticide can be exchanged between the air and the surface (non-spray zone or water body). If the concentration in the air is higher than the concentration in the air that is in equilibrium with the concentration in the surface (e.g. water), the net flux will be downward. In that case dry deposition is occurring. In the opposite case the emission occurs. A special version of PESTDEP will be used in a decision tool (PestSurf) in the approval procedure for pesticides. This means that the model should be able to describe a general situation. For that reason it was chosen to develop a 2-dimensional model with a distance x in the downwind direction and a height z as the dimensions. This type of model gives the same results as a 3-dimensional model with an indefinitely long field, indefinitely long non-spray zone and indefinitely long water body in the y direction. To simplify the results and to get an estimate of the maximum deposition of the pesticide to the water body, it is assumed that the wind is always blowing from the direction of the field to the water body. This is, in fact, not correct. However, it should be kept in mind that there are also fields at the other side of the water body and when the wind direction is opposite these fields will then contribute to the deposition to the water body. Corrections can be made, taking into account the frequencies of the wind directions and the position of the water body, but this is difficult to generalise. In the version of PESTDEP that is integrated in PestSurf no corrections are made so that an estimate of the maximum deposition is obtained. The model should describe the following processes: 2.2 EmissionThe emission rate of pesticides to crops and fallow soil depends on many factors, e.g.:
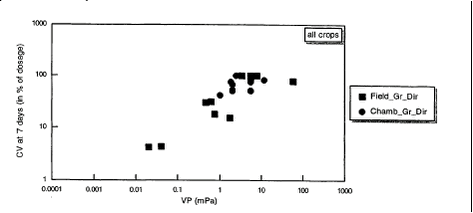
At present there are no models available that simulate the emission rate of pesticides applied to crops as a function of time, but only the accumulated emission as a percentage of the applied dose (Smit et al., 1998). There are some models available that simulate the emission of pesticides applied to fallow soil as a function of time (see e.g. Jury, 1983). Most of the pesticides are applied to crops. As for this type of application no model was available that gives the emission as a function of the time, it was decided to use models that calculate the accumulated emission as a percentage of the applied dose, both for application to the soil and to crops. It was decided to use the models of Smit et al. (1997) and Smit et al. (1998) to calculate the accumulated emission after application. These models are based on statistical correlation of the observed accumulated emission published in the literature with physical and chemical parameters that are likely to play an important role in the volatilisation process. The relations found were based on pesticides that do not photolyse or hydrolyse. For that reason these methods cannot be applied for pesticides that show a noticeable photolysis or hydrolysis. Sometimes these methods lead to extremely high volatilisations, e.g. 80-100%. Such high numbers indicate that the compound is highly volatile, but they can in that case not be used as a quantitative measure. Smit et al. (1998) found the following statistical relation for the accumulated emission of pesticides during 7 days after application to crops that fully cover the soil in the field and in climate chambers (see also Fig. 2):
where: This relation is based on 14 field and climate chamber experiments with 13 pesticides. It should be noted that this relation cannot be used for the emission of pesticides incorporated in the soil.
Figure 2. Accumulated emission during 7 days after application of the pesticide to the crop vs. vapour pressure of the pesticide (Smit et al., 1998). Smit et al. (1997) found the following statistical relation for the accumulated emission of pesticides during 21 days after application to normal moist fallow soil (see also Fig. 3):
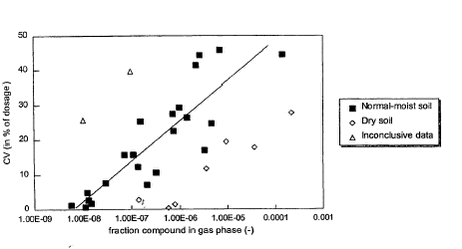
where: Note that the accumulated emission CV21 cannot be calculated if FPgas falls outside the range indicated in equation (2). The maximum accumulated emission during 21 days using this equation is 95.1%. This relation was based on 14 field studies with 31 pesticides. In Appendix A information is presented on how FPgas can be calculated from soil and pesticide properties. Experiments show that the emission rate is high in the beginning and shows diurnal variations that are connected to variations in meteorological variables: temperature and turbulence. Moreover, the emission rate is affected by precipitation.
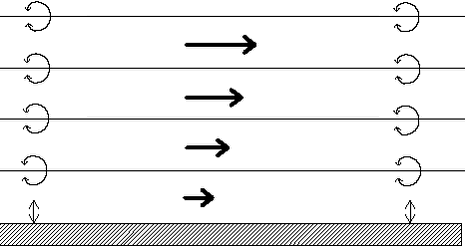
Figure 3. Accumulated emission 21 days after application of the pesticide to fallow soil vs. the fraction of the pesticide in the gas phase in the soil (Smit et al., 1997). The fact that only accumulated emissions are available for periods of 7 or 21 days has some consequences for the modelling. This would mean that it is only possible to model removal by precipitation for rain events that last 7 or 21 days. These events occur only in the Bible and are less relevant to the problem treated here. As the emission rate is highly variable during the periods of 7 and 21 days it is difficult to model the removal by precipitation. Model experiments (Asman, 2001) showed that the contribution of the emission from the field to the wet deposition is usually not so important compared to the contribution from dry deposition. The reason for this is that the pesticide plume relatively close to the field has not yet reached the cloud base. This means that uptake of pesticides can only occur by raindrops and not by cloud droplets. Raindrops have a high fall speed. Moreover, they are relatively large which means that they have not so much surface area where uptake can occur per volume. So they are only during a short time in the plume and do not take up the gas very efficiently. For this reason it was decided not to take removal by precipitation into account in this version of PESTDEP. Removal of pesticides by precipitation can be an important pathway, but only if the more efficient in-cloud processes that play a role. Cloud droplets have a residence time of maybe 20 minutes or longer in clouds and their surface to volume ratio is such that they reach equilibrium with the surrounding air in the cloud within a few seconds. 2.3 Atmospheric diffusionA steady-state atmospheric diffusion model was developed that describes the diffusion in the x direction (horizontal, downwind) and the z direction (vertical). In the model the atmosphere is described by a number of logarithmically spaced layers (Fig. 4). Within each layer there is a constant horizontal wind speed. The vertical wind speed is neglected because it is usually rather small. Only turbulent vertical exchange between the layers is taken into account. Diffusion in the x direction is also not taken into account because it can also be neglected for more or a less stationary source as is the case here. As the model is only two-dimensional in the x, z plane, diffusion perpendicular to the wind direction (y direction) is not taken into account. So, the only diffusion taken into account is the diffusion in the vertical direction (z direction).
Figure 4. Set-up of the model: layers, wind speed (symbolised by arrows), exchange between layers by eddy diffusivity (symbolised by whirls) and exchange between the air and the surface (symbolised by double arrows). It should be noted that emission is a form of exchange between the atmosphere and the surface. The average wind speed within a layer is calculated from the wind speed at 100 regularly spaced vertical points within the layer using the following relation (Arya, 1988):
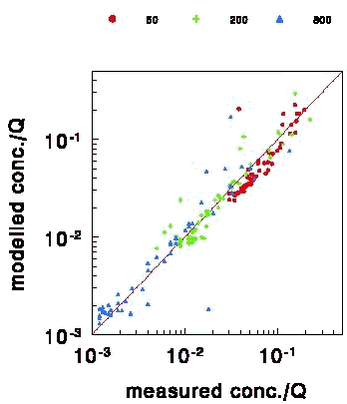
where: u(z) = wind speed at height z (m s-1) From (3) it can be seen that the wind speed increases with height. Moreover, it can been seen that the wind speed at height z0m is zero. In reality (3) is not valid at heights close to z0m and there will be some wind at height z0m. Relation (3) is valid for a neutral atmosphere, i.e. an atmosphere where the turbulence is generated mechanically. For a stable or an unstable atmosphere the relation is somewhat more complicated (Arya, 1988). The atmosphere is neutral most of the time. As a generalised model should be made it was therefore decided only to model diffusion for neutral atmospheric conditions. The exchange of material between two adjacent layers in the model is described by an eddy diffusivity (diffusivity by whirls) coefficient. This coefficient is the same for material as for heat. For neutral atmospheric conditions it is given by (Arya, 1988): KHeat(z) = κ u* z (4) where: Equation (4) shows that the eddy diffusivity increases with turbulence and height. For stable or unstable conditions there are more complicated expressions (Arya, 1988). A more detailed discussion of atmospheric diffusion can e.g. be found in Asman (2001). The vertical diffusion part of the model was tested against the results of a tracer experiment in the U.S.A., where the tracer was released from a low-level source. The emission height is representative of the height from which pesticides are released after application to a field. The general problem with testing the diffusion part of models is that there are only done a very few diffusion experiments because they are so expensive. In the experiment sulphur dioxide was released from a 0.46 m high point source (van Ulden, 1978). The concentrations were measured at a height of 1.5 m at distances of 50, 200 and 800 m from the source. The surface roughness length was 0.008 m. The diffusion using (3) and (4) lead to an underprediction of the concentration at 50 m by 9%, an overprediction at 200 m by 7% and an overprediction at 800 m by 23%. This phenomenon was also observed for other diffusion models (Gryning et al., 1983; Brown et al., 1993). They guess that part of the observed differences can be explained by the fact that sulphur dioxide is dry depositing to a minor extent. They come also up with other explanations. Based on the comparison it was somewhat arbitrarily decided to increase the vertical diffusivity KHeat(z) in PESTDEP by 30%, so that somewhat better agreement was obtained (Note: this change in KHeat has an effect on the concentrations that is usually less than 30%). There is, however, no theoretical justification for this correction. Fig. 5 shows the modelled vs. measured ratio of crosswind-integrated concentration/source strength
Figure 5. Modelled vs. measured ratio crosswind-integrated concentration/source strength (this is a measure for dilution caused by vertical diffusion) for 3 downwind distances: 50, 200 and 800 m. The line indicates the curve that would be obtained if the modelled values were equal to the measured values. 2.4 Exchange between the air and the surface: general principlesIn the model a description of the exchange between the air and the surface is needed for the non-spray area and the water body. The following model can be used to calculate the exchange (Fig. 6; see also Appendix C). It consists of different resistances to transport. It should be noted that the resistances in the model are in series because a molecule must subsequently pass these barriers before reaching the surface or the atmosphere (analogous to the principle of electrical resistance).
Figure. 6. Model for resistance to exchange between the atmosphere and a surface (soil, vegetation, water body). These resistances should be overcome during both the dry deposition as well as the emission process. The description for both processes is the same. The flux between the atmosphere and the surface is described by:
where: Kg can be expressed as:
where: In the model there is a resistance to transport in the air (ra, called ”aerodynamic resistance”) from a certain reference height to surface roughness length z0m, i.e. the height at which the wind speed is zero. It is the eddy diffusivity, the turbulence that is taking care of this transport. The aerodynamic resistance can be found by integrating (4) between those heights, which leads to the following expression for ra neutral atmospheric conditions:
The units in which ra is expressed is s m-1; this is just the inverse of a speed. In this equation zr is a reference height (m). In PESTDEP zr is the height of the centre of the lowest layer. The aerodynamic resistance is the same for all gases, i.e. it does not depend on the properties of the gas and depends only on the turbulence and the roughness of the surface for momentum. Then there is a layer, which is usually called the laminar boundary layer. This is a stagnant or intermittently mixed layer in the air close to the surface (1 mm) through which the transport is mainly thought to occur through molecular diffusion, which is much less efficient than turbulent diffusion. Molecular diffusion varies with the size of the molecules. Larger molecules such as pesticides do not diffuse as fast as small ones. Thus for pesticides the laminar boundary layer resistance will be larger than for lighter molecules. The laminar boundary layer resistance does not only depend on the properties of the gas, it also depends on the properties of the surface. As a result rb is different for vegetation and water bodies. The laminar boundary layer resistance rb is defined by:
where z0c is the surface roughness length for concentration (m) and z0c is the surface roughness length for concentration. From this equation it can be seen that rb decreases with turbulence. The reason for this is that when there is more turbulence the layer becomes thinner and the molecules do not have to diffuse such a long way. The surface resistance rc (s m-1) is the resistance for the uptake into the surface. If it is small the gas will be taken up very well by the surface and the dry deposition velocity will be relatively large. If the surface is resistance is large almost no gas is taken up and the dry deposition velocity will be low. In surfaces there is often some water present. For the more polar pesticides that are soluble in water it could be reasonable to expect rc to decrease with the solubility of the gas in water. For non-polar solubility in e.g. wax layers on plants or on organic matter in the soil could determine the surface resistance. In the model rc should be known for the emission zone and the non-spray zone. In section 2.5 the parameterisation of rb and rc for vegetation is discussed, whereas the parameterisation of rb and rc for water bodies is discussed in section 2.6. 2.5 Exchange between the air and the surface: vegetationIn general there will be vegetation in the non-spray zone. The amount of gaseous pesticide removed in the non-spray zone cannot be dry deposited to the water body and it is therefore important to know it. It should be noted, however, that only a relatively small fraction of the total airborne mass of pesticides is deposited to a non-spray zone if it is only a few metres wide. For vegetation rb is often parameterised as follows (Hicks et al., 1987): 
where:
where: From (10) it can be seen that rb decreases with turbulence and increases with the molecular mass of the gas, which in the equation is “hidden” in Scg. Also a value of rc for the non-spray zone should be chosen. The problem, however, is that there are no values known in the literature for pesticides. Moreover, vegetation seems to have a limited capacity to absorb pesticide, which depends on the concentration of the pesticide in the air (Deinum et al., 1995; Duyzer and van Oss, 1997). If the concentration in the air decreases even emission of deposited pesticide from vegetation could occur. There are different options to choose extreme values for rc for the non-spray zone. One is setting rc to zero which leads to a maximum possible dry deposition in the non-spray zone (all pesticide that reaches the surface is taken up). The other one is setting rc to indefinite (no pesticide at all is taken up), which leads to the maximum possible dry deposition to the water body. In the version of PESTDEP that is integrated in PestSurf, the rc in the non-spray area is set to indefinite (dry deposition velocity is zero). This is done to obtain an estimate of the maximum deposition to the water body. 2.6 Exchange between the air and the surface: waterIn this section the exchange between the atmosphere and the surface is discussed. First information on the laminar boundary layer resistance rb is presented and then information on the surface resistance rc. These resistances are different for different types of water bodies and depend in general on meteorological conditions and sometimes on the flow characteristics (rapidly running shallow rivers).
One should, however, keep in mind that the purpose of the model is to evaluate the risk of pesticides relative to each other. The dry deposition of pesticides will in most cases be influenced by these factors in the same fashion. In that way they will have little relevance. It should be noted that the uptake of pesticides in principle also depends on the mass accommodation coefficient and a possibility of the pesticide to react in water (see Appendix C). In the following it is, however, assumed that these processes will not have any influence on the uptake rate. 2.6.1 Laminar boundary layer resistance for waterThe laminar boundary layer resistance rb for water can be parameterised for smooth surfaces and rough surfaces (surfaces with waves). There is no parameterisation for the transition area between smooth and rough surfaces. 2.6.1.1 Rivers and small lakes
This equation shows that rb decreases with the friction velocity u* (i.e. rb decreases with wind speed). Equation (11) and (10) show that rb will increase with the molecular weight, but this increase is rather moderate: rb for a compound with a molecular weight of 400 g mol-1 is only 30% larger than rb for a compound with a molecular weight of 200 g mol-1. Not to far from land u* will still be about the same as on land. For that reason it is reasonable to assume that the value of u* from land can be applied in equation (11) to find rb for streams and small lakes. In the version of PESTDEP that is integrated in PestSurf two values for u* are used that are representative for average Danish conditions: for areas with crops u* = 0.386 m s-1 and for area with fallow soil u* = 0.284 m s-1 (see Appendix G for details). This leads to rb values of 79 s m-1 for areas with crops and 107 s m-1 for areas with fallow soil if a molecular mass of 300 g mol-1 is assumed. As there are not many experiments where rb for smooth water surfaces is measured there is still a considerable uncertainty in the parameterisation used here. If the surface were rough in stead of smooth and the parameterisation of rb for the sea were used (see next section) rb would be 33 s m-1 in stead of 79 s m-1. 2.6.1.2 Sea The laminar boundary layer resistance rb was previously defined by equation (8), where both the roughness length for momentum (z0m) and the roughness length for concentration (z0c) need to be known. The ratio z0m/z0c used here for all water surfaces is given by Brutsaert (1975) with a slight modification by Lindfors et al. (1991). For a smooth surface, i.e. for streams (for all Reynolds numbers) and for large water bodies which are smooth (for Reynolds numbers Re < 0.15):
For large water bodies with waves so that they are rough (for Reynolds numbers Re = 0.15):
In this case the thickness of the laminar boundary layer increases with u*. The Reynolds number is defined by:
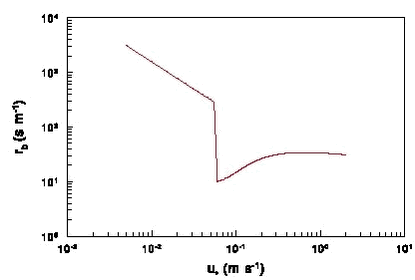
The wind generates waves on larger water bodies the wave height increases with wind speed for speeds larger than about 2 m s-1 and so does the roughness length. The surface roughness length at sea is (Joffre, 1988): where: According to (13) z0m decreases with u* for wind speeds up to about 2 m s-1. For larger wind speeds z0m increases with u* due to wave formation. A typical value for z0m is 1x10⁻⁴ m. Fig. 7 shows how rb varies with u* based on (12a) and (12b). This is a strange function which shows a ”jump” near a value of 0.06 m s-1 for u’ where the change from the parameterisation of the smooth to the rough surface occurs. For that reason it was felt that a further examination was needed. The curve is apparently based on wind tunnel experiments with thorium-B (222Pb) vapour made by Chamberlain (1968). For rough surfaces measurements have only been made for roughness Reynolds numbers greater than 0.3, which is equivalent to u* values greater than 0.12 m s-1. Further it is known that for very low roughness Reynolds numbers the value of rb becomes very large. The middle part of the curve is a form of interpolation that is maybe correct for water vapour, but apparently not for molecules with much higher molecular mass such as pesticides. There are apparently no data for this range. The nice thing is that Pb has a molecular mass of 207, which is representative of the molecular mass of pesticides. It was decided to use only the parameterisation of (z0m/z0c) for rough surfaces for the sea, as the sea is rough most of the time. If the friction velocity u* becomes smaller than 0.12 m s-1 (Re = 0.3) in PESTDEP rb is automatically set to the value for u* = 0.12 m s-1. Fig. 7 shows that r varies little with u* for u* values greater than 0.12 m s-1 (from 18 to 34 s m-1). Figure 7. The laminar boundary layer resistance rb for water as a function of the friction velocity u* (molecular mass 300 g mol-1 and a temperature of 15° C). As the sea is large it cannot be assumed that the friction velocity u* at sea is the same as on land. For that reason u* has to be corrected, e.g. by assuming that the wind speed at some height (e.g. 50 m) is the same as over land. With equation (3) this wind speed can be calculated knowing u* and z0m for land. The same equation can then be used to find u* and z0m for the sea from the wind speed at e.g. 50 m using equation (13) for z0m in an iterative process. In the version of PESTDEP that is integrated in PestSurf no deposition to the sea can be calculated. 2.6.2 Surface resistance for waterThe surface resistance rc for water is (see Appendix C):
where: Henry’s law coefficient is defined by:
It should be noted here, that there are numerous definitions of Henry’s law coefficients, having different units and even different senses. Equation (14) shows that the resistance for uptake decreases (the dry deposition velocity increases) with a decrease in KH and an increase in kw. The mass transfer in the aqueous phase depends on the turbulence of the upper part of the water body. This turbulence is caused by the water currents and by the influence of the wind and by raindrops that are deposited onto the water (Banks and Herrera, 1977). Wind not only creates currents in the water, but can also lead to the formation of waves and air bubbles, that influence the mass transfer in the water phase. The waves depend in a complicated way on the wind speed, the fetch and surface contamination (affecting the surface tension of the water). It should be noted here, that in principle it is the wind speed relative to the flow velocity of the water (as vectors) that causes the part of the turbulence created by the wind. Different mechanisms play a role in the mass transfer in the aqueous phase. For that reason we will in the following sections differentiate between:
2.6.2.1 Mass transfer in the water phase in rapidly running shallow waters Schwarzenbach et al. (1993) came up with an expression for the mass transfer coefficient kw (m s-1) in the water phase using the surface renewal model (Danckwerts, 1951) and taking into account that the transfer decreases with the depth of the water: where: It should be noted that in this equation kw increases with Dw½. Schwarzenbach et al. (1993) compared this expression with the measured rates of volatilisation of organic chemicals from streams and rivers and found that (16) underpredicts the measured volatilisation by a factor 2 or 3. They note that this is more than adequate having in mind that this equation does not take into account wind effects and effects of waterfalls. The weak point of this equation is, however, that kw is not a function of the slope, which is a very important parameter which should be taken into account in this type of equations (Moog and Jirka, 1998). In principle the slope could be added to this equation, but in PESTDEP another method will be used. The method used in PESTDEP is based on information on the exchange of oxygen between the atmosphere and the water (reaeration). Oxygen is a slightly soluble gas, and for slightly soluble gases the overall mass transfer (exchange between air and water) is dominated by the aqueous phase mass transfer. This means that for oxygen the mass transfer in the aqueous phase can be determined from experiments where the overall gas transfer is measured. This is an advantage as it is much easier to measure the overall gas transfer than the mass transfer in the aqueous phase. Moreover, there have been made so many reaeration measurements in rivers with different properties that it has been possible to generalise the results in experimentally determined functions for all types of rivers. For other gases experimental data are only available for a few rivers (Rathburn and Tai, 1982; Wanninkhof et al., 1990; Genereux and Hemond, 1992; Chapra and Wilcock, 2000), but not so many as for oxygen and they are more difficult to generalise. For that reason it was decided to model the mass transfer of pesticides in the aqueous phase in rivers the same way as the mass transfer of oxygen taking into account that pesticides and oxygen have different diffusivities in water (see also Brumley and Jirka, 1988). The relation between the mass transfer coefficients of a slightly soluble gas and that of oxygen is given by:
The stagnant two film model suggests that n = 1 whereas the surface renewal model suggests n = 0.5 (Genereux and Hemond, 1992). Smith et al. (1980) suggest a value of n of 0.6 based on laboratory measurements. Other experiments mentioned by Genereux and Hemond (1992) point to a value of 0.7. Genereux and Hemond (1992) mention also that the value of n is rather uncertain. In PESTDEP value of n is 0.5 is chosen, which is also used by Mackay and Yeun (1983), Cirpka et al. (1993) and Hibbs et al. (1998). The relation between the mass transfer rate in the water phase and the reaeration coefficient is (Moog and Jirka, 1998):
where K2s is the reaeration coefficient (s-1). Usually, however, this K2s coefficient is given in day-1. If it is now assumed kw that is a function of Dw½ the following relation can be found: In this equation is K2d the reaeration coefficient (day-1), whereas kw is in m s-1. It should be noted that K2d is usually given for a temperature of 20° C. This means that the diffusivities at 20 ° C should be used in this equation. The diffusivity of O2 in water at 20° C can be calculated from the diffusivity at 25° C (value: 2.20x10⁻⁹ m2 s-1 given by Ferrell and Himmelblau, 1967). With the relations in Appendix B then a value of the diffusivity of O2 of 1.92x 10⁻⁹ m2 s-1 at 20° C is found. The reaeration coefficient is a function of the temperature, which reflects that the diffusivity of O2 in water increases with temperature. The general relationship is:
where t is the temperature(° C) and θ is a temperature coefficient (dimensionless). In the literature different experimentally values for θ presented. Churchill et al. (1962) found a value of 1.024 and Tsivouglou et al. (1972) determined a value of 1.022. It should be noted that if K2d would be a function of the square root of the diffusivity only (which is a function of the temperature and the viscosity of water, see Appendix B) θ would be about 1.016 (for temperature range 0-20° C). In PESTDEP a value of 1.024 is used. The final expression of the mass transfer coefficient in water is found from (19), (20) and the diffusivity of O2 in water at 20 ° C:
It should be noted that in this equation the units of kw in this equation are in m s-1 whereas the units of K2d are in day-1. This is done because they are usually given in these units. In the literature numerous parameterisations of reaeration coefficients can be found. This reflects partly the variety of streams that can be found. Moog and Jirka (1998) compared various proposed parameterisations with different experimental data sets and found that the slope should be included in the parameterisations to obtain a good result. For low slope streams (slope < 0.0004 m m-1) the predictive relationships were not adequate and suggest that K2d may be controlled by other variables such as bed type, roughness, wind shear or surfactants. For this group of streams the geometric average value of the measured K2d (1.8 day-1) did describe the reaeration better than any predictive equation. They also noted that the relationships of O’Connor and Dobbins (1958) and of Churchill et al. (1962) that are among the most frequently applied, but do not include the slope, have little or no predictive value for streams of all types of slopes. One of the relationships that showed the most reasonable agreement with measured data for all slopes was of Cadwallader and McDonnell (1969):
where I = slope (m m-1). As the relationships of O’Connor and Dobbins (1958) and Churchill et al. (1962) are among the most known they will be given below, but they should preferably not be used, because they do not contain information on the slope. The relationship of O’Connor and Dobbins (1958) is often used for ordinary rivers and is given by:
The relationship of Churchill et al. (1962) is often used for rivers with high flow velocities and is given by:
In Denmark streams are small and are in most cases dominated by macrophytes. For this type of streams Thyssen and Erlandsen (1987) derived the following expression for K2d based on measurements with different methods using 144 measurements:
It should be noted here that this relationship includes information on the slope that according to Moog and Jirka (1998) is very important in general. Thyssen’s relationship was based on streams with the characteristics presented in Table 1a. Table 1a.
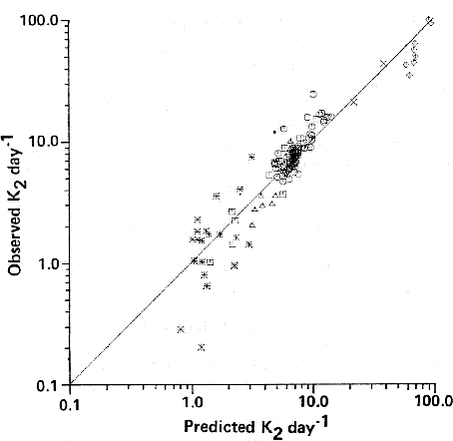
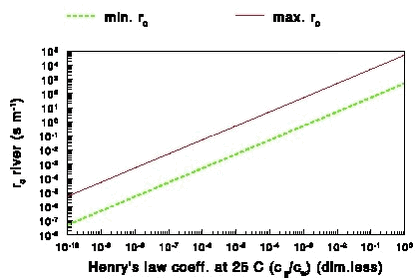
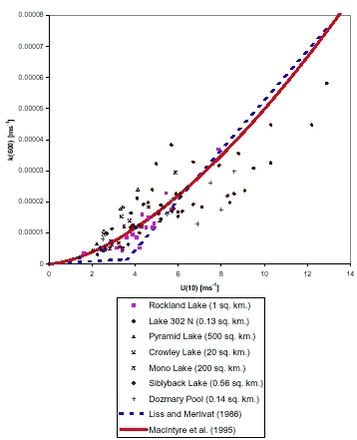
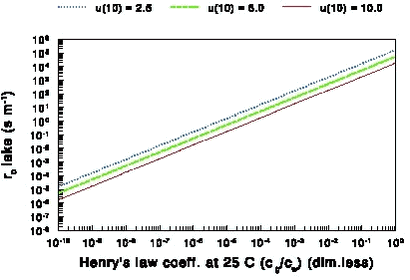
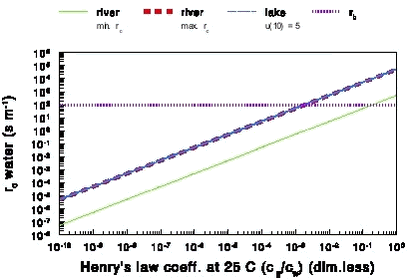
Fig. 8. shows that the predicted values for K2d for the Thyssen and Erlandsen parameterisation agree well with the measurements for the range from 3-15 day-1 , but that the model does not predict K2d well for low (< 3 day-1) and high (> 30 day-1) reaeration rates. It should be noted here that the gas exchange in rivers can be strongly influenced by hydraulic controls such as weirs, falls, or even cascades. In such a situation the gas exchange is strongly dominated by the entrainment of air bubbles, at least for compounds with smaller Henry’s law coefficients (Cirpka et al., 1993). In PESTDEP it is possible to choose one of the parameterisations of K2d that is presented in this section. In the version of PESTDEP that is integrated in PestSurf no choice can be made and only the Thyssen and Erlandsen parameterisation is used because this tool is applied for Danish conditions. Fig. 9 shows how rc depends on the Henry’s law coefficient for typical range of values of K2d measured by Thyssen and Erlandsen (1987) (1 and 100 day-1). The calculations were made for a temperature of 15° C and a water depth of 1.37 m. As Henry’s law coefficient KH is usually only known for 25° C it was decided to plot rc as a function of KH at this temperature. In order to find Henry’s law coefficient at 15° C a correction for the difference in temperature was made assuming at heat of dissolution of –68000 J mol-1 (see Appendix A). It should be noted, that the Lillebæk stream on the island of Funen, for which the pesticide input is modelled within the integrated project is a shallow stream with a very steep slope and a high flow velocity, which often are outside the range for which the Thyssen and Erlandsen (1987) relation is valid. A K2d value of the order of 300 day.1 is often calculated for this stream. In the version of PESTDEP that is integrated in PestSurf KH at 15° C is used which is calculated from KH at 25 ° C assuming a heat of dissolution of –68000 J mol-1 (see Appendix A and G). Fig. 9. shows that there can be up to a factor of 100 difference in rc or kw for Danish streams due to variations in K2d that are cause by variations in the flow velocity, depth and slope. 2.6.2.2 Mass transfer in the water phase in lakes and slowly running waters where: Jähne et al. (1987) found that at low wind speed n = 2/3 and at higher wind speed n = 1/2. Csanady (1990) showed that a value of n = 2/3 is correct when the flow is adjacent to a solid boundary and a value of n = 1/2 is correct when the flow is adjacent to a fluid boundary. Field experiments show that in most cases n = 1/2 is appropriate (MacIntyre et al., 1995). This relation holds for lakes, estuaries and seas. An empirical relationship is used to describe the aqueous phase mass transfer coefficient for lakes, based on experimental data for 5 lakes (MacIntyre, 1995):
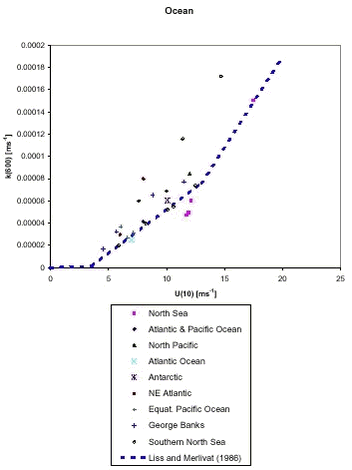
where: The reason to use k(600) in this equation is that the aqueous phase mass transfer coefficient is often normalised to Scw = 600, which is the Schmidt number of CO2 at 20° C in freshwater. By normalising the results of exchange experiments for different gases can be easily compared. The aqueous phase mass transfer coefficient for other gases can be easily calculated from k(600) with the following relation:
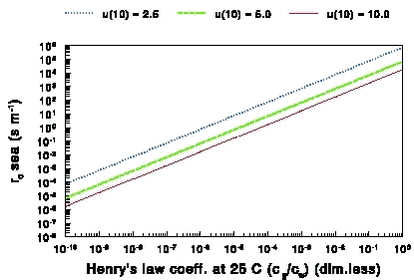
where kw is the aqueous mass transfer coefficient of the gas (m s-1).
|
