Facilitated transport of pesticidesAppendix C. Sensitivity analysis for colloid-moduleAt first, some preliminary tests were conducted. The detachment module was tested against a spreadsheet solution of the same equations and produced identical values for DET. Following the integration of the colloid module in the MSHE setup, some simple tests were made to determine whether the module behaved as could be expected. The flow setup was a simple one-column setup with a constant infiltration rate of 0,1 mm/h, and drainage lines at 1,1 meter depth. Two flow simulations were made, one including and one excluding macropores. The first transport setup included only colloids. All initial concentrations were equal to zero, and the colloids were generated by the colloid generation module and transported through the unsaturated zone. At first, filter coefficients in both domains was set to zero and the transport including and excluding macropores was compared. Following this the effect of the filtration coefficient was investigated.
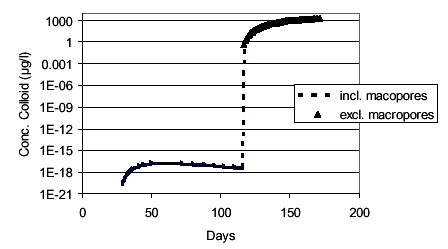
FIGURE 1. FIGUR 1. Figure 1 shows the concentration of colloids in the upper groundwater layer (corresponding to the concentration in drain pipe) for a simulation including macropores and the same simulation excluding macropores (dispersivity in unsaturated zone is zero). As can be seen, the macropores give rise to very small concentrations before any concentrations are seen without macropores. After breakthrough in matrix the two follow each other.
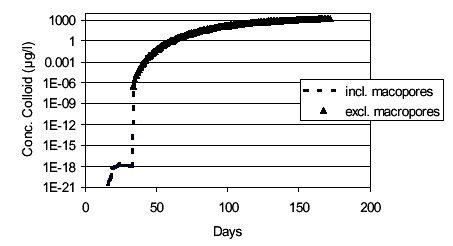
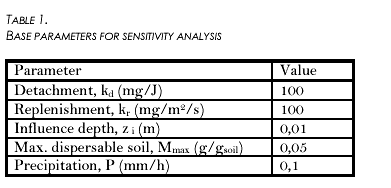
FIGURE 2. FIGUR 2. The same simulation was now performed with a longitudinal dispersivity of 0,05 m in the unsaturated zone. Because of the changed dispersivity, the breakthrough from matrix now occurs much earlier, however still the macropore breakthrough is the fastest (see Figure 2). The macropore setup was maintained, and a sensitivity analysis on the colloid generation parameters was performed. The values from which variations were made is shown in Table 1 below.
With respect to the detachment coefficient kd, there is a linear relation between the coefficient and the concentration of colloids. In situations where Ms reaches values around Mmax, there is also a linear relation between Mmax and the concentration of colloids (not shown). For the replenishment coefficient kr, the sensitivity is the highest, when values are small, since at this point the fraction Ms/Mmax will not dominate the replenishment expression. With regards to the precipitation, the kinetic energy of the rain will become larger than zero only when the precipitation exceeds an intensity of 0,09 mm/h. Results with regards to breakthrough time are not very sensitive towards the diffusion coefficient βc. |