Market information in life cycle assessment
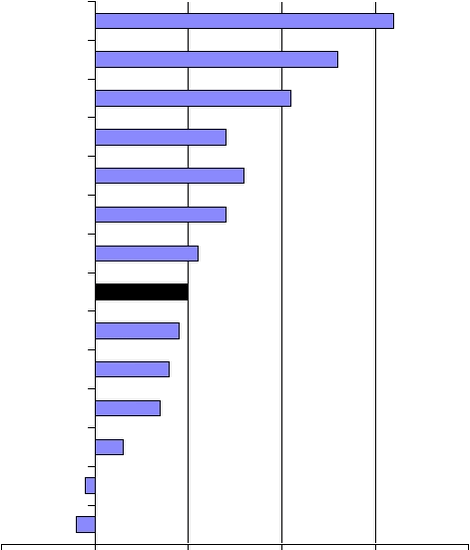
Figure 3.2. The distribution of 1% growth in private consumption in the
period 1977-1997 in Denmark. Calculated by the Copenhagen Institute for
Futures Studies
-1
0
1
2
3
4
Fuel
Beverages/Tobacco
Food
Clothing/Shoes
Furniture/Housing
Union fees
Total consumption
Medicine/Doctors
Transport
Communication
Art
Entertainment
Tourism/Travel
Membership fees
|