|
| Front page | | Contents | | Back | | Printing instructions |
Waste Statistics 2002
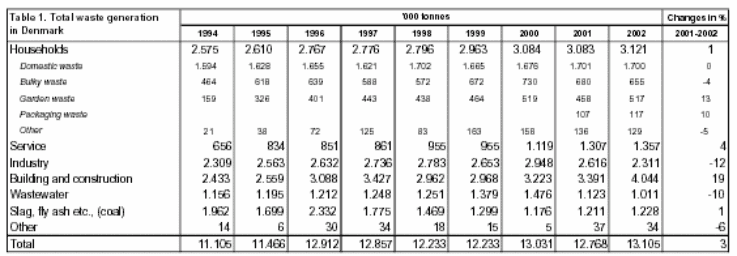
Table 1. Total waste generation in Denmark

Source: ISAG; Danisco; the Association of Danish Recycling Industries and large scrap dealers; Elsam; Energi E2; and Reports to the Danish EPA on sludge from municipal wastewater treatment plants
applied to farmland etc. and incineration of sludge at sludge incineration plants. (The figures for sludge for recycling and incineration are 2001 figures.) Sludge amounts are stated in wet weight, excluding
however sludge for mineralisation which has been adjusted to 20 per cent dry matter. This applies to figures from 2001 and onward. Sludge for long-term storage has been included in sludge amounts
applied to farmland etc. Sludge for recovery has been included in sludge amounts for incineration. The figures do not include imports of waste. Waste generation is stated as the amounts of waste delivered to
treatment plants from all primary sources. Primary sources include waste generation from sources other than waste treatment plants (reprocessing plants, incineration plants, composting/biogas plants and
landfills). Slag, fly ash, and flue-gas cleaning products from waste incineration plants have therefore not been included in the calculations, since this would mean a double registration of the waste. Waste from
the primary source "recycling centres/transfer stations" has been allocated to other primary sources. The principles behind this allocation are explained in Annex 2.
| Front page | | Contents | | Back | | Printing instructions |
Version 1.0 March 2004, © Danish Environmental Protection Agency
|