|
| Front page | | Contents | | Back | | Printing instructions |
Waste Statistics 2002
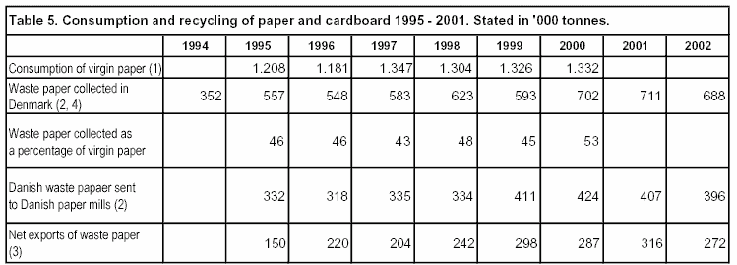
Table 5. Consumption and recycling of paper and cardboard 1995-2001. Stated in '000 tonnes.

Source: (1) Material flow monitoring of collected waste paper. (2) ISAG reports. (3) Statistics Denmark. In Waste Statistics 2001, net exports of collected waste paper in 2001 were calculated at 258
tonnes. The final figure from Statistics Denmark is 316 tonnes. (4) Some of the increase from 1999 to 2000 is explained by a correction of registrations in the ISAG. Thus, in connection with the quality
control of reports in 2000, around 100,000 secondary sources were reallocated to primary sources. The relevant waste treatment plants have (probably) also registered these sources incorrectly in previous
years, which may partly account for the differences in calculations of collected waste paper arisings by the ISAG and the monitoring of collected waste paper material flow (Danish waste paper delivered to
Danish paper mills and Net exports). The increase in amounts of paper from trade/offices and the decrease in amounts of paper from households are probably due to problems with registration of waste
between primary and secondary sources. In connection with the quality control carried out by the ISAG, Smørum Papir stated that they no longer receive waste paper from households. This alone means an
increase of 45,000 tonnes from 2000. No other plants have apparently registered similar increases. The figures for waste paper collected in Denmark in 2000 and 2001 were registered incorrectly as 735
and 709 respectively. Corrected figures are shown in Table 5.
| Front page | | Contents | | Back | | Printing instructions |
Version 1.0 March 2004, © Danish Environmental Protection Agency
|