|
| Front page | | Contents | | Back | | Printing instructions |
Waste Statistics 2002
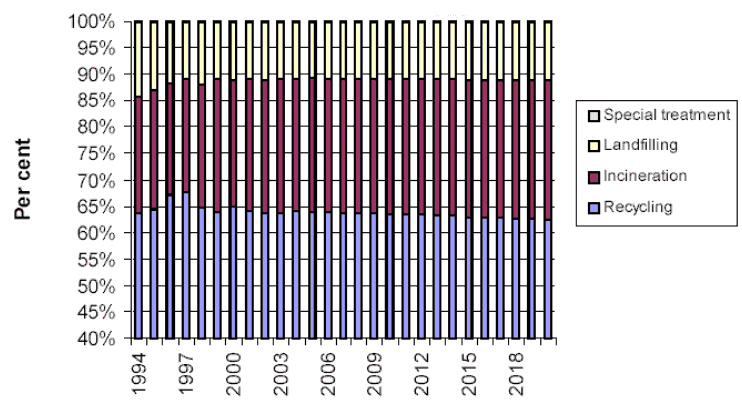
Figure 28. Trends in percentage distribution of waste by treatment option. Base scenario.

| Front page | | Contents | | Back | | Printing instructions |
Version 1.0 March 2004, © Danish Environmental Protection Agency
|