|
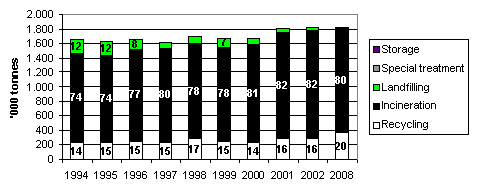
Waste Statistics 2002 5 Individual waste sources and status in relation to targets for 20085.1 Waste generated by householdsWaste from households covers the waste types domestic waste, bulky waste, and garden waste, which in turn are divided into individual fractions, e.g. paper and cardboard, bottles and glass, and food waste/other organic waste. Table 20 shows waste arisings by mixed and separately collected fractions to the extent these have been individually registered. This means that the stated amounts of e.g. paper and cardboard do not show the potential total amounts of paper and cardboard in household waste generation, but only the amounts of waste that have been separated and collected for recycling. The rest of the paper is part of the fraction "various combustible". Waste arisings in households in 2002 amounted to around 3,120,600 tonnes, which is an increase of 1 percentage point from 2001. Domestic waste amounts remain virtually unchanged compared to 2001 – showing only a slight fall of 723 tonnes. The increase in total amounts of household waste is therefore especially attributable to arisings in garden waste and packaging waste, which have increased by 13 per cent and 10 per cent respectively. Domestic waste, however, still makes up the largest part of total household waste generation, namely 54 per cent. Table 20 shows several shifts between the different household waste fractions, so that various combustible, paper and cardboard, garden waste, and hazardous waste have increased by 6 per cent, 6 per cent, 13 per cent, and 58 per cent respectively compared to waste arisings in 2001. These increases are balanced by a decrease in the fraction food waste/other organic waste, which has fallen by 18 per cent compared to the previous year. 5.1.1 Household waste per capita and per householdIn Table 21 household waste generation is stated per capita and per household. Amounts are moreover analysed between selected waste types and separately collected waste fractions. Total household waste generation per capita amounted to 581 kg in 2002, which is 14 kg more than in 2001. Household waste per household was 1,271 kg in 2002. Of these, domestic waste per capita and per household was 317 kg and 692 kg respectively in 2002. Compared to 2001, this means a slight fall of 1 kg per capita, while the amount per household decreased by 4 kg. 5.1.2 Domestic wasteDomestic waste generated by households covers ordinary waste from private household consumption. This includes paper, bottles, glass, organic food waste, and other waste. Usually, domestic waste is collected from households at regular intervals once a week or once every other week. As mentioned above, domestic waste amounted to 1,700,000 tonnes in 2002, which is 1,000 tonnes less than in 2001. Since 1994, domestic waste arisings have varied slightly from year to year, however, without showing any clear trend. Throughout the whole period from 1994 to 2000, arisings have increased by 2 per cent, cf. Table 3. In 2002, 16 per cent of domestic waste was recycled, while 82 per cent was incinerated and 3 per cent landfilled. The distribution among treatment options is thus unchanged compared to 2001. For the years before 2001, packaging waste is included as part of the waste type domestic waste. To make comparison with previous years possible, the 107,000 tonnes of packaging waste in 2001 and the 117,000 tonnes of packaging waste in 2002 have been included in the figures in Figure 7. Figure 7. Treatment of domestic waste from households 1996 - 2002 and target for 2008 (2001 and 2002 incl. Packaging waste)
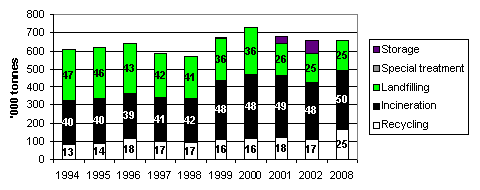
Source: same as Tables 1 and 2. Note that arisings in 2008 have been set to correspond to arisings in 2002. The figure is not intended as a projection of developments in waste arisings. As the table shows, the relative distribution in the period 1995 to 2001 among treatment options has varied only little. If considering the whole period, the trend since 1994 has shown that around 80 per cent of domestic waste is incinerated, whereas 15 per cent is recycled and 5 per cent is landfilled. Thus, too much domestic waste is still being incinerated and landfilled compared to the targets in Waste Strategy 2005-2008 It should be noted that domestic waste is considered suitable for incineration and therefore this waste must not be landfilled. If not recycled, domestic waste is to be incinerated. However, islands that are not connected by land to an incineration plant are exempt from this obligation. 5.1.3 Bulky wasteBulky waste generated by Danish households amounted to 655,000 tonnes in 2002. This is 25,000 tonnes less than in 2001. In other words, there has been a fall of 4 per cent in arisings. During the period from 1994 to 2002 bulky waste arisings increased by 8 per cent. The general increase was interrupted only by minor reductions in 1997, 1998, 2001, and 2002, cf. Table 3. The general increase in amounts of bulky waste is partly due to a real increase in arisings, but the establishment of waste-collection and waste-delivery schemes also plays a significant role. Figure 8 shows the distribution of bulky waste arisings between the three treatment options: landfilling, incineration, and recycling for the period 1994-2002. The period 1994 – 1998 shows an almost unchanged distribution between treatment options: incineration around 40 per cent, landfilling around 44 per cent, and recycling around 16 per cent. The rate of bulky waste for incineration rose to 48 per cent in 1999 and 2000, whereas the rate of waste for landfilling fell to 36 per cent in the same period. Figure 8. Treatment of bulky waste from households 1996-2002 and target for 2008
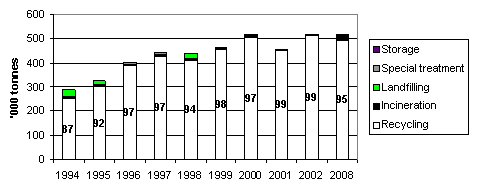
Source: same as Tables 1 and 2. Note that arisings in 2008 have been set to correspond to arisings in 2002. The figure is not intended as a projection of developments in waste arisings. In 2002, 48 per cent of bulky waste was incinerated, the rate for landfilling fell to 25 per cent, and the rate for recycling fell to 17 per cent. The remaining 10 per cent of bulky waste is stored temporarily until incineration capacity becomes available [17]. This means that the real rate of bulky waste for incineration is higher than 48 per cent. The target of a maximum landfilling rate of 25 per cent has thus been met. However, too much bulky waste is still being landfilled and not enough is being recycled. If targets for treatment in 2008 are to be met, considerable efforts are required to separate and collect more of the different waste fractions in bulky waste. A number of initiatives covering e.g. cardboard, waste electronic and electrical equipment, impregnated wood and PVC-containing materials have been or are in the process of being implemented. 5.1.4 Garden wasteGarden waste collected from households in 2002 amounted to 517,000 tonnes, which is 59,000 tonnes more than in 2001, corresponding to an increase of 13 per cent. Throughout the 1990s garden waste arisings have increased steadily. From 1994 to 2002 arisings have increased by 226 per cent. This increase does not so much reflect a real increase in amounts of garden waste. Rather, it is the result of increasing opportunities for households to dispose of garden waste at municipal treatment plants instead of home-composting the waste. This generates larger amounts of waste for treatment in the municipal waste treatment system. Garden waste treatment is presented in Figure 9. In 2001, 99 per cent of garden waste was recycled, and 1 per cent was landfilled. Figure 9. Treatment of garden waste from households 1996-2002 and target for 2008
Source: same as Tables 1 and 2. Note that arisings in 2008 have been set to correspond to arisings in 2002. The figure is not intended as a projection of developments in waste arisings. Thus, targets for recycling and incineration of garden waste from households have been met by a good margin. Estimates indicate that it is impossible to further increase the recycling rate. Future efforts with respect to garden waste will therefore concentrate on maintaining the present high recycling rate and reducing amounts treated in the municipal waste treatment system. Garden waste may be home-composted without permission from the local council, providing the rules of the regulation are complied with. Waste incineration is only allowed in plants that have been approved for the purpose. The local authorities may grant approvals for private incineration of garden waste. 5.2 Waste from the service sectorWaste generated by the service sector [18] amounted to 1,357,000 tonnes in 2002, which is 50,000 tonnes or 4 per cent more than in 2001. Figure 10. Waste from the service sector 2002, by mixed and separated fractions
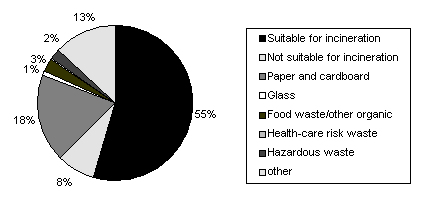
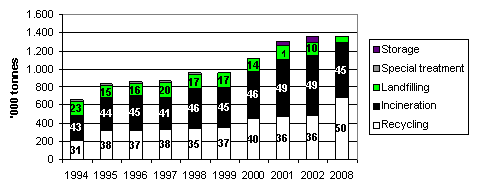
Source: ISAG reports 2002. Note that the key to the diagram starts with "waste suitable for incineration" shown as 55 per cent in figure, and should be read clockwise Waste from the service sector analysed by mixed and separated fractions is shown in Figure 10. The relative distribution is almost the same in 2002 as in 2001. Waste suitable for incineration and paper and cardboard are the two largest waste fractions generated by the service sector, making up 55 per cent and 18 per cent, respectively, of waste from this sector. The increase in amounts of waste from the service sector in 2002 is apparent in the fractions: waste suitable for incineration, paper and cardboard, glass, and other waste. These fractions increased by 9 per cent, 2 per cent, 2 per cent, and 13 per cent respectively compared to 2001. The fractions: waste not suitable for incineration, food waste/other organic waste, healthcare risk waste, and hazardous waste show reductions of 16 per cent, 18 per cent, 7 per cent, and 26 per cent respectively. Of the 1,357,000 tonnes of waste generated by the service sector in 2001, 36 per cent was recycled, 49 per cent was incinerated, 10 per cent was landfilled, and 5 per cent was stored temporarily, cf. Figure 11. The recycling and incineration rates for service sector waste remain unchanged from 2001. Landfilled waste amounts have fallen by 2 per cent, whereas amounts of waste in temporary storage have increased by 2 per cent. The waste put in temporary storage will be incinerated when incineration capacity becomes available [19]. Thus, the incineration rate is actually higher than the 49 per cent mentioned above. This means that there has been a shift from landfilling and temporary storage to incineration. Figure 11. Treatment of waste from the service sector 1996-2002 and target for 2008
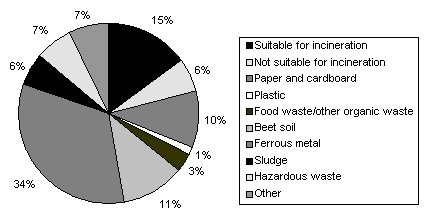
Source: same as Tables 1 and 2. Note that arisings in 2008 have been set to correspond to arisings in 2002. The figure is not intended as a projection of developments in waste arisings. Compared to the targets for treatment in 2008 in Waste Strategy 2005-2008, still too little waste from the service sector was still being recycled and too much was being incinerated and landfilled in 2002. If targets are to be met, separation and collection of waste must be improved so that a larger proportion of recyclable materials can be recycled, and so that environmentally harmful waste types can be separated and treated separately. 5.3 Waste from industryWaste generated by industry amounted to 2,311,000 tonnes in 2002, which is 305,000 tonnes or 12 per cent less than in 2001. Figure 12 shows waste from industry by mixed and separated fractions. It is seen that ferrous metals is by far the largest single fraction followed by the mixed fractions: waste suitable for incineration, beet soil, separated paper and cardboard. Figure 12. Waste from industry 2002, by mixed and separated fractions
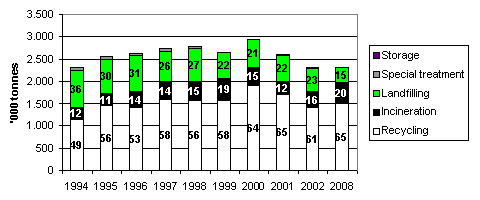
Source: same as Tables 1 and 2. Note that arisings in 2008 have been set to correspond to arisings in 2002. The figure is not intended as a projection of developments in waste arisings. The relative distribution of total industrial waste between the different fractions remained almost unchanged in 2002 compared to 2001. However, as mentioned above there has been a decrease in amounts of industrial waste of around 305,000 tonnes. The fall is primarily due to reductions in the fractions: waste not suitable for incineration, paper and cardboard, food waste/other organic waste, ferrous metals, hazardous waste, and other. These fractions fell by 15 per cent, 15 per cent, 35 per cent, 18 per cent, 6 per cent, and 25 per cent respectively. In contrast, the fractions: waste suitable for incineration, plastic, and sludge have shown an increase of 3 per cent, 3 per cent, and 23 per cent per cent respectively. This indicates that separation of recyclable waste, such as paper and cardboard, food waste/other organic waste, and ferrous metals, has been less dominant than in 2001. Industry experienced a fall in waste arisings of 11 per cent from 2000 to 2001; while the service sector saw a 17 per cent rise in waste generation. The shift between the two sectors may be due to faulty registration, as the source manufacturing etc. was discontinued from 2001as a result of amendments to the Statutory Order on Waste [20]. This means that waste from industry must be registered as originating from one of the 11 subgroups: food, beverages and tobacco; textiles, clothing and leather goods; wood-working and furniture; paper and graphical production; chemicals etc.; rubber and plastic; stone-working, pottery and glass; ferrous metals; other manufacturing; utilities; agriculture, forestry, fishery etc. It is likely that some carriers find it easier to register industry waste as service-sector waste. Incineration plants and landfills reporting to the ISAG are therefore encouraged to be aware of this possible source of incorrect registration. Changes in the industrial structure - the fact that society is changing from an industrial to a knowledge society - may be another reason for the shift between the two sectors. Whether the shifts between the two sectors are due to this development will be examined more closely before the publication of Waste Statistics 2003. The treatment of waste from industry is shown in Figure 13. In 2002, 61 per cent of the waste was recycled. In actual figures, this means that 1,403,000 tonnes were recycled in 2002, whereas 1,688,000 tonnes were recycled in 2001, corresponding to a fall of 285,000 tonnes. Figure 13. Treatment of waste from industry 1996-2002 and target for 2008
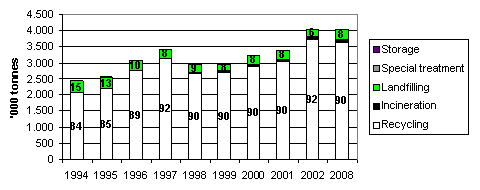
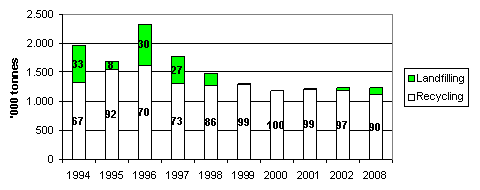
Source: same as Tables 1 and 2. Note that arisings in 2008 have been set to correspond to arisings in 2002. The figure is not intended as a projection of developments in waste arisings. The rate of industrial waste incinerated in 2002 was 16 per cent, which is a 4 percentage point increase from 2001. The rate led to landfill remained almost unchanged from 2001 at 23 per cent. This means that the 2008 target of landfilling a maximum of 15 per cent of industrial waste has not been met. Far too much waste from industry is still being landfilled. Even if the rates of recycling and landfilling have taken a positive direction since 1994, there is still some way to go before the 2008 targets for these two treatment options have been met. Amounts and composition of waste from industry depend on the sector generating the waste, as well as size and number of enterprises. Possibilities of preventing or recycling waste will therefore differ from one waste fraction and sector to another. In order to meet the targets in the Waste Strategy 2005-2008, the Danish EPA has selected a number of waste types from industry to come into focus. These waste types include waste from foundries and shredder waste, which are to be diverted from landfilling to recycling whenever environmentally and economically efficient. Through latest amendment to the Statutory Order on Waste the Danish EPA has implemented a number of changes to the ISAG system so that from 2001 it will be possible to analyse waste from industry between eleven different sectors. In future a number of enterprises [21] must in addition keep a register in a specific format with various information on their waste generation. This will enhance the possibility of conducting sector-specific analyses and targeted initiatives in industry. Waste generation in industry stated by sector and treatment option can be seen in Table 27. As apparent from the table, industry; food, beverages, and tobacco; paper and graphical production; ferrous metals; and other manufacturing contributed 80 per cent of waste from industry in 2002. 5.4 Waste from building and construction activitiesThe generation of waste in the building and construction sector was significantly larger in 2002 than in 2001 – construction and demolition waste reached 4,044,000 tonnes, which is 653,000 tonnes or 19 per cent more than in 2001. The increase is apparent in the fractions: soil and stone, and asphalt. These fractions increased by 111 per cent and 49 per cent respectively. In 2002, amounts of soil and stone reported to the ISAG increased by 693,000 tonnes. The great increase is due to the amendment to the Statutory Order on Waste which included 8 soil treatment plants as new reporting plants in the ISAG, leading to around 636,000 tonnes more soil and stone being registered. In 2001, only one of the plants reported around 45,000 tonnes of soil and stone. Moreover, a large crushing plant previously and incorrectly registered a large part of the crushed waste as originating from secondary sources. This means that amounts have not been included in the statistics, since this would result in double registration. The relevant waste amounts are now being registered correctly as originating from primary sources, which leads to an increase of 167,000 tonnes in total waste amounts from building and construction - an increase, which does not reflect an actual growth in waste arisings. By far the major part, or 92 per cent, of waste generated by the building and construction sector is recycled. The distribution of waste between the different treatment options changed in 2002 compared to the previous year: The recycling rate increased by 2 percentage points, whereas the landfilling rate decreased by 2 percentage points. Incineration was 2 per cent, cf. Figure 14. Figure 14. Treatment of waste from building and construction 1994-2002 and target for 2008
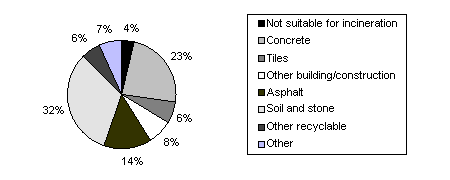
Source: See Tables 1 and 2. Note that arisings in 2008 have been set to correspond to arisings in 2002. The figure is not intended as a projection of developments in waste arisings. As the figure shows, the recycling rate for construction and demolition waste has increased by 8 percentage points in the period from 1994 to 2002. At the same time the rate of waste for landfilling has dropped 9 percentage points. The figure also shows that the distribution of waste between the different treatment options has been in line with targets for 2008 since 1997. The high recycling rate for construction and demolition waste is due partly to the fact that recycled waste, unlike landfilled or incinerated waste, is exempt from taxation, and partly due to a 1995 departmental circular [22] on municipal regulation regarding separation of construction and demolition waste intended for recycling. In addition, the Danish Ministry of Environment and Energy (now Ministry of the Environment) and the Danish Contractors' Association entered an agreement on selective demolition of buildings so that waste is sorted at an early stage. Figure 15 shows construction and demolition waste analysed between mixed and separately collected fractions in 2001. It is seen that the major part of separated building waste consists of concrete, asphalt, soil and stone. Figure 15. Waste from building and construction 2002, by mixed and separated fractions
Source: ISAG reports 2002. Note that the key to the diagram starts with "not suitable for incineration" shown as 4 per cent in figure, and should be read clockwise The increase in total amounts of construction and demolition waste is due to an increase in the fractions asphalt, and soil and stone, which have increased by 49 per cent and 111 per cent respectively compared to 2001. As mentioned above, this increase in the amounts of soil and stone is explained by the new reporting plants in the ISAG (8 soil treatment plants), and by a case of faulty registration. Most waste from the building and construction sector is reprocessed at mobile crushing plants that are used for different assignments at shifting locations throughout Denmark. The owner of the mobile crushing plant is responsible for the ISAG reports to the Danish EPA. However, sometimes the contractor also registers the waste. The Danish EPA is very much aware of this possible source of double registration, and great efforts are being made - in co-operation with the providers of the reports - to ensure quality control and avoid double registration. 5.5 Residues from coal-fired power plantsThe generation of residues at coal-fired power plants varies from one year to the next due to variations in Danish imports/exports of electricity to and from Sweden and Norway. Imports/exports of electricity to and from Sweden and Norway depend largely on precipitation in these countries – if there a lot of precipitation, a lot of electricity is generated from hydropower in Sweden and Norway, and Danish exports will be correspondingly lower. For example, in 1996 exports of power were particularly high, which is reflected in amounts of residues in this year, cf. Figure 17. In 2000, there was high precipitation in Sweden which resulted in so much cheap hydroelectricity on the market that power stations in both Denmark and Norway had to cease operations temporarily. Amounts of residues have decreased steadily since 1996. This decrease is explained partly by less power exports in the years since 1996, and partly by the Danish government's Energy Action Plan, "Energy 21", according to which natural gas and renewable energy sources, including bio-fuels, should substitute coal in the long-term perspective. Energy statistics[23] show that a decreasing part of electricity generation is based on coal. Also in future, Energy 21 will result in a decrease in residues from coal-based energy generation, whereas there will be an increase in fly ash and bottom ash from bio-fuels. Residues from coal-fired power plants amounted to around 1,228,000 tonnes in 2002, which is an increase of 1 per cent from 2001. As Figure 16 shows, 97 per cent of residues was recycled and 3 per cent was landfilled. Figure 16. Treatment of residues from coal-fired power plants 1996-2002 and target for 2008
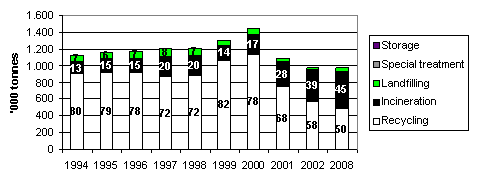
Source: same as Tables 1 and 2. Note that arisings in 2008 have been set to correspond to arisings in 2002. The figure is not intended as a projection of developments in waste arisings. In Table 30 recovery of residues in 2002 is stated in more detail. More than 90 per cent of residues is used as raw materials in industrial manufacture of, for example, cement, concrete and plaster board, whereas the remaining part is primarily used as backfilling either in accordance with the provisions of Statutory Order no. 655 of 27 June 2001 from the Ministry of the Environment, or as backfilling with special approval under the Danish Environmental Protection Act. 5.6 Sludge from municipal treatment plantsAs mentioned above, it was decided to state amounts of sludge for mineralisation with a dry matter content of 20 per cent, so that sludge for mineralisation would be stated with the same dry matter content as the remaining sludge. As a consequence, sludge amounts for incineration have been reduced by 1,040,934 tonnes. Residues from municipal treatment plants amounted to 1,011,000 tonnes in 2002, which is a decrease of 10 per cent or 112,000 tonnes from 2001. The statement only includes sludge, excluding sand and screenings. If stated in wet weight, sludge arisings from municipal wastewater treatment plants [24] would have amounted to around 2,052,000 tonnes in 2002, which is around 120,000 tonnes more than in 2001 or equivalent to a 6 per cent increase. The larger figures for sludge amounts when stated in wet weight are primarily due to new treatment technologies for sludge. They do not indicate that sludge arisings in general are increasing, but that a higher water content is stated in the statistics. Treatment of sludge from municipal wastewater treatment plants is shown in Figure 17. According to the Figure, 58 per cent of the sludge was recycled, 39 per cent was incinerated, and 3 per cent was landfilled. The figures for recycling include 84,400 tonnes of sludge with a dry matter content of 20 per cent, corresponding to 1,125,334 tonnes when stated in wet weight, which is treated in long-term storage with the objective of further mineralisation. Amounts are included in recycling as it is expected that this sludge will be recycled in the future. In the treatment in sludge mineralisation plants (long-term storage) sludge is registered with around 0.5 – 1 per cent dry matter, whereas alternatives typically contain 20 per cent. Sewage sludge is mainly recovered as fertiliser on farmland. In recent years, the requirements regarding contents of certain organic and chemical substances in sludge applied to farmland have been made more strict. In the short-term perspective, the rate of recycling is therefore expected to decrease. However, in future, the quality of sludge is expected to improve due to the general policy of phasing-out xenobiotic substances. Figure 17. Treatment of waste from wastewater treatment plants 1996-2002 and target for 2008. (The target of 45 % incineration corresponds to 25 % incineration and recycling of ashes in industrial processes, and to 20 % normal incineration)
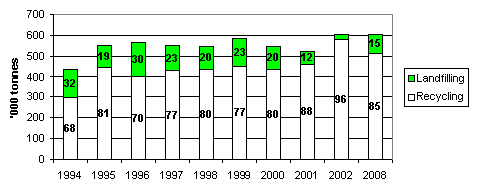
Source: same as Tables 1 and 2. Note that arisings in 2008 have been set to correspond to arisings in 2002. The figure is not intended as a projection of developments in waste arisings. The method of calculation of sludge for mineralisation has been changed with effect from 2001. The figures for recycling include 84,400 tonnes of sludge with a dry matter content of 20 per cent, corresponding to 1,125,334 tonnes when stated in wet weight. Long-term storage and incineration amounts include 139,555 tonnes for other uses (Carbogrit and production of concrete). It seems furthermore that alternative methods for the recovery of sludge are being developed to a still larger extent. After sludge incineration, the inorganic residue is recovered in the production of, for example, sand blasting agents, or cement. Sludge recovered by such alternative methods in 2001 [25] amounted to around 140,000 tonnes. In Figure 17 the 140,000 tonnes recovered by alternative methods have been included in incineration, as these treatment methods are considered as recovery and not recycling. 5.7 Residues from waste incineration plantsFigure 18 shows amounts of residues (slag, fly ash, and flue-gas cleaning products) from waste incineration plants 1994 – 2002 in tonnes, including treatment option. Residues from waste incineration plants have not been included in calculations of total waste generation, since this would mean a double registration of the waste. However, residues are a large waste fraction and to secure adequate capacity for their treatment a calculation of amounts is required. By far the largest part of residues is recycled – the rate of recycling was 96 per cent in 2002, which is 8 percentage points more than in 2001. Residues, however, are not recyclable when containing large quantities of heavy metals, which may leach into the environment and the groundwater. In such cases landfilling of the residues is required. Figure 18. Treatment of residues from waste incineration 1994-2002 and target for 2008
Source: See Tables 1 and 2. Note that arisings in 2008 have been set to correspond to arisings in 2002. The figure is not intended as a projection of developments in waste arisings. Contaminated fractions such as PVC, impregnated wood, and electric and electronic products, must not be incinerated. This means that contents of heavy metals in slag will be reduced significantly. However, recycling requirements will be made stricter out of consideration for groundwater. The 2008 target of 85 per cent recycling has already been met. Table 33 shows further treatment of residues from waste incineration plants. Naturally, amounts of residues depend on the amount of waste that is incinerated. Slag and flue-gas cleaning products typically comprise around 20 per cent and 5 per cent, respectively, of waste amounts led to incineration. Due to temporary storage at incineration plants amounts can, however, shift from one year to the next. Table 33 shows that residues from waste incineration amounted to around 628,000 tonnes in 2002. This is 88,000 tonnes more than in 2001. Out of the 628,000 tonnes of residues that in total were removed from waste treatment plants, around 148,000 tonnes were landfilled and around 524,000 tonnes were recycled. This means that stored amounts of fly ash and flue-gas cleaning products have been reduced by about 44,000 tonnes. From 1994 to 2002, amounts of landfilled residues have fallen by 28 per cent and the recycling rate has increased by 28 per cent. Footnotes[17] Exemption clause in Section 37(3), Danish Statutory Order on Waste (Statutory Order No. 619 of 27 June 2000) [18] The service sector covers the source: institutions, trade and offices. [19] Exemption clause in Section 37(3), Danish Statutory Order on Waste (Statutory Order No. 619 of 27 June 2000) [20] Statutory Order on Waste (Statutory Order no. 619 of 27 June 2000) [21] Enterprises subject to notification and approval, cf. Appendix 1 to Statutory Order no. 367 of 10 May 1992 on other activities than listed activities, with later amendments, and Appendix 1 to Statutory Order no. 646 of 29 June 2001 on approval of listed activities. [22] Circular no. 94 of 21 June 1995. [23] The latest Energy Statistics publication is on the Danish Energy Authority website: www.ens.dk [24] Figures for 2000 from municipal wastewater treatment plants on amounts of sludge applied to farmland and incineration of sludge at sludge incineration plants are not yet available. For recycling and incineration, 2001 figures from the Danish EPA's sludge statistics have been used, whereas for landfilling ISAG figures for 2002 have been used. [25] Figures for 2002 are not yet available.
|
