|
| Front page | | Contents | | Previous | | Next |
LCA and the Working Environment
8 Case study: An office chair
The chosen case – an office chair – has also been used in other parts of the LCA-method development and consensus project. One of the reasons for choosing this case is that large
parts of a LCA has already been performed, e.g. much of the necessary information was available also for the working environmental part of the LCA. No further data collection was
performed in the present project.
8.1 Making a flowchart
The starting point for the LCA is a component list for the product with information on material type, weight and applied processes (e.g. surface treated or injection moulded). In order to
create a better overview of the comprehensive list of components, it is suggested as a first step that a flowchart for the generic material types (plastics, steel, metals, paper, etc.) is
established.
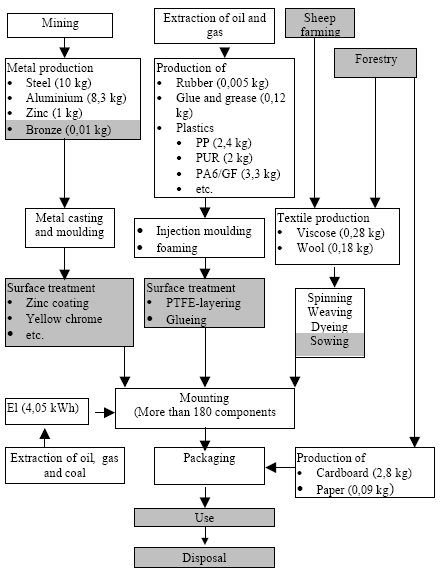
The flowchart for the office chair is shown in Figure 1. The shaded boxes show the activities that could not be included in the calculations because of missing information. This is for
example the case for forestry and surface treatment because the developed database does not contain data on these processes. Extraction of energy for transportation is also not
included because the actual consumption was not calculated in the basic information for the study.
Figure 1. Flow chart for an office chair. Shaded areas indicate that the requested information could not be found in the database.
8.2 Aggregation from the component list
The component list gives information on the amount of materials used in the product. Table 8.1 shows an excerpt from the component list for the office chair. In the calculations it is
assumed that the seat and back of the office chair will be replaced three times in the lifetime of the chair. The additional consumption of materials for this is included in the above figures.
Table 8.1. Excerpt from the component list for the office chair.
| Number |
Name |
Material |
Amount (in g) |
| 1 |
Glider EGO f. back |
Aluminium |
450,0 |
| 1 |
Screw spec. 3 x 7 |
Steel |
1,4 |
| 1 |
Catch EGO f. right |
Steel |
55,0 |
| 1 |
Spring EGO f. catch |
Stainless steel |
2,2 |
| 1 |
Screw, mach. M3x6 |
Steel |
0,4 |
| 1 |
Trigger chip EGO |
POM |
2,6 |
| 1 |
Stop EGO f. back tilt. |
Zinc |
73,0 |
| 2 |
Brake block f. back tilt |
Rubber |
0,8 |
| 2 |
Bearing EGO upper |
POM |
0,6 |
| 1 |
Top cover |
ABS |
62,0 |
| ... |
... |
... |
... |
The office chair is made from more than 180 components that can be aggegated with respect to the basic material type and the weight (Table 8.2).
Table 8.2. Material content in the office chair.
| Material |
Aggregated from |
Weight |
| Steel |
Steel, stainless steel, sintered steel |
9830,7 g |
| Aluminium |
|
6413,0 g |
| Zinc |
|
941,7 g |
| Bronze* |
|
10,4 g |
| Rubber |
|
4,4 g |
| Basic chemicals |
Glue and grease |
97,0 g |
| Plastics |
POM, PA6, PA66, ABS, PP, polyester and PUR w. melamine |
8205,9 g |
| Viscose/wool |
|
462,4 g |
| Total |
|
25965,5 g |
| |
|
|
| Packaging |
|
|
| Paper |
|
18,3 g |
| Cardboard |
|
2820,0 g |
| Plastics |
PP and PA6 |
85,1 g |
| Total |
|
2923,4 g |
* Not included in the calculations
The data in Table 8.2 are used as the basic input for the calculations of the impacts from raw material production. The main aggregation is that different types of steel and plastics are
found under one heading for each material as it is not possible to make further discrimination with regard to raw material production in the database. When dealing with plastic
production, it should be observed that one kilo of primary plastic as a rule of thumb requires two kilos of raw materials. For convenience, it can be assumed that the raw materials are
evenly distributed between oil and natural gas, i.e. one kilo of each per kilo plastic.
The component list is also used to specify the amounts of material that are processed further before becoming actual components. This is explained in section 8.4.
8.3 Energy and transportation
The impacts from production of energy raw materials and transportation are also included in the assessment.
The overall consumption of oil, gas and coal for energy production and material feedstock has been used for the calculations as no detailed information for the single materials was
available. Production of electricity is only considered for the assembly process at the producers as this was the only process for which this information was available.
For transportation, only national transportation in Denmark is considered and it is assumed that all transportation is performed by truck. Transportation between earlier parts of the
supply chain is not considered, but the extra transportation associated with replacement of seats and backs of the chair is included in the calculations.
The aggregated figures for consumption of energy raw materials and transportation are shown in Table 8.3.
Table 8.3. Energy and transportation data.
| |
Amount |
| Energy raw material |
|
| * Coal |
32,102 kg |
| * Oil |
26,4 liter |
| * Natural gas |
18,8 m3 |
| * Electricity |
4,05 kWh |
| Transportation |
26038 kg-km |
8.4 Matching the aggregated information with the database
An integrated part of aggregating the data in the component list is to find sectors in the database, for which the activities match those in the life cycle. Table 8.4 shows the sectors that
were chosen to match the activities in the life cycle of the office chair, both with regard to raw material production and the subsequent production steps.
Table 8.4. Sectors included in the calculations.
| Material |
Amount |
NACE-code |
Description |
| Steel |
9830,7 g |
271000 |
Danish iron- and steel works |
| |
692,5 g |
287400 |
Production of screws, springs etc. |
| |
9138,2 g |
287590 |
Production of other finished metal products |
| Aluminium |
6413,0 g |
274200 |
Production of aluminium |
| Zinc |
941,7 g |
274300 |
Production of lead, zinc and tin |
| Bronze* |
10,4 g |
|
|
| Rubber |
4,4 g |
251300 |
Production of rubber products |
| Glue/grease |
97,0 g |
241300/241400 |
Production of basic chemicals |
| Plastics |
8291,0 g |
241600 |
Production of basic plastics |
| |
8201,7 g |
252490 |
Production of other plastic products |
| |
85,1 g |
252200 |
Production of plastic packaging |
| Viscose/wool |
462,4 g |
171000 |
Spinning |
| |
462,4 g |
172000 |
Weaving |
| Office chair |
25965,5 g |
361110 |
Production of chairs and sitting furniture |
| Paper and cardboard |
2838,3 g |
212100 |
Production of paper and cardboard packaging |
| |
|
|
|
| Coal |
32,102 kg |
- |
Extraction of coal |
| Oil |
26,4 liter |
- |
Extraction of oil |
| Natural gas |
18,8 m3 |
- |
Extraction of natural gas |
| Electricity |
4,05 kWh |
401000 |
Electricity production |
| Transportation |
26038 kg-km |
- |
Road transportation |
* Not included in the calculations
Production of bronze is not included in the calculations because no sector in the database matches this activity directly. The potential error in this omission is however very small as the
amount of bronze in the office chair is almost negligible. If an increased level of detail is requested, bronze could be included by using other processes, e.g. a combination of production
of copper and production of lead, zinc and tin.
For steel and plastics, a number of sectors have been used to describe the life cycle, thereby giving the possibility for a more detailed assessment. For plastics, the life cycle starts with
extraction of oil and natural gas, followed by production of basic plastics and ending with production of plastic packaging and production of other plastic products. For steel, the life
cycle starts with production of steel and subsequently a division into production of screws and production of other steel products.
8.5 The calculations
The next step in the procedure is to multiply the information in Table 8.4 with the impacts per ton material that can be found in the database. It is of course important to remember to
include upstream processes for all materials. It is also important to observe that the units must match each other, e.g. weight is stated in tons.
The calculations can most easily be performed in a spreadsheet. One way of doing this is to make four columns with information on material, process, NACE-code and weight for each
of the flows identified in the component list and the flow chart. Subsequently, ten columns containing the headings of the effect categories are entered. In each of the cells in the matrix is
entered a formula of the type "=(A*B)", where "A" refers to the cell containing the weight of the component or material flow, and "B" refers to the cell where information on the relevant
impact per weight unit can be found.
It can be difficult to get an overview of the information in the complete spreadsheet, and in the next section it is suggested to aggregate some of the information as an optional step in the
procedure. The suggested types of aggregation are simple additions of processes and activities that can be combined under a relevant heading. In practice, this will require simple
spreadsheet management, e.g. by making a new worksheet where formulas of the type "= (E10 + F10 + J10)" are used for adding the same kind of impacts from different activities.
8.6 Creating a better overview
The information resulting from the calculation outlined in section 8.5 gives the most detailed overview on the sector level when the impacts are calculated, i.e. all sectors that are involved
in the life cycle are represented in the table. For more complex products the number of material and process combinations is often so high that it is difficult to create a graphic overview.
It is therefore suggested that the information is further aggregated by adding the life cycle impacts from groups of components, e.g. plastic components, steel components, etc. It should
be noted that the examples given in the next section are only suggestions. In principle, the method gives the possibility for all kinds of aggregation, and the final choice is left to the
practitioner.
As an example all processes involved in the production of plastic components are found under five headings in Table 8.4, i.e. "Extraction of oil", "Extraction of natural gas", "Production
of primary plastics", "Production of plastic components" and "Production of plastic packaging". These can be aggregated under one heading, "Production of plastics (components)". The
same can be done for the other basic materials used for the office chair as well as for energy production and transportation, thereby reducing the number of headings to a more
manageable number, about 10. This overview is shown in Table 8.5.
Another possibility (not demonstrated here) is to group the activities in relation to the phases in the life cycle where they take place. As an example, the impacts from production of steel,
plastic, aluminium, viscose etc. can be added under one heading "Production of raw materials". Another example is that production of screws, finished metal products, plastic packaging,
other plastic products etc. can be added under the heading "Production of components". Together with similar information on production of energy resources, transportation and
assembly it is thus possible to create an overview of the relative importance of the different life cycle phases.
Table 8.5. An example of a spreadsheet with aggregated information.
Click here to see the table.
8.7 Creating the graphic overview
It is relatively simple to use the aggregated information in Table 8.5 for a graphic presentation of the results, provided the practitioner has some general experience with spreadsheet
management. A number of possibilities are available and some of these are demonstrated in the following figures.
The first suggestion is to make a figure that illustrates the relative contribution from materials/processes to the total impacts from the product – the expected accidents and damages. This
overview is presented for the office chair in Figure 2.
Figure 2. The relative contribution of materials and processes to the overall impacts from the office chair.
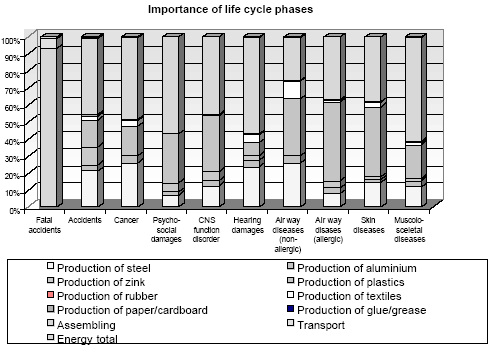
As can be seen from Figure 2, the assembly process is the most important process for many of the impact categories considered by the method. However, both plastics and steel also
have a large impact in some categories, e.g. plastics causes more airway diseases than both the assembly process and steel production.
It can also be seen from the figure that transportation only has a significant contribution to one impact category, accounting for about 10% of the expected fatal accidents. For all other
impact categories, transportation contributes only with an insignificant part. For energy production, the contribution cannot be observed in the illustration. It should, however, be
remembered that the database for production of electricity, especially extraction of coal, is of a poor quality.
Another type of overview can be created by looking at the absolute contribution to the single impacts from each of the materials and processes. An example is shown in Figure 3, where
the number of expected accidents per million office chairs is allocated to each of the materials and processes. This overview is often valuable as the database for accidents is the most
complete, i.e. this information has been collected for all processes.
It can be seen from the figure that the assembly process is the most important process with respect to the risk of accidents. It can also be seen that steel is more important than plastics.
This is not the case for other impact categories as indicated in Figure 2.
Figure 3. The contribution of single materials to the overall number of accidents in the life cycle of an office chair.
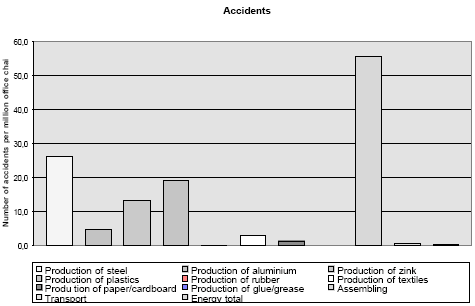
The materials rubber, glue and grease only account for a minor contribution, primarily because of their low weight. Energy production and transportation is also of minor importance.
8.8 Normalisation
The results from the impact assessment can subsequently be normalised in order to gain knowledge on which effects that are most affected by the activities in the life cycle of a product.
The normalisation is done by relating the expected number of accidents and damages to the average reporting frequency for an average Danish citizen. In practice, this is done by
dividing the number of accidents and damages from the product with the normalisation references given in Table 5.1. With this calculation, the impacts can be stated in person
equivalents, i.e. the same unit that is used for other impact categories in the EDIP method (1 person equivalent = 1 PE = 1000 milli person equivalents = 1000 mPE).
Figure 4 shows the normalised impacts from the office chair. It can be seen that the life cycle activities has the most significant effect on CNS-function damage, with an impact that
amounts to about twice as much as the other impact categories.
Figure 4. Normalised effects potential for the office chair.
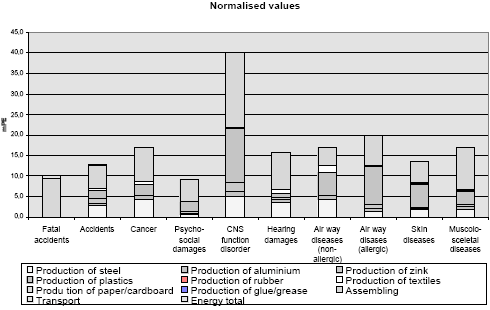
The effect potential measured in milli-person equivalents is an expression of how large a part of the annual impact on an average citizen that is caused by the production of an office chair.
With respect to CNS-function damage only 25 chairs can be produced before the average impact is reached, while for skin diseases, 77 chairs can be produced.
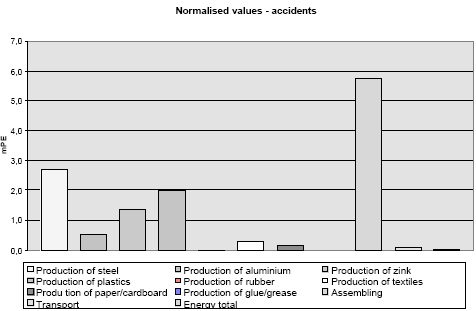
The normalised results can be further detailed in the same way as was done in the impact assessment. In Figure 5 is shown how the single activities contribute to the expected accidents.
It can be seen that the average annual impact from accidents in the assembly process is reached when each worker has assembled about 170 chairs. With respect to the steel used in the
chair, the average annual impact is reached when steel for 370 chairs has been produced and processed into components.
Figure 5. Normalised values for accidents in the life cycle of the office chair.
8.9 Further interpretation
The results emerging from each step in the impact assessment are open for a more detailed assessment and interpretation. For each of the materials used in the product it is thus possible
to distribute the impacts on the processes in the life cycle, normally 2-4 processes for each material. In doing so, a more precise assessment of where the largest impacts can be found is
obtained. This increase in the level of detail can easily be achieved with the established inventory and may be a better basis for a dialogue between suppliers and producers about how to
improve the working environment. In the case of the office chair an obvious choice will be to emphasise the need to avoid organic solvents, as these are a well-known cause of the
dominating effect, CNC-function disorder.
A second possibility is to compare the results from an assessment of two different types of office chairs. As indicated in the description of the method, there must be some significant
differences between two products in order to make a comparison. As an example, change from one type of plastic to another in a specific component will not change the impacts, unless
there is a difference in the weight of the two components. This type of comparison has not been performed in the present project as only information on one office chair has been
available.
A third possibility is to compare the results from the working environmental LCA with the results from the other impact categories in a "normal" LCA. With such a comparison the most
obvious goal of including the working environment can be fulfilled, i.e. that it is possible to see whether environmental improvement of products are implemented on the expense of the
working environment. This comparison with several types of effect categories has not been performed in the present study, as the results from the assessment of the impacts on the
natural environment or resource consumption are not known.
The method provides new possibilities to integrate the working environment into LCA. It is, however, emphasized that it is often the conditions at and prioritisations of the single
companies that is determining for the prevalence og working-related injuries. A company that has a certified management system for the working environment (e.g. OHSAS 18001) is
able to document efforts that go beyond regulatory demands. By choosing such a supplier it is ensured that their working environment is the best possible within the given sector and that
there is a possibility for improvement through dialogue.
| Front page | | Contents | | Previous | | Next | | Top |
Version 1.0 April 2004, © Danish Environmental Protection Agency
|