|
| Front page | | Contents | | Back | | Printing instructions |
Waste Strategy 2005-08
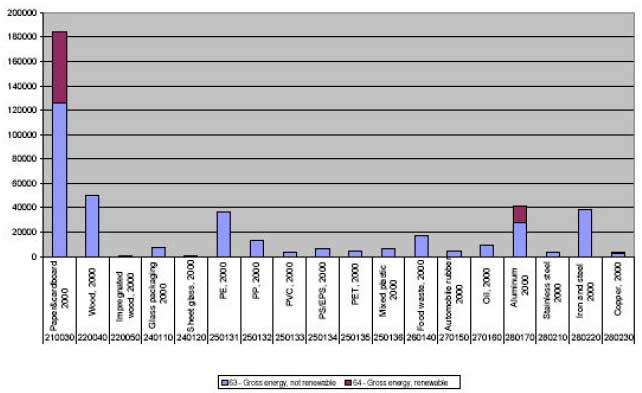
Figure 2.d shows how much energy we have saved based on the existing treatment of waste, compared to the situation if all waste were landfilled.
| Front page | | Contents | | Back | | Printing instructions |
Version 1.0 June 2004, © Danish Environmental Protection Agency
|