|
| Front page | | Contents | | Previous | | Next |
Appendix C
Comparisons of load profiles (Qactual/Qmax)

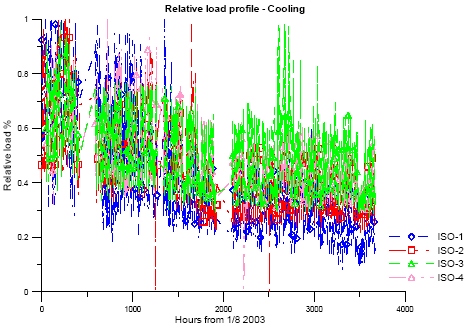
Figure C1. Load profile for cooling section for the period 1/8-31/12 2003

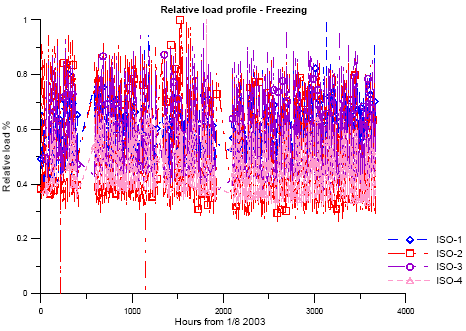
Figure C2. Load profile for freezing section for the period 1/8-31/12 2003

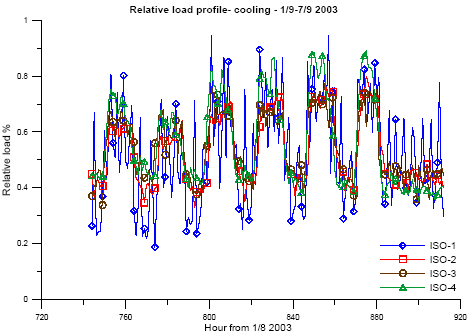
Figure C3. Load profile for cooling section for the period 1/9-7/9 2003

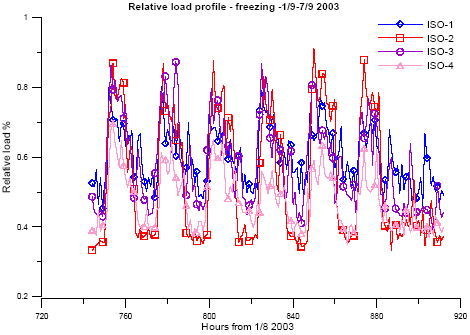
Figure C4. Load profile for freezing section for the period 1/9-7/9 2003
| Front page | | Contents | | Previous | | Next | | Top |
Version 1.0 September 2004, © Danish Environmental Protection Agency
|