|
| Front page | | Contents | | Previous | | Next |
Appendix E
Reference shop
Energy consumption determined on the basis of reference load profile and actual COP
Introduction
In order to be able to compare the energy consumption of the different supermarkets, reference must be made to a standard shop. The load for freezing and cooling in the reference
shop was determined on the basis of a load profile for the period 1/8 – 31/12 2003 and a maximum load for freezing and cooling respectively. A reference condensation temperature
was set at 30°C.
Procedure for determination of reference load
On the basis of hourly means of measured refrigeration capacity for the period 1/8 – 31/12 2003 measurements from ISO-2 were chosen for the generation of a relative load profile.
The relative load profile (qrel) emerged as the relation between the momentary load (Qactual) and the maximum load during the period (Qmax):
qrel = Qactual/Qmax
In Appendix B is shown the maximum load and the point when it was greatest. For the reference shop a maximum load of 110 kW on cooling and a maximum load of 40 kW on
freezing were chosen.
ISO-2 was chosen as reference for the non-dimensional profile because the measurements on this system constitute the most complete set of measurements among the sets from the four
systems. The load profiles from the four shops are compared in Appendix C.
Calculation of power consumption on the basis of reference load
Actual COP
Based on the measured data, the refrigeration capacity and the power consumption at the reference condensation temperature can be calculated as follows:
Actual volume flow is determined from the measured pressure ratio and suction temperature using the following expression:

with:
 : : |
Actual volume flow through the compressor |
 : : |
Volumetric efficiency |
| Pc |
Condensation pressure |
| P0: |
Evaporation pressure |
| Tc: |
Condensation temperature |
 : : |
Geometric compressor stroke volume |
| NCom: |
Number of compressors |
| IComCap: |
Compressor capacity in use |
The mass flow is, therefore:

with:
| v(T1,P0): |
Specific volume at suction stop valve |
| T1 |
Temperature at suction stop valve |
| P0: |
Evaporation pressure |
The "measured" refrigeration output is then:

with:
| h1(T1,v1(T1,P0)): |
Enthalpy at suction stop valve |
| h3(T3): |
Enthalpy after condenser |
| T3: |
Temperature after condenser |
and the corrected "measured" power consumption:

with:
| h2cor,is(T2cor,is,v2cor,is): |
Enthalpy after compressor at isentropic compression at reference
condensation temperature |
 : : |
Isentropic efficiency |
| Pc.cor: |
Condensation pressure at reference condensation temperature |
Tc,cor: Reference condensation temperature
and thus:

Reference energy consumption.
Conventional system.
The reference loads for cooling and freezing are determined as:

and the energy consumption is determined as:

with:
| Wtotal,ref: |
Calculated total energy consumption for reference shop |
| COPCool,measured,cor |
Measured COP for cooling in actual shop at standard condensation
temperature |
| COPFreeze,measured,cor: |
Measured COP for freezing in actual shop at standard condensation
temperature |
Cascade system
The refrigeration capacity and power consumption of the freezing section of the cascade system is calculated as indicated above when the system has separate circuits. The power
consumption of the freezing section of the reference system is thus:

with:
| Wfreeze,ref: |
Calculated power consumption for freezing in reference shop |
| COPFreeze,measured |
Measured COP for freezing in actual shop (NB! No correction
for condensation temperature) |
For the cooling section of the cascade system, the total load is the sum of the refrigeration load from the cooling appliances and cold store determined on the basis of reference load
profile and condenser output for the freezing section determined as the sum of refrigeration output and power consumption:

with:
| Wcool,tot,ref: |
Calculated power consumption for the high-temperature section
in the reference shop |
| COPCool,measured,cor |
Measured COP for cooling in actual shop at standard condensation
temperature |
The total power consumption for the cascade system is, therefore:

Results
Figures E1 and E2 show hourly means of the reference loads and the corresponding total power consumption respectively for the four systems during the course of a week where the
load was high. The power consumption of the pump is included for systems with pump circulation. Correspondingly, figures E3 and E4 show loads and power consumptions during the
course of a week where the load was low. Figures E2 and E4 show that for the same load profile ISO-1, ISO-2, and ISO-3 had almost the same power consumptions, whereas the
power consumption of ISO-4 was considerably higher.
All of the shops had comparable ambient operational conditions: in- and outdoor temperatures and humidity in the shops. See figures E5 and E6.
The reason for the considerably higher power consumption for ISO-4 must be attributed to the lower isentropic efficiency for the compressors, which were used under the existing
operational conditions (pressure ratio). The actual pressure ratios were considerably higher than the ratios, which would correspond to the built-in volume ratio. The three other systems
do not depend in the same way on the pressure ratio since their compressors are piston compressors. See Appendix A.
Conclusion
Based on the present results, it can be concluded that if the load profile is the same, then the cascade systems have the same power consumption as a conventionally constructed system
of standard dimensions with piston compressors.
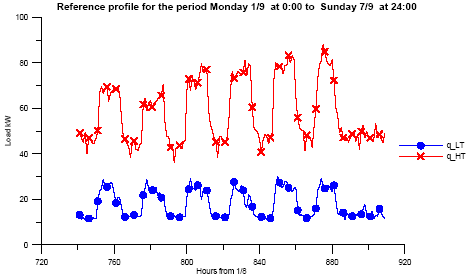
Figure E1. Reference load when load is high.
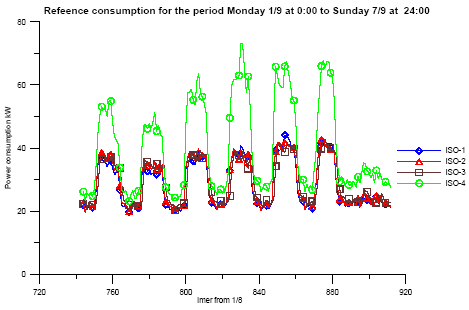
Figure E2. Power consumption when load is high
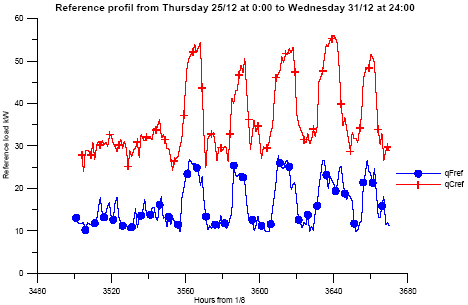
Figure E3. Load profile when load is low
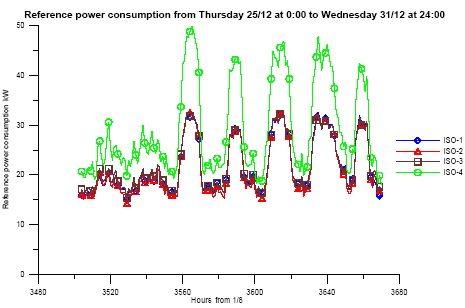
Figure E4. Power consumption when load is low
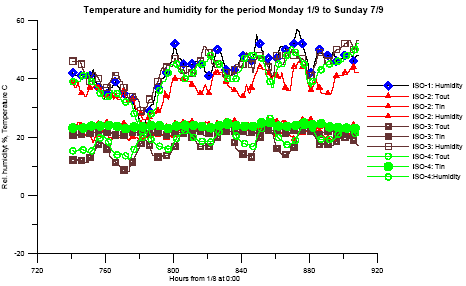
Figure E5. Humidity and temperature conditions when load is high
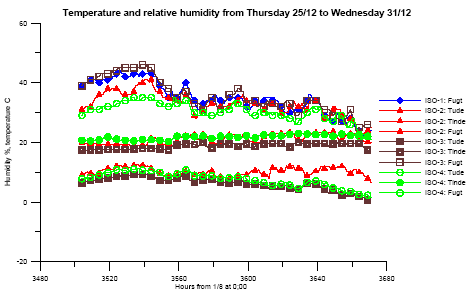
Figure E6. Humidity and temperature conditions when load is low
| Front page | | Contents | | Previous | | Next | | Top |
Version 1.0 September 2004, © Danish Environmental Protection Agency
|