|
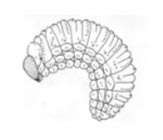
Biological Control of Weevils (Strophosoma melanogrammum and S. capitatum) in Greenery Plantations in Denmark 3 Implementation of molecular methods for identification of Strophosoma spp. larvae3.1 Introduction 3.1 IntroductionAdults of the two Strophosoma species, S. capitatum and S. melanogrammum, can easily be identified based on morphologically characters alone (chapter 1). In contrast, morphological characters are insufficient to distinguish between these species in the larval stages (Hansen, 1964; Scherf, 1964). Both larvae of S. capitatum and of S. melanogrammum are whitish, legless with chestnut-brown sclerotised heads and for both species, the cuticle is covered by small hairs (Fig.3.1). Detailed knowledge on life cycle, phenology and larval development is needed for a precise targetting of control measures against S. capitatum and S. melanogrammum, - knowledge which is not available (chapter 1). In order to obtain this knowledge it is, however, a prerequisite that the two species can be distinguished during the entire life cycle. The specific objective for this part of the project therefore was to implement molecular methods for identification of Strophosoma spp. in the larval stage leading to a detailed description of the life cycles of each of the Strophosoma species in question. This chapter describes briefly the background for the relevant molecular methods used and results obtained.
Figure 3.1: Drawing of a typical curculionid larva (Hansen, 1964). 3.1.1 The molecular methodsThe identification and characterisation of insects using DNA based techniques has during the last twenty years become increasingly important. The most widely used method is polymerase chain reaction (PCR). This method has been used for studying evolutionary ecology, species identification, population genetics, systematics and diversity. The overall principle in any PCR reaction is as follows: First DNA is isolated, then a mixture of DNA, primer(s), Taq polymerase, dNTP, MgCl2 and buffer is mixed in reaction tubes and placed in a thermocycler. Several cycles of (1) denaturation (93-95°C); (2) annealing (35-60°C) and (3) extension (72°C) are then repeated. After 30-40 cycles an enormous number of copies of the target DNA have been amplified and can be monitored by electrophoresis in an agarose gel. Primers can be designed to amplify either specific or random regions of the DNA. In specific priming, two different primers are designed so that they flank a specified target region of the DNA, one primer on each strand. The specified region between the two primers of the DNA is then amplified. Random priming involves amplification of random segments of the entire genomic DNA. In contrast to specific priming only one primer is normally used to amplify the DNA, and it is usually shorter than the primers used for specific priming. Because of the short length of the primer and less stringent conditions that allow mismatching, it anneals to several places of the genomic DNA. A DNA amplification product is thus generated for each genomic region that happens to be flanked by the priming sites. Both specific and random priming molecular methods are, after some development, presumed to be able to identify the larvae of the two Strophosoma species in question and a short introduction to the methods used and evaluated in this study is given. 3.1.1.1 Amplification of specific regionsAmplification of the ribosomal DNA (rDNA) or the mitochondrial DNA (mDNA) genes has become the most commonly used regions for specific PCR priming (Sheppard et al., 1994; Simon et al., 1994; Cano et al., 2001; Schulenburg et al. 2001). Mitochondrial DNA genes evolve approximately 16 times faster than the nuclear rDNA and will therefore often be useful for relatively closely related species. Amplification products of specific regions can be followed by either sequencing or restriction fragment length polymorphism (RFLP). In RFLP-PCR the amplified DNA is incubated with restriction enzymes that bind to and cut the DNA at specific sites within or adjacent to a particular sequence known as the recognition sequence (Sambrook et al., 1989). DNA sequences from the mitochondrial DNA genome are used with increasing frequency to estimate phylogenetic relationships among animal taxa (Simon et al., 1994). The cytochrome oxidase subunits I and II (COI + COII) have been sequenced from several insect orders including Coleopterans (Sheppard et al., 1994; Simon et al., 1994). The COI and COII subunits can be isolated via PCR from almost any taxon, using conserved primers. 3.1.1.2 Amplification of unspecific regionsRandom amplified polymorphic DNA (RAPD) was developed in 1990 (Williams et al., 1990). It is a method for fingerprinting DNA. RAPD-PCR analysis involves amplification of random segments of entire genomic DNA. Usually, short (10 base) oligonucleotide primers are used to amplify the DNA. A DNA amplification product is generated for each genomic region that happens to be flanked by a pair of 10 base priming sites. One big advantage is that DNA from any organism can be amplified without any prior knowledge of its sequences. Unsatisfactory reproducibility, however, is one of the disadvantages. Universally primed PCR (UP-PCR) is a variant of the RAPD method. UP-PCR is related to RAPD in being capable of amplifying DNA from any organism without previous knowledge of its DNA sequences. The advantage of this technique is higher reproducibility due to PCR primer features and use of high annealing temperatures (Lübeck et al., 1998). These methods are capable of distinguishing species and can therefore also be applied in different population studies of ecological relevance. There are several studies using RAPD-PCR within Curculionidae (Bas et al., 2000; Lewis et al., 2001, Madeira et al., 2001). Furthermore, RAPD has for example been applied to studies concerning plant pathogenic fungus on grape (Peros and Berger, 2003), ectomycorrhizal fungi (Huai et al., 2003), insect pathogenic fungi (Nielsen et al., 2001) and insect pathogenic bacteria (Rivera and Priest, 2003). There are, however, no reported studies on the genus Strophosoma. 3.1.2 Analysis of molecular sequence dataBLAST (Basic Local Alignment Search Tool) is a set of similarity search programs designed to explore all the available sequence databases regardless of whether the query is protein or DNA. The BLAST programs have been designed for speed, with a minimal sacrifice of sensitivity to distant sequence relationships. The scores assigned in a BLAST search have a well-defined statistical interpretation, making real matches easier to distinguish from random background hits. BLAST uses a heuristic algorithm that seeks local as opposed to global alignments and is therefore able to detect relationships among sequences that share only isolated regions of similarity (Anonym, 2003). BLAST was used to analyse the similarity in weevil DNA sequences obtained in this project and to compare these sequences with other sequences from weevils and other insects published in Nucleotide Sequence Databases (GenBank, RefSeq Nucleotides, EMBL (European Molecular Biology Laboratory), DDBJ (DNA Data Bank of Japan). For global multiple alignments (the entire sequences are aligned) the programs T-Coffee and CrustalW were used (Notredame et al., 2000; Gibas and Jambeck, 2001). These programmes are often used for phylogenetic reconstruction or for illustrating conserved and variable sites within a family or the sequences analysed. In the BLAST search and in the multiple alignments, references are given to sequence identity, which are the occurrence of exactly the same nucleic acid in the same position in two or more aligned sequences. An E-value is calculated and indicates the number of alignments one expects to find with a score greater than or equal to the observed alignments score in a search against a random database. This means that an e-value close to 0 indicates great similarity to the analysed sequence (Gibas and Jambeck, 2001). 3.2 Materials and methodsFor development and selection of specific primer sets it was decided to:
For selection of unspecific primers it was chosen to:
Both the amplification of specific and unspecific regions was evaluated for consistency by including S. melanogrammum and S. capitatum from several Danish localities as well as specimens from UK, Norway and Sweden. In addition, O. singularis from Denmark was included as an outgroup. 3.2.1 Extraction and amplification of DNA3.2.1.1 Weevil materialsDNA was isolated from adults of S. capitatum (DK, UK, SE, NO) and S. melanogrammum (DK, UK, SE,). Furthermore, Danish specimens of O. singularis were included as outliers. The weevils used in this study were either collected alive in the field or stored specimens (air-dried or stored in 70% ethanol). In order to evaluate the methods developed, DNA was also isolated from Danish larvae of S. capitatum, S. melanogrammum and O. singularis either stored in 70% ethanol, at –20°C or freeze-dried. 3.2.1.2 Extraction of DNATotal genomic DNA was extracted by 1) the use of the Nucleon PhytoPure Kit (Amersham Biosciences Europe GmbH), 2) a method based on the protocol of Bulat et al. (1998) or 3) Chelating resin (Chelex 100) (Sigma-Aldrich Co. St. Louis, USA) following the method described by Cano et al. (1993). 3.2.1.3 COI/COII amplifications and product analysisPCR amplification was carried out for the weevil material using the primers C1-J-2797 (C1) and C2-N-3380 (C2) for amplification of part of the COI/COII subunit (Table 3.1). Amplifications were performed in 0.2 ml PCR tubes containing a total volume of 25 µl in a solution containing 1 µl of template DNA, 250 µM of each dNTP, 0.8 µM of each primer, 1 unit Taq polymerase (Boehringer Mannheim, Germany), 2.5 µl PCR reaction buffer (100 mM Tris-HCl, 15 mM MgCl2, 500 mM KCl, pH 8.3) and 0.5 µl MgCl2 (25mM). A negative control was included in each experiment and prepared similarly but without DNA. DNA amplification was executed in a Perkin Elmer Gene Amp PCR system 9600 thermal cycler with the following PCR conditions for the COI/COII subunit: one cycle at 2 min at 94°C (denaturation), 1 min at 42°C (annealing), and 1 min at 72°C (extension) followed by 35 cycles at 1 min at 94°C, 1 min at 42°C, and 1 min at 72°C with a final cycle of 1 min at 94°C, 1 min at 42°C, and 5 min at 72°C. PCR products (10 µl) were loaded with 1 x loading buffer (10 µl; 50 % sucrose, 0.1 % bromophenol blue, 100 mM Tris, pH 8.0) and resolved on 1.5 % 20 cm long agarose gel added ethidium bromide in 1 x TBE buffer (50 mM Tris, 50 mM Boric Acid, 1 mM EDTA) at 120 Volt for approx. 2 ½ hours. A DNA ladder (0.1-1.5 kbp, BioLabs Inc.) was loaded on each gel in order to determine the sizes of the PCR amplification products (Sambrook et al. 1989). The PCR products obtained were in addition used for sequencing after purification with GFX PCR DNA and gel band purification kit (Amersham Biosciences, Europe GmbH). PCR products were sequenced on an ABI PRISM Genetic Analyzer (DNA Technology A/S, Denmark). 3.2.1.4 RAPD-PCR amplifications and product analysisRAPD-PCR amplifications were performed in 0.2 ml PCR tubes containing a total volume of 25 µl in a solution containing 1 µl of template DNA, 100 µM of each of the dNTPs, 0.9 µM primer, 0.5 units of Taq polymerase (Boehringer Mannheim, Germany), 2.5 µl reaction buffer (100 mM Tris-HCl, 15 mM MgCl2, 500 mM KCl, pH 8.3 (20°C)) and 0.5 l (25 mM MgCl2). PCR reactions were executed in the same PCR machine as above but using 40 cycles with the following temperature profile: 30 s at 94°C, 1 min at 36°C, and 2 min at 72°C. A negative control was included in each experiment. Several DNA concentrations were tested in PCR in order to ensure the reliability of electrophoretic banding profiles. Three out of 15 primers gave bands, which could be used to distinguish between the two Strophosoma species. The primers (OPA-03, OPA-13, and OPA-20) were each of ten nucleotides and produced by Operon Technologies Ltd (Table 3.1). RAPD-PCR products (10 µl) were processed in the same way as described in paragraph 3.2.1.3. 3.2.1.5 UP-PCR amplifications and product analysisUP-PCR amplifications were performed in 0.2 ml PCR tubes containing a total volume of 20 µl in a solution containing 1 µl template DNA, 100 µM of each dNTPs, about 0.5 µM primer, 1 unit of Taq polymerase (Finzym, Finland), in 1.8 µl of the reaction buffer and 2 µl MgCl2 (25 mM). Conditions for DNA amplification was 35 cycles of 94°C for 3 min, 55°C for 70 s and 72°C for 1 min, and 28 cycles of 50 s at 92°C, 70 s at 55°C, and 1 min at 72°C. A final cycle was performed of 50 s at 92°C, 70 s at 55°C and 3 min at 72°C. A negative control was included in each experiment. UP-PCR products (10 l) were processed in the same way as described in paragraph 3.2.1.3. Six universal primers were used: 3,2, AS15, AS4, L15-AS19, L21, L45 and FOK1 (DNA Technology A/S, Denmark) (Table 3.1). Table 3.1 List of primers used in this study.
3.2.2 Search in Genbank and related bases with BLASTAt the web site http://www.ncbi.nlm.nih.gov/BLAST/ the “Standard nucleotide-nucleotide BLAST [blastn]” or “MEGABLAST” search programme was chosen to compare the known weevil sequences against sequences in Genbank. 3.2.3 Alignments BLAST, T-Coffee and ClustalWPairwise BLAST (http://www.ncbi.nlm.nih.gov/blast/bl2seq/bl2.html) was used to compare the similarity between two known weevil sequences. The programme `blastn' was used and the parameter for a match was 1 and –2 for a mismatch. Multiple sequence alignments were done for the weevil sequences of good quality. The program T-Coffee (http://www.ch.embnet.-org/software/TCoffee.html) (Notredame et al., 2000) and the program ClustalW (http://clustalw.genome.ad.jp/sit-bin/nph-clustalw) were used. 3.2.4 Design of Primers for the cytochrome oxidase subunits I and IIAfter alignments of the weevil COI and COII sequences, consensus and variable DNA sequences were found. One primer from the consensus Strophosoma DNA sequences was designed by using the program Primer 3 (http://www-genome.wi.mit.edu/cgi-bin/primer/-primer3_www.cgi) (Rozen and Skaletsky, 2000). Then different reverse primers were designed from the regions varying between S. melanogrammum and S. capitatum. Furthermore, primers were designed so none of the primers should be able to align to DNA sequence of O. singularis. Because of high AT-content in the weevil DNA sequences the Tm temperature was lowered in the PCR reactions with these primers compared to normal standard conditions. 3.3 Results3.3.1 DNA extraction from weevilsDNA was isolated from adults, small larvae and large larvae of Strophosoma. However, depending of the previous storage history as well as the DNA extraction method used different qualities of DNA were obtained (Table 3.2). For specimens caught alive all three methods gave high quality DNA, while for larvae stored in ethanol best quality of DNA were obtained with the Chelex-100 method (Table 3.2). Subsequently this method was the predominant method used for isolation of DNA from larvae. Table 3.2 DNA qualities obtained by three different extraction methods.
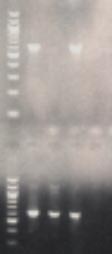
3.3.2 Weevil DNA sequences and PCR amplification3.3.2.1 COI/COII regions PCR productsWeevil DNA sequences from partly sequences of the COI + COII subunits were obtained by PCR. With primers C1 and C2 one band was obtained at approx. 590 bp (Fig.3.2). However, not all DNA samples produced a PCR-product.
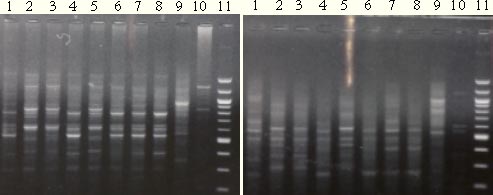
Figure 3.2. Five PCR products from the COI + COII subunits of S. melanogrammum and S. capitatum. 3.3.2.2 RAPD-PCR and UP-PCR productsThe RAPD-PCR primers OPA 3, OPA 13 and OPA 20 were able to identify the two Strophosoma species and O. singularis, giving three different band profiles (figure 3.3). The same could be proven with the UP-PCR primer L15/AS19 (figure 3.3).
Figure 3.3. Left: RAPD-PCR products (primer OPA 20). Right: UP-PCR products (Primer L15/AS19). Same DNA have been used in both gels, lane 1, 4, 7 = S. melanogrammum, lane 2 and 5 = S. capitatum, Lane 3 and 6 = mix of the two Strophosoma species, lane 8 = unidentified larva, lane 9 = O. singularis, lane 10 without DNA and lane 11= 100bp ladder. 3.3.3 Search in Genbank and related bases with BLAST3.3.3.1 COI and COII sequencesSimilarity between sequences obtained from S. melanogrammum, S. capitatum and O. singularis to other Curculionidae was especially found from the last part of the sequence (approx. 320 – 590 bp) that is part of the COII gene. Identities at 87% for a 234 bp sequence with E-value at 4 x 10-68 were found as the best match to the weevil, Brachyderes rugatus Wollaston. A DNA sequence in Genbank was also found of COI for S. melanogrammum (from Sweden) with the accession number AY196875, but no similarity was found to the known sequences of Strophosoma species when aligned. In the Genbank an O. singularis (AY196874) sequenced COI subunits was found, but no similarity was found to the known O. singularis sequence from this project. 3.3.4 Alignments BLAST, T-Coffee and ClustalW3.3.4.1 COI and COII sequencesGreat similarities at 95 to 99% identity were found within each of the two Strophosoma species (Table 3.3), while between the two species only similarities at 86 to 90% occurred. Less similarity was found when compared to O. singularis (78 – 80%) (Table 3.3). Table 3.3. Similarities between sequences obtained from own Strophosoma spp. and Otiorhynchus singularis by Pairwise BLAST.
3.3.4.2 Design of PrimersA primer from the consensus Strophosoma DNA sequences around 120 bp and different reverse primers from the end of the sequences with less similarity between the two species were designed (Table 3.4). The optimal PCR conditions for the new primers were found to be 35 cycles of 30 s at 94°C, 45 s at 55°C, and 45s at 72°C ending with one cycle of 30 s at 94°C, 30 s at 55°C, and 5 min at 72°C. When using the primer combination (Start Stroph. + End-sc4+End-sm3), a PCR product of approx. 250 bp and 350 bp were produced for S. capitatum and S. melanogrammum, respectively (figure 3.4). When using the End-sc2 primer instead of End-sc4 the length of the PCR product for S. capitatum was approx. at 300 bp. Table 3.4. Sequences of designed oligos primer
Figure 3.4. Agarose-gel with PCR-products from adult S. melanogrammum (first arrow) and S. capitatum (second arrow) plus unidentified Strophosoma spp. larvae. DNA from S. melanogrammum and S. capitatum gave a band at approx. 350 bp and 250 bp, respectively, using the primer combination Start Stroph. + End-sc4+End-sm3 Using the primer combination (Start Stroph. + End-sc2+End-sm3) or (Start Stroph. + End-sc4+End-sm3) it was possible to identify the Strophosoma larvae species. Selected Strophosoma sp. and O. singularis DNA samples were also tested by RAPD-PCR or UP-PCR and gave results consistent with the results obtained by the primer combination Start Stroph. + End-sc2+End-sm3 and Start Stroph. + End-sc4+End-sm3. 3.4 DiscussionSuccessful extraction and high quality of DNA is a prerequisite to obtain molecular data. Preserved specimens offer a challenge, and in studies of for example plants, the quality of DNA from herbarium specimens can often be poor (Drabkova et al., 2002). The possibility to include alcohol preserved specimens is important when considering soft and fragile larvae like Strophosoma larvae. We managed to obtain DNA from both individuals sampled alive and from some specimens preserved in alcohol. In the latter case, however, the quality of the DNA was not always sufficiently good for analysis. In a study on fungal pathogens in insects, Thomsen and Jensen (2002) included alcohol-preserved specimens and found that DNA could also be extracted in many cases. PCR methods have been used recently to sort out taxonomic problems within Curculionidae. Roehrdanz (2001) studied variation in the species Anthonomus grandis Boheman and could confirm specific geographical distributions of haplotypes. Peng et al. (2002) developed a tool to distinguish laboratory colonies of the closely related species Sitophilus oryzae (L.) and S. zeamais Motschulsky. A situation very similar to ours was studied by Weathersbee et al. (2003) who studied indistinguishable egg masses on two pest curculionids in Florida and designed primers useful to assist in the assessment of the pest status of each species. Our method basically confirmed the phenotypic characters available to distinguish adult specimens and validated that S. melanogrammum and S. capitatum are two valid taxonomic units (species). We were successful to separate larvae also by PCR giving for the first time a possibility to determine larvae of Strophosoma species, which have no clear phenotypic species characters. The phenological data obtained in our field studies are therefore also validated giving much more evidence to these studies. 3.5 Conclusion
|
|||||||||||||||||||||||||||||||||||||||||||||||||||||||||||||||||||||||||||||||||||||||||||||||||||||||||||||||||||||||||||||||||||||||||||||||||||||||