|
Survey of Estrogenic Activity in the Danish Aquatic Environment 6 Sources of estrogens6.1 Wastewater treatment plants (W WTPs) 6.1 Wastewater treatment plants (W WTPs)The estrogenic activity in municipal wastewater has been investigated in samples from 36 WWTPs divided into 6 categories, A-F, based on their process technology as described in more detail in Chapter 2. A total of 12 plants, two within each category, were selected for more detailed examination of variations in effluent quality and were sampled four times each during the project, while the other locations were only visited once. Effluent samples were taken each time at all plants, while influent samples were only taken once (early summer), and only at the 12 WWTPs selected for more detailed examination. All samples have been tested for their estrogenic activity by the YES assay, while only the samples from the 12 specially selected plants were also analysed chemically The samples have been analysed according to the previously described strategy and methodologies. Thus, for every sample two results from the YES assay exists (free and total estrogenic activity), and for the samples on which chemical analysis are performed, four estrogen species are determined with and without enzymatic treatment. The eight chemical values are recalculated into two corresponding results for estrogenic activity to allow comparison to the YES assay. The response factors used, relative to 17β-estradiol (E2), are for estrone (E1) 0.29 and for 17α-ethynylestradiol (EE2) 0.88. Estriol has also been tested, but its potency is very low (< 0.01). In the tables below, only data for the total estrogenic activity is given for the bioassay and for the calculated activity expressed as E2-equivalents (EEQ) based on chemical analysis. The detailed data for each of the specific steroid estrogens can be found in Appendix 8. Septic tank effluent data are not presented in this section, but in Section 6.3 under "Open land sources". 6.1.1 InfluentsThe influent data from the 12 selected WWTPs are presented in Table 6.1 and 6.2 for free and total (free + conjugated) estrogens, respectively. Estrogenic activity was detected in all influent samples. As it appears from the table, there is no systematic trend in the figures for the six plant categories, and it should be kept in mind that the selection of WWTPs for the detailed investigations did not include criteria related to the possible differences in estrogenic load. The average of the median results on total estrogenicity is 55.3 ng/L for the bioassay, and 28.8 ng/L for the chemical analysis. This difference is, based on the result of the comparison of control samples (Section 4.3.3), not statistically significant. A somewhat higher total estrogenic activity based on the bioassay seems probable as the test result includes all chemical substances with estrogenic activity, also those not determined by the chemical method but potentially present in the samples. Table 6.1 Median and max. content of free and total estrogenic activity in the influents to wastewater treatment plants in categories A-F. Measured with YES-assay and given as ng Estradiol equivalents/L. N, the number of samples, is separated into values <LOD, values >LOD, and all values.
Table 6.2 Median and max. content of free and total estrogenic activity in the influents from wastewater treatment plants in categories A-F. Three Individual estrogens measured chemically and recalculated to ng Estradiol equivalents/L. N, the number of samples, is separated into values <LOD, values >LOD, and all values.
The bioassay results for free and total estrogenic activity, respectively, are not systematically different, and hence they provide no indication that significant amounts of conjugated estrogenic species are present in the influent. The chemical results confirm that conjugates in untreated wastewater do not constitute more than a few percent of the total content of the measured steroid estrogens at the inlet to WWPTs. The chemical analysis confirm the results from studies published in the international literature that E1 (estrone) is the quantitatively dominating steroid estrogen in wastewater followed by E2 (17β-estradiol), for which the influent concentrations in this study are typically about 30% of those of E1. Ethynylestradiol is detected with the chemical analysis in seven of the 12 influent samples, but concentrations are relatively modest - up to 3.8 ng/L (total estrogens) - contributing 10% or less to the total E2 equivalents. 6.1.2 Effluents6.1.2.1 ConcentrationsThe results of the bioassay tests and chemical analyses of WWTP effluents are shown in Tables 6.3 and 6.4, and presented graphically in Figures 6.1-6.3. It should be noted that the results from the bioassay are not directly comparable with the chemical data as bioassay data exist from all 36 WWTPs, while chemical analyses have only been performed on samples from the 12 plants selected for more detailed examination. At the modern(ised) WWTPs in categories A and B, activated sludge systems are installed for removal of nitrogen by nitrification/denitrification or nitrification only (MBND and MBN plants; Cat. A and B, respectively). The estrogen levels in the effluents from these plants are only a few ng/L, as appears from the tables, and in 25% of the samples from Cat. A, the levels are even below the detection limit (Figure 6.1). It should be noted that these samples come from the same WWTP. Also the simpler treatment technologies such as reed beds and biological sand filters perform well, in particular the latter (Cat. F) for which only half the effluent samples contained detectable levels of estrogenic activity (Figure 6.1). In contrast to these, the effluents from the less advanced traditional treatment plants with biological-mechanical or only mechanical treatment of the wastewater (categories C and D, respectively) contain high levels of estrogens. The effluent levels are practically indistinguishable from the influent levels and, thus, these treatment technologies appear not to be capable of eliminating estrogens to any significant extent. In more than 100 effluent samples from a broad range of WWTPs we only found EE2 in concentrations exceeding 1 ng/L in seven samples from six WWTPs representing all categories except B. Due to its potency EE2 does occasionally account for a significant part (50%) of the estrogenic activity as measured in E2 equivalents, but most often approx. some 60-70% of the activity derives from E1 and 30-40% from E2. Table 6.3 Median and max. content of free and total estrogenic activity in the effluents from wastewater treatment plants in categories A-F. Measured with YES-assay and given as ng Estradiol equivalents/L. N, the number of samples, is separated into values <LOD, values >LOD, and all values.
Figure 6.1 Distribution of samples between ranges of estrogenic activity in the categories A-F of WWTPs. Based on results in ng E2 equivalents/L calculated from total estrogenic activity measured in the YES assay. Table 6.4 Median and max. content of free and total estrogenic activity in the effluents from wastewater treatment plants in categories A-F. Three Individual estrogens measured chemically and recalculated to ng Estradiol equivalents/L. N, the number of samples, is separated into values <LOD, values >LOD, and all values.
Figure 6.2 Logarithmic plot of Median and range of estrogenic activity in WWTP category A-F effluents as determined by the YES assay. Box upper bound represent 75 percentile, the lower bound the 25 percentile, and the line is the median value. The upper bar is the maximum value and the lower bar the minimum detected value. Non-detects are not included.
Figure 6.3 Logarithmic plot of Median and range of estrogenic activity in WWTP category A-F effluents as determined by chemical analysis. Box upper bound represent 75 percentile, the lower bound the 25 percentile, and the line is the median value. The upper bar is the maximum value and the lower bar the minimum detected value. Non-detects are not included. 6.1.2.2 Correlation with general performance parametersThe performance parameters for the individual WWTPs were compiled during the site selection phase of the project. A direct comparison between the estrogen data and the performance data is therefore not possible. However, data on the design capacity and current load, on performance parameters such as COD, BOD, total-N, total-P and suspended solids (SS) has been compared to the WWTPs' concentration of total esrogenic activity in effluents. An overview a selected few of the results for A-F categories are shown in Figure 6.4 below.
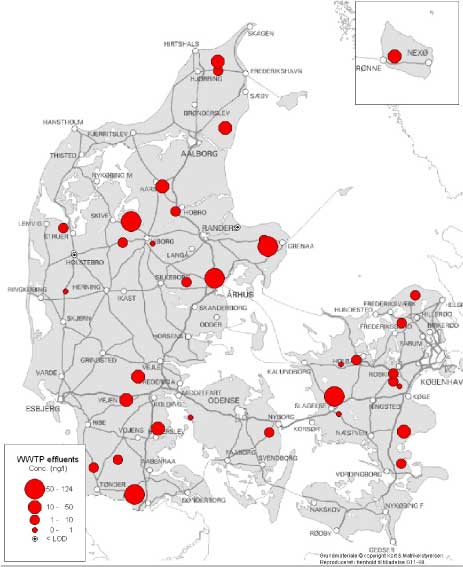
Figure 6.4 WWTP capacity and effluent performance parameters including estrogenic activity (YES) of the investigated 36 WWTPs (sorted by location number; A =1-10; B = 11-16; C = 17-22; D = 23-28; E = 29-32; F = 33-36). For Y-axis units, see legend box. From the general data on mean effluent quality of the WWTPs it has not been possible to detect any significant correlation with the measured estrogenic activity in the effluents. In Figure 6.4 above only capacity and nitrogen is compared to estrogenic activity. If one excludes Category F (biological sand filters), which appear most to the right in the graph, there seems to be a reverse correlation between capacity ("size") and estrogenic activity i.e. the small plants have more estrogens in their effluents than the larger plants. Similarly, some coincidence with the level of total nitrogen in the effluents is found. These parameters are not independent variables as the largest plants are also the most advanced in terms of tot-N and/or ammonia removal, typically receive more homogenous wastewater and are operated in the most efficient way, factors that in themselves should imply better performance. 6.1.2.3 Geographic variationsThe geographic localisation of the WWTP effluent data based on total estrogenic activity as determined by the YES bioassay are presented on the map in Figure 6.5. The map shows that there is no geographic trend in the effluent data. Effluent quality is, as demonstrated by the data in Section 6.1.2.1, mainly dependent on the treatment technology applied. A geographic variation in wastewater composition with impact on estrogenic activity is not expected, although parameters such as water hardness may vary. A demographic variation may be expected e.g. due to a relatively younger population in urban areas with less women in menopause and increased use of anti-contraceptive pills, but if such an effect exist it is masked by the increased occurrence of WWTPs of high efficiency.
Figure 6.5 Map of the localisation of the WWTPs with indication of the estrogenic activity in their effluents. For the 12 WWTPs where more than one effluent sample were taken, the mean concentration has been used for the map. 6.1.2.4 Seasonal variationsSeasonal variation of estrogenic activity in influents is not expected and has not been studied. However, in the inlet to a reed bed facility two influent samples were in fact taken during sampling 3 and 4 (summer and fall influent samples from plant E30). The results show no dramatic differences for total estrogenic activity: 57.9 vs. 43.7, or for free estrogens: 60.1 vs. 44.7 ng/L. Figure 6.6 Bar diagrams of total and free estrogenic activity (ng E2 equiv./L) in WWTP samples with four effluent samples Taken over eight months. The influent sample was taken during the third sampling (summer) and is shown first in each panel (A-1 is not shown as no estrogenic activity was detected in any sample. The influent to F-33 was not possible to sample). The observation from Figure 6.6 is again that most treatment technologies remove estrogenic activity except the C and D facilities, where influents and effluents do not differ. The variation in the free/total estrogenic activity ratio of the effluent does not appear to be related to the season, likewise free and total activity in the effluent samples are not related to season. 6.1.3 Species of estrogens and their distributionIn almost 100 effluent samples from a broad range of WWTPs we detected estrogenicity with the YES-assay in almost all samples. Estrone (E1) occurred in 53 of the 55 samples that were analysed chemically. In these samples, the median concentration of E1 was 9.9 ng/L. Similar data are listed for all steroid estrogens in Table 6.5 for sewage effluent and it can be calculated that E2, E2 and EE2 were detected in 42%, 29%, and 55% of all samples. Based on median concentrations we see that the concentrations of the analytes occurred in the following order: E1>E2>E2 >EE2. By calculating the ratios between the concentration of E1 and the other analytes the relative importance of each analyte can be assessed. Within the selection of samples representing 10-90 % percentiles of the ratios between E1 and the other compounds, E1 occurred at concentrations that were 3-16.5, 6.7-59 and 2.2-173 times higher than those of E2, E2 and EE2 respectively. In sewage effluent samples that were analysed chemically, it was found that in 50% of all samples E1 contributed with more than 79% of the total estrogenicity in each sample. Similarly we found that in only 15.7% and 12.2% of effluent samples more than 50% of the estrogenicity measured in the sample was due to E2 or EE2, respectively. Thus we can conclude that E1 in most effluent samples was the primary cause of the estrogenicity observed. The relative amount of steroid estrogens excreted from humans has been studied by D'Ascenzo (2003) who report that E1 account for around 65% of the release of steroid estrogens. If these numbers are corrected for the relative estrogenicity, E1 contribute with only 35% of the total estrogenicity. Therefore the high impact from E1 in the samples of the current project may be surprising. This may be explained by the oxidation of E2 to E1, a process which has been frequently reported (Lai et al., 2000; Colucci et al., 2001). Table 6.5 Presentation of chemical results for measurement of total estrogens in WWTP effluents (in ng E2 equiv./L). N<Lod denotes the number of samples where estrogens were detected at concentrations below the limit of detection and n>lod the number of samples above limit of detection. Nsamples is the total number of samples analysed. Median concentrations (ng/L) are calculated on basis of results above LOD.
In contrast to the other steroid estrogens analysed in the current project, EE2 is a synthetic substance and the compound has therefore gained special attention (see eg., Larsson et al., 1999). In more than 100 effluent samples from a broad range of WWTPs we only found EE2 in concentrations exceeding 1 ng/L in six samples from five WWTPs in the C-F categories. 6.2 Conditions in water courses receiving WWTP effluents6.2.1 Upstream and downstream estrogenic activityIt is anticipated that the discharge of WWTP effluent in water courses will lead to elevated levels of estrogenic activity. The levels of estrogenic activity in the receiving streams/rivers are much lower than in the effluents with only a few samples above 5 ng/L. Also, the proportion of samples below the detection limit is 28-32% with more frequent detections in the downstream samples (Figure 6.7).
Figure 6.7 Distribution of samples between ranges of estrogenic activity upstream and immediate downstream (10 x stream width) of WWTP discharge points. Based on results in ng E2 equivalents/L from total estrogenic activity measured in the YES assay. In the following Table 6.6, the estrogenic activity is shown for samples taken at the WWTPs: upstream, effluent and downstream 1 and 2 at distances approx. 10x width of stream and 100x width of stream, respectively. The total and free activity as determined by the YES assay is shown in Figure 6.8. Additional upstream/downstream data can be found in the previously presented figure on seasonal variations (Figure 6.6, section 6.1.2.4). An analysis of a total of 46 data sets from 34 out of the 36 WWTP locations and their receiving streams (one data set missing (L-19), one discarded (L-26)) shows that in 24 cases out of 35 where estrogenic activity was detectable (68%), the level of estrogenic activity at the downstream 1-position was higher than the upstream level. In five cases the levels were equal, while in six cases (17%) the upstream concentration was the highest. The chemical analysis of estrogens show that the predominant species is E1with E2 accounting for up to 30% of the activity. EE2 is only found in six samples of 37 samples from the waters receiving treated waste water (L17, 18, 29 and 33). The concentrations ranging up to 0.7 ng/L represent a contribution to the estimated estrogenic activity of 25-75% compared to other steroid estrogens. Table 6.6 Up and downsteam estrogenic activity in water courses receiving Effluent from a range of waste water treatment plants . U: Upstream, E: Effluent, D1: First downstream sample, D2: Second downstream sample.
6.2.2 Seasonal variation in receiving watersThe water courses receiving effluents from the 12 WWTPs selected for more detailed examination were targeted with sampling programme for seasonal variations involving two sampling campaigns at each selected site. The effluent sites were sampled upstream of the discharge points of the WWTP effluents and downstream at a distance corresponding to about 10x (in some cases also 100x; see Section 2.2 for details) the width of the river/stream. These samples are grouped under Category L. In Table 6.7 below a comparison is made between sets of Category L-samples taken at the same location either winter+summer or spring+fall to evaluate a possible systematic seasonal variation in the data. Table 6.7 Comparison of estrogenic activity in receiving waters of WWTP effluents measured in pairs of samples from two samplings performed either winter-summer or spring-fall.
* The estrogenic activity was below the detection limit in all L1-samples In 11 of the 12 samples taken, estrogenic activity was detected in at least one sample (total of 11 sites). The samples taken winter-summer or spring-fall show that at the five sites for which winter-summer data are available, the summer samples are higher. The picture in the spring-fall samples is less clear, but may be interpreted as highest level at the sampling time in the fall. There is no observable pattern in the free-to-total ratio of estrogens over the seasons. Absolute values are up to 3 ng/L total estrogenic activity.
Figure 6.8 Seasonal variation in Up and downstream free and total estrogenic activity in water courses receiving Effluent from wastewater treatment plants of different categories. Samples were taken on two occasions. U: Upstream, E: Effluent, D1: First downstream sample (10x stream width) D2: Second downstream sample (100x stream width, not always available). 6.3 Open land sourcesThe possible sources in the open land to contamination of the aquatic environment with estrogens constitute a quite diverse group (location categories G-K):
The results from categories G-I are presented in Table 6.8 and Table 6.9, while a table has not been created for category J because it contains only two data. Category K results are presented in table 6.10. A graphical presentation of the data from all five categories is made in Figure 6.9. In the five open land source sub-categories the proportion of samples without detectable estrogenic levels varies from 0 to 67% (100% including cat. J). It should be borne in mind that direct comparison of the median levels between categories is based only on the detected levels, which in the case of a significant number of non-detects will lead to conservative estimates of median values. For Category G, a total of eight samples (including surrogate samples) were tested by the YES assay and analysed chemically. It is noted that the observed estrogenic activity is somewhat higher than the average of WWTP effluents described in Section 6.1.2. This may be caused by the very limited degradation in the tanks and a relatively higher share of human urine and faeces in the effluents. In category H, drains from fields where manure was applied approximately 2 weeks before the sampling in the spring of 2004 (second sampling in September 2004), there are positive detections in 4 of the 8 samples, and in these samples the levels of total estrogens determined by the bioassay are low; from 0.1 - 1.1 ng/L. In category I, drains from fields amended with sludge before the first sampling in the spring of 2004, only five samplings from three locations have been possible to carry out during the study period. However, all five contain quantifiable levels of estrogenic activity. The results are shown in Table 6.8 and 6.9. In four of the five samples the total levels of estrogenicity range from 0.2-3.8 ng/L, while one sample (sampling in the fall at the same location where 3.8 ng/L was found in the spring) contained as much as 32 ng/L. This level is remarkably high, not least considering that the sample was taken several months after the sludge amendment, and therefore leads one to suspect that the drain also transports effluents from one or more farmhouses. The estrogenic activity measured by YES assay in the manure amended fields was low and caused by E1. It was not attributed to occurrence of the tracer for livestock E2, which also has a low potency. EE2 was detected in two open area sources: in a drain from fields treated with manure and in a septic tank effluent from isolated houses. Category J, retention basins for separate system urban stormwater, was only sampled once as the results showed that the runoff contained no estrogenic activity as determined by the bioassay. With regard to the fish farm data it is noted that at the spring sampling the levels were low at both locations and no systematic differences between levels up- and downstream the discharge point was apparent. In the fall, only the farm with mixed production (including rearing of sexually mature adults) was sampled, and a somewhat higher general level of estrogenic activity was observed compared to the spring as well as a more marked increase in downstream level as compared to the first sampling. Table 6.8 Median and max. content of free and total estrogenic activity in the septic tank effluents from isolated houses and in drains from fields amended with manure and sludge respectively. Measured with YES-assay and given as ng E2 equivalents/L.
* Category supplemented with influent data from F category Table 6.9 Median and max. content of free and total estrogenic activity in the effluents from isolated houses and in drains from fields amended with manure and sludge respectively. Three Individual estrogens measured chemically and recalculated to ng E2 equivalents/L.
* Category supplemented with influent data from F category Table 6.10 Estrogens in receiving waters up- and downstream discharge points from fish farms. Na = not analysed.
Figure 6.9 Distribution of samples between ranges of estrogenic activity in the categories G-K of sources in the open areas. Based on results in ng E2 equivalents/L from total estrogenic activity measured in the YES assay.
|
|||||||||||||||||||||||||||||||||||||||||||||||||||||||||||||||||||||||||||||||||||||||||||||||||||||||||||||||||||||||||||||||||||||||||||||||||||||||||||||||||||||||||||||||||||||||||||||||||||||||||||||||||||||||||||||||||||||||||||||||||||||||||||||||||||||||||||||||||||||||||||||||||||||||||||||||||||||||||||||||||||||||||||||||||||||||||||||||||||||||||||||||||||||||||||||||||||||||||||||||||||||||||||||||||||||||||||||||||||||||||||||||||||||||||||||||||||||||||||||||||||||||||||||||||||||||||||||||||||||||||||||||||||||||||||||||||||||||||||||||||||||||||||||||||||||||||||||||||||||||||||||||||||||||||||||||||||||||||||||||||||||||||||||||||||||||||||||||||||||||||||||||||||||||||||||||||||||||||||||||||||||||||||||||||||