|
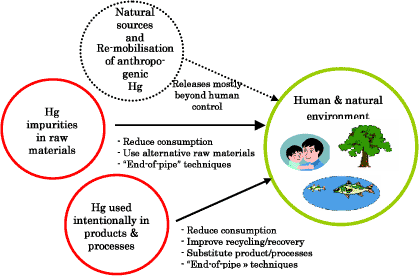
Arctic Mercury Releases Inventory 3 Sources and releases of mercury from Arctic countries3.1 Introduction to releases and cycling of mercury 3.1 Introduction to releases and cycling of mercuryThe nature of mercury releases can be summarised as follows (extracted from the Global Mercury Assessment; UNEP, 2002). The releases of mercury to the biosphere can be grouped in four categories:
Figure 3.1 shows these release categories with main types of possible control mechanisms. Figure 3-1 Categorisation of sources of mercury releases to the environment and main control options.
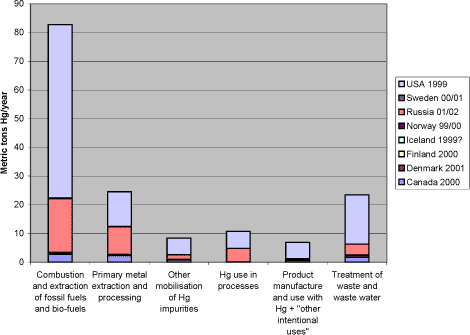
The recipients of mercury releases to the environment include the atmosphere, water environments (aquatic) and soil environments (terrestrial). There are continuing interactions – fluxes of mercury – between these compartments. Supplementary to figure 3.1, it can be mentioned that even for mercury releases already deposited in the environment, human activities such as water reservoir creation and land clearing, may result in enhanced bioavailability and re-mobilisation of the mercury present in the soil. Given the understanding of the global mercury cycle, current releases add to the global pool of mercury in the biosphere – mercury that is continuously mobilised, deposited on land and water surfaces, and re-mobilised. Being an element, mercury is persistent – it cannot be broken down to less toxic substances in the environment. The only long-term sinks for removal of mercury from the biosphere are deep-sea sediments and, to a certain extent, controlled landfills, in cases, where the mercury is physio-chemically immobilised and remains undisturbed by anthropogenic or natural activity (climatic and geological). This also implies that even as the anthropogenic releases of mercury are gradually eliminated, decreases in some mercury concentrations – and related environmental improvements – will occur only slowly, most likely over several decades or longer. However, improvements may occur more quickly in specific locations or regions that are largely impacted by local or regional sources." Figure 3.2 below shows a conceptual model of how mercury is cycling in the biosphere. The speciation of mercury, that is the chemical form mercury is present in, is an important factor in both the cycling and the adverse impacts of mercury. The species of mercury emitted to air vary among source types, and the further fate of the emitted mercury is also very dependent of the speciation. Mercury emitted as absorbed to particles, or in oxidised forms, will fall on land and water in the vicinity of the source (local to regional distances), while elemental mercury vapour can be transported with the air masses over hemispherical or global distances. These are important factors to consider when trying to establish links between releases and observed loads in the environment, for example when focusing on the impacts of specific sources to mercury pollution in a specific, vulnerable environment. Speciation is a key factor in the modelling of atmospheric transport and distribution of mercury emissions. The speciation of the mercury released is also a key factor in the efficiency of atmospheric emission reduction systems, mainly because particle-born and oxidised mercury is much easier to capture in these systems than elemental gaseous mercury. Also in the environment extensive transformation of mercury between the forms takes place. For example, while major parts of the mercury deposited on land may be oxidised, the re-emitted mercury from land is mainly in the elemental gaseous form. An important transformation process in aquatic environments (in water and wetlands) is the transformation in nature, of mercury released in elemental or oxidised forms, into methylmercury. Methylmercury is considered a main factor in normal human exposure, because it accumulates much easier in aquatic food webs than most other forms, and on top of this, it has stronger toxic impacts because it is more easily absorbed in vulnerable organs in humans and animals. Considerable research is ongoing regarding the transformation and cycling of mercury in the Polar Regions. Speciation plays an important part in the so-called polar "mercury sunrise", where large portions of the atmospheric mercury present is transformed, deposited and made bio-available within just a few months of the Polar sunrise. There are indications that this may perhaps result in and overall flux of atmospheric mercury to the Polar Regions, but evidence is still scarce. Figure 3-2 Conceptual model for the cycling of mercury in the biosphere. USA submitted speciated mercury release data for major mercury release point sources on their territory; see their response to the ACAP mercury questionnaire in appendices. For additional description of release and cycling principles, including mercury speciation in emissions from major release sectors and in the environment, see the Global Mercury Assessment (UNEP, 2002). 3.2 Releases to the atmosphere from the Arctic countriesWhile the quality and detail of the responses to the mercury questionnaire vary considerably, the reported atmospheric release data appear comprehensive and adequate for comparison between countries. 3.2.1 Breakdown of atmospheric releases by source category across countriesFigure 3-3 below shows a breakdown of the reported releases to the atmosphere on overview source categories across all the Arctic countries. The same data are presented in table 3-1. As regards direct releases to the atmosphere, the reported data confirm that combustion of carbon fuels, primarily coal, is the single largest mercury release source type in the region. The releases from this source category constitute about half (53%) of the total reported releases to the atmosphere from the Arctic countries. Coal combustion alone contributes with 44% (52.6 metric tons) of the total reported releases to the atmosphere from the eight Arctic countries(see table 3-4 below). This indicates that while some has already been done to reduce releases from coal combustion, it remains a potential for significant release reductions. The source of the mercury is natural mercury impurities in the coal. A breakdown of releases from this overall source group by individual source categories is given in table 3-4, section 3.2.3. The main source coal combustion is discussed further in section 4.1. The other two major overview source categories are primary metal extraction and waste treatment, respectively. The main contributions from the primary metal extraction sector are production of gold (mainly USA and Russia), zinc and zinc/copper (mainly Russia and Canada), and copper/nickel (mainly Russia) (based on: Questionnaires from this study; Environment Canada, 2002; ACAP 2004). The source of mercury inputs to this sector is natural mercury impurities in the used ore material. The same is the case for gold extraction, except for minor parts which originate from re-processing of tailings from previous gold extraction with the mercury amalgamation technology. Dedicated mercury mining does not take place anymore in any of the Arctic countries. The recorded releases from this sector do possibly not account for additional atmospheric releases from deposited extraction wastes, including flue gas cleaning residues (based on questionnaires in this study, Environment Canada (2002), and selected company release records at Canada's NPRI, 2003). The source category is discussed further in section 4.2. Regarding the reported releases from waste treatment activities, it is worth noting that the figures presented in figure 3-3 and table 3-1 mainly represent incineration of municipal waste and hazardous waste, while reported releases from recycling activities and "other waste treatment", including other sector specific industrial waste treatment, contribute only with minor releases in the reporting (see table 3.4). Disposal to waste treatment is generally the most important release pathway for products with intentional mercury use, such as dental fillings, thermometers, switches, light sources, measuring and control equipment. Even in countries like Denmark, which has a quite long history of reducing mercury inputs to waste, intentional mercury uses in products constitute a large part of the mercury inputs to municipal waste (UNEP, 2002; Skaarup et al., 2003). Some countries have reported small atmospheric releases from landfills/waste deposits, but the quantification of atmospheric releases from these sources should likely be considered under development and they may possibly be generally underestimated. As atmospheric emission reduction systems work by capturing mercury from exhaust air and transferring it to solid or liquid residues, significant amounts of mercury are continuously deposited with residues from these systems in all relevant sectors. Like mentioned for primary metal extraction, the presence of additional diffuse mercury releases from waste deposits can not be ruled out. The source category is discussed further in section 4.3. Figure 3-3 Breakdown of reported atmospheric mercury releases on overview source categories across the Arctic countries; metric tons Hg/year (data from questionnaires of this study and ACAP, 2004). *1.
Notes: *1: Note that the waste treatment category mainly represents incineration of municipal waste and hazardous waste. Industrial sector specific deposition is not included in this overview category. Comparisons among totals reported for the different countries should be made with caution, since the reported data for each country have differing levels of associated uncertainty, see section 2.2.3. Table 3-1 Breakdown of atmospheric mercury releases on overview source categories across the Arctic countries; metric tons Hg/year. Figures and notes same as in figure 3-3.
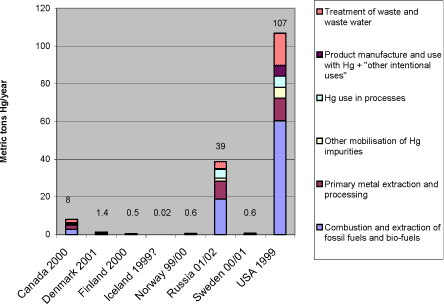
3.2.2 Breakdown of atmospheric releases by countryWhen the data in table 3-1 are presented in a breakdown by country, the reported release pattern in figure 3-4 is displayed. As shown, USA represents by far the largest contributions of mercury in terms of national totals among the Arctic countries. The Russian Federation comes second, while reported atmospheric releases from Canada and the smaller reporting countries are considerably lower. In this national perspective, it must be remembered that large parts of all the countries are situated outside the Arctic region it self. This means that only parts of their reported mercury releases have direct, local influence in the Arctic. Yet, according to the current understanding, mercury has a high residence time in the atmosphere (once emitted), and is therefore transported hemispherically or even globally (UNEP, 2002). This means that mercury releases originating outside the Arctic region it self may have significant influence on the mercury loads in the region, and releases from the whole area of all the Arctic countries are therefore relevant in the Arctic perspective. For an overview presentation of mercury's global cycling, see the global Mercury Assessment (UNEP, 2002). Figure 3-4 Reported national atmospheric releases in metric tons/year (data from questionnaires of this study and ACAP, 2004).*1
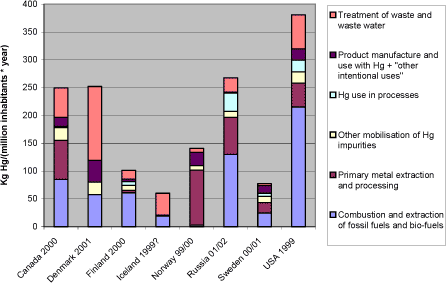
Notes: *1: Comparisons among totals reported for the different countries should be made with caution, since the reported data for each country have differing levels of associated uncertainty, see section 2.2.3. Figure 3-4 illustrates something about the shares of the atmospheric releases which can be controlled by individual countries. It does however not tell much about these countries' performance in management of mercury emissions. For a better understanding of this, figure 3-5 and table 3-2 show the reported atmospheric emissions as kg mercury released per million inhabitants. Figure 3-5 Reported atmospheric releases in kg mercury/year per million inhabitants, by country (data from questionnaires of this study).*1
Notes: *1: Population and GDP data from CIA's World Fact Book (accessed in summer 2003 at: http://www.odci.gov/cia/publications/factbook/index.html) . Comparisons among totals reported for the different countries should be made with caution, since the reported data for each country have differing levels of associated uncertainty, see section 2.2.3. Figure 3-5 and table 3-2 show, that in terms of atmospheric mercury releases per inhabitant, the countries are much more equal, yet some differences still appear. It should be noted that these figures may be quite vulnerable to uncertainties on estimates and differences in estimation methods between countries. Combustion of carbon fuels is a large mercury release source in countries where coal plays a large role in power and heat production. A comparison between the countries' mercury releases from power production, national consumption of electricity, and the relative importance of coal in its production is given in section 4.1. There is a growing recognition that extraction of oil and natural gas is also a potentially significant source of mercury mobilisation in some regions of the world. In Russia for example, the quantifiable releases from processing and use of oil products is estimated at least 3.4 metric tons/year (see table 3-4), while the fate of most of the mercury mobilised by oil extraction (possibly about 40 metric tons/year) is unclear. The metal production sector is much more complex and diverse than coal combustion. Yet, the magnitude of reported atmospheric releases from primary metal extraction are quite equal for Canada, Norway, Russia and the USA (when seen on a per capita basis), but does of course cower differences in types and amounts of metals produced and mercury releases per product output. Again it is reflected that waste incineration plays a major part in reported mercury releases from waste treatment. The relation between mercury releases and dependence on incineration as a waste treatment option is discussed further in section 4.3. The source group "Direct releases from products and other intentional uses" include dental amalgam fillings, batteries, thermometers, manometers, blood pressure gauges and education, switches, relays and contacts, light sources and "other products and processes". This is the category in the questionnaire that includes all other releases from the turnover of products than releases from their treatment in waste systems. These other releases are diffuse and difficult to quantify, and the releases are often estimated with high uncertainties or simply omitted in inventories. Some of these uses still remain in trade, and even in countries were the sale of some of these products are prohibited or have decreased, they may remain in use and circulation in society for many years before they are disposed off. Being globally traded products indicating possible equal inputs per person on national markets except in cases of bans, the higher reported releases from this source group from Denmark and Norway could perhaps indicate that these sources were more thoroughly accounted fore in inventories from these countries. Again it should however be remembered that the major releases from these products happen in the waste treatment phase. Table 3-2 Reported atmospheric releases in kg mercury/year per million inhabitants, by country (data from questionnaires of this study and ACAP, 2004).*1
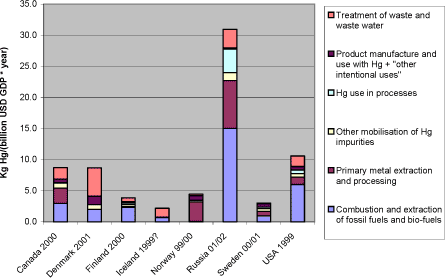
Note: 1*: Population and GDP data from CIA's World Fact Book (accessed in summer 2003 at: http://www.odci.gov/cia/publications/factbook/index.html) . Comparisons among totals reported for the different countries should be made with caution, since the reported data for each country have differing levels of associated uncertainty, see section 2.2.3. As an alternative normalisation basis, reported atmospheric mercury releases per GDP (Gross National Product) in billion US Dollars are shown in figure 3-6. The figure shows that in terms of mercury releases per national expenditure - partly a reflection of the material activity level - the Russian Federation lays substantially above the other Arctic countries. An important factor in this equation is of course the GDP per inhabitant ratios which are displayed in table 3-3. A firm interpretation of the figure is not easy, because the coupling of mercury turnover and releases, and an overall national economic summary figure like the GDP is not necessarily straight forward. But the figure could possibly indicate that the management of atmospheric mercury releases is less intensive in the Russian Federation than in the other Arctic countries. This may be useful to observe in the planning of mercury releases management, because the economic activity is expected to increase rapidly in the coming years. Figure 3-6 Reported atmospheric releases in kg mercury/year per GDP in billion US dollars, by country (data from questionnaires of this study).*1
Note: *1: Population and GDP data from CIA's World Fact Book (accessed in summer 2003 at: http://www.odci.gov/cia/publications/factbook/index.html). Comparisons among totals reported for the different countries should be made with caution, since the reported data for each country have differing levels of associated uncertainty, see section 2.2.3. Table 3-3 Population and GDP data for Arctic Countries and related summary figures for reported atmospheric mercury releases.*1,2
Note: *1: Population and GDP data from CIA's World Fact Book (accessed in summer 2003 at: http://www.odci.gov/cia/publications/factbook/index.html). For definition of GDP, see the reference. *2: Reported mercury release data from questionnaires and (ACAP, 2004) of this study. 3.2.3 Reported atmospheric and aquatic releases - by source typesA detailed presentation of the reported national releases to the atmosphere is given in table 3-4 below. Selected main release contributions by country and source category are marked in bold. For details on data sources, uncertainties, background data etc. see the questionnaire responses in appendices and (ACAP, 2004). A detailed presentation of the reported national releases to aquatic environments is given in table 3-5 below. These releases are less well documented than atmospheric releases, and have therefore not been included in the analysis to the same degree. The table shows that reported mercury releases to aquatic environments are dominated by the releases from waste water treatment. This indicates that the main source is intentional mercury use in products and processes. For details on data sources, uncertainties, background data etc. see the questionnaire responses in appendices and (ACAP, 2004). For data on releases to other media, see the national overview tables in section 3.3 and questionnaire responses and (ACAP, 2004) in appendices. Table 3-4 Overleaf: Detailed presentation of the reported national releases to the atmosphere in the mentioned years *1; metric tons Hg/year. See the questionnaire responses in appendices and (ACAP, 2004) for information on data sources, estimate uncertainties etc.
Note to table 3-4: *1: Data from Norway on dental amalgam fillings and extraction and use of oil, gas and biofuels are from 1999. For Sweden all reported data with value other than cero are from 2001, other reported data (0's) are reported as for 2000. Data for Russia are for 2001/2002. *2: Releases from coal combustion in Iceland roughly estimated here based on consumption data submitted by Iceland (150,000 metric tons coal/year) and the emission factor for coal in Denmark (0.04 g Hg/ton coal; see table 4.3). Table 3-5 (Overleaf) Detailed presentation of the reported national releases to aquatic environments in the mentioned years; metric tons Hg/year. See the questionnaire responses in appendices and (ACAP, 2004) for information on data sources, estimate uncertainties etc.
3.3 National overviews of reported dataBelow, overviews of reported corresponding inputs to, and releases from, mercury source types present in the countries to all media are presented, including to air, water, soil, waste treatment/deposition, waste water treatment and by-products. Comprehensive reporting on all or most of these media were only submitted by Denmark, Finland and USA. Source types which are clearly not present in the country are not shown in the overviews. For details, data background and remarks, please see the questionnaire responses in appendices. For the Russian Federation, see (ACAP, 2004) also in appdices. Note that some countries have used other notations for data "not available", "not relevant", "not answered" and "existing but almost zero", than recommended in the introduction to the questionnaire. Not all such deviations seem clear in the questionnaire responses. "Inputs to the biosphere" is used here as a common designation for intentional consumption of mercury and mobilisation of mercury impurities. Table 3-6 Reported mercury inputs and outputs to all media in Denmark, 2001; metric tons mercury/year. For details on estimation and uncertainties, see the questionnaire response in the appendix. Table 3-7 Reported mercury inputs and outputs to all media in Finland, 2000; metric tons mercury/year. For details on estimation, see the questionnaire response in the appendix*1. Table 3-8 Reported mercury outputs to media, for which data were available, in USA, 1999(air)/ 2001(other); metric tons mercury/year. For a brief description of estimation methods, see appendices. Mercury consumption data for the USA in the mid 1990s are available in for example (USEPA, 1997) and (Sznopek and Goonan, 2000). Table 3-9 Reported mercury outputs to all media in Norway, 1999/2000; metric tons mercury/year. 1999 data on intentional mercury consumption in Norway can be found in (Maag et al. 2002). Some overview data on mercury in wastes, including metal extraction waste, can be found in (Huse et al. 2000). Table 3-10 Reported mercury outputs to all media in Canada, 2000; metric tons mercury/year. Table 3-11 Reported mercury outputs in Sweden, 2000/2001; metric tons mercury/year.
Data for Sweden's intentional mercury consumption can be found in (KEMI, 1998; summary also cited in UNEP, 2002). Some overview data on mercury in wastes, including metal extraction waste, can be found in Huse et al. 2000. Table 3-12 Reported mercury outputs to media, for which data were available, in the Russian Federation, 2001/2002; metric tons mercury/year. For description of estimation methods, see (ACAP, 2004), appendices.
Notes to table 3-12: *1: Mobilisation figure includes all coal use, that is, also on smaller plants, for coke production etc. 3.3.1 Submitted data from IcelandIceland submitted the data mentioned below. Estimated anthropogenic inputs to the environment from Iceland: No industry of concern because of Mercury in Iceland. The non-ferrous metals industry found is Al and FeSi industry, not of concern because of Mercury. The main potential sources of mercury in the aquatic environment are: Fossil fuel combustion; cement production; use of mineral phosphate fertiliser; sewage effluent; effluent from waste incinerators; releases from landfill. Atmospheric releases Ca. 570,000 metric tons of gasoline and diesel oil and ca. 150,000 metric tons of coal [1] and charcoal fossil fuel is used in Iceland annually. Air emission from Cement production (particle bound): 0.47 kg Hg / yr (250d /yr). Estimated emission from waste incinerators 11 kg Hg / yr (1999) Aquatic releases Estimated in sewage effluent is 31 kg /yr Hg (2001). Estimated release from landfill is < 0.11 kg Hg / yr (1999) Direct releases to land 2.400 metric tons of phosphate used in 1999, content of Hg is not known. Import of metal mercury Import of Mercury metal in 2001 was 8 kg and 180 kg of silveramalgam (Hg content ca. 90 kg Hg). 3.4 Mercury consumption and mobilisationReported information on mercury consumption and mobilisation in questionnaire responses is limited and of varying quality. Therefore, no individual presentation of this issue is given in this report. The issue is however dealt with as an integrated part of the discussion of source types in section 4, and consumption and mobilisation data, if reported, are summarised in the total reported releases overviews in section 3.3 above. Trade statistics of mercury and its compounds (which do not include mercury traded as part of products), and details on consumption and mobilisation data from the countries which reported them, are given in the questionnaire responses in appendices and in (ACAP, 2004). Footnotes[1] Atmospheric releases from coal combustion in Iceland roughly estimated here at about 5 Kg/year based on consumption data submitted by Iceland (150.000 tons coal/year) and the emission factor for coal in Denmark (0.04 g Hg/ton coal; see table 4.3). No data on whether emission reduction systems are used were submitted from Iceland. The Danish emission factor reflects a situation where about half of the mercury input is captured in emission reduction systems.
|
|||||||||||||||||||||||||||||||||||||||||||||||||||||||||||||||||||||||||||||||||||||||||||||||||||||||||||||||||||||||||||||||||||||||||||||||||||||||||||||||||||||||||||||||||||||||||||||||||||||||||||||||||||||||||||||||||||||||||||||||||||||||||||||||||||||||||||||||||||||||||||||||||||||||||||||||||||||||||||||||||||||||||||||||||||||||||||||||||||||||||||||||||||||||||||||||||||||||||||||||||||||||||||||||||||||||||||||||||||||||||||||||||||||||||||||||||||||||||||||||||||||||||||||||||||||||||||||||||||||||||||||||||||||||||||||||||||||||||||||||||||||||||||||||||||||||||||||||||||||||||||||||||||||||||||||||||||||||||||||||||||||||||||||||||||||||||||||||||||||||||||||||||||||||||||||||||||||||||||||||||||||||||||||||||||||||||||||||||||||||||||||||||||||||||||||||||||||||||||||||||||||||||||||||||||||||||||||||||||||||||||||||||||||||||||||||||||||||||||||||||||||||||||||||||||||||||||||||||||||||||||||||||||||||||||||||||||||||||||||||||||||||||||||||||||||||||||||||||||||||
