|
| Front page | | Contents | | Back | | Printing instructions |
Prioritisation within The Integrated Product Policy
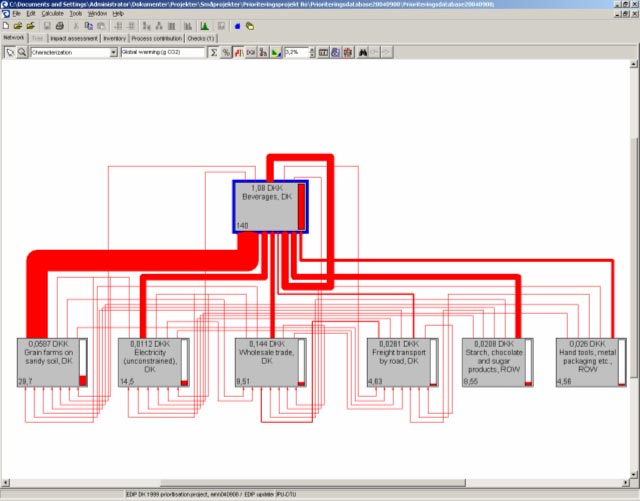
Figure 7.2. Example of network (with cut-off 3.2%) showing important processes contributing to the 140 g CO2-equivalents from the lifecycle of 1 DKK of products from the industry “Beverage, DK” (accumulated emission values in the lower left of each box).
| Front page | | Contents | | Back | | Printing instructions |
Version 1.0 February 2005, © Danish Environmental Protection Agency
|