|
Impact categories, normalisation and weighting in LCA 8. Nutrient enrichment
The cause of oxygen depletion found in the bottom layers of lakes and coastal waters is nutrient enrichment. Thus, nutrient enrichment can be defined as "an enrichment of the aquatic environment with nutrient salts leading to an increased production of plankton, algae and higher aquatic plants. In time this leads to a reduction in the water quality and in the value of the exploitation, which occurs in the area" (Christensen et al. 1993). The algae sink to the bottom and are broken down consuming oxygen in the bottom layer. If fresh oxygen-rich water from the surface does not reach the bottom layers, the oxygen concentration near the bottom will gradually be reduced until the bottom-dwelling organisms move away or die. The injurious effects of extensive quantities of nutrient salts have been observed regularly in lakes for many years. However, in Denmark the discovery that the bottom of large bodies of water was practically oxygen-free and lifeless in some part of the year came as an unpleasant surprise to many people and triggered serious discussion of nutrient salt emissions and their potential impact on the environment. 8.1 Substances contributing to the impact categoryOne of the two macro-nutrients, nitrogen and phosphorus, is usually the limiting element for the growth of primary producers, and it is therefore reasonable to consider only the elements nitrogen and phosphorus as contributors to nutrient enrichment. In Danish lakes, phosphorus deficiency, or a combination of nitrogen and phosphorus deficiencies, is typically limiting for growth, and their addition promotes algae growth. In Danish coastal waters and seas, nitrogen is often the limiting nutrient. Substances containing nitrogen or phosphorus in a biologically available form are therefore classified as potential contributors to nutrient enrichment. In connection with the 1987 Action Plan on the Aquatic Environment, a Danish nation-wide programme was established to monitor nutrient loading of aquatic areas from point sources, agriculture and the atmosphere to enable the expected reduction in loading to be followed. Most of the nitrogen loading to the aquatic environment is mainly attributable to leaching from the root zone of agricultural land. An important part of the nitrogen loading is related to the use of nitrogen fertilisers and the number of livestock. Apart from the man-made emissions from agriculture an important loading of nitrogen comes from various point sources such as waste water treatment plants, industry, fish farming and from sparsely built- up areas. Most of the phosphorus loading of surface water is attributable to discharges from point sources, especially municipal sewage and industrial effluent. Only a small part of the industrial sector is responsible for the majority of wastewater containing phosphorus. To name just a few important industries the fertiliser industry and other related chemical industries manufacturing products containing phosphorus (e.g. pesticides and detergents), as well as the pulp and paper industry and fish processing industry should be mentioned. However, leaching from agricultural land also plays a significant part. The most important airborne emissions include oxides of NOx that are predominantly emitted from incineration processes, and ammonia, NH3, which is especially emitted from agricultural activities. Since most of the atmosphere consists of free nitrogen, N2, further addition of N2 will not have any effect. N2 is therefore not classified as contributor to nutrient enrichment. 8.2 Nutrient enrichment PotentialIn a tripartite division of environmental impact categories into global, regional and local, nutrient enrichment is regarded as a local as well as a regional impact. 8.2.1 Definition of nutrient enrichment potential The classification step defines nutrient enrichment as the man-made impact on aquatic or terrestrial systems of nitrogen, N, or phosphorus, P. The total nutrient enrichment potential expresses the emissions as an equivalent emission of the reference substance NO3-. The equivalence factor for the total nutrient enrichment equivalent is designated the substance's nutrient enrichment potential. Three equivalence factors are defined for use in the calculation of the potential contributions from a given substance:
From the formula on the average composition of aquatic organisms, it can be seen that the ratio of nitrogen to phosphorus is of the order of 16. If the concentration of bioavailable nitrogen is significantly more than 16 times the concentration of bioavailable phosphorus in an ecosystem, it is thus reasonable to assume that phosphorus is the limiting nutrient and vice versa. 8.3 Normalisation references and weighting factors for nutrient enrichmentThe normalisation references and the weighting factors for nutrient enrichment potential are calculated according to the formula presented in chapter 1, Introduction. The normalisation and weighting factors for nutrient enrichment are presented in Table 8.1. Table 8.1 Normalisation references and weighting factors for nutrient enrichment (Larsen 2005; Busch 2005).
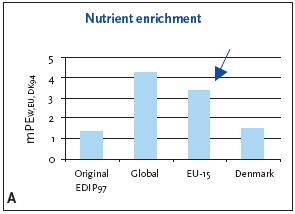
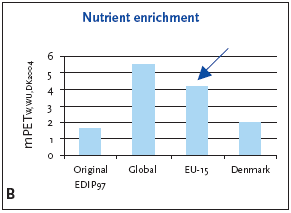
1 Weighting factors have not been established worldwide; the European weighting factors are recommended for impact potentials located outside Europe or at unknown locality 8.3.1 Recommendation for application of normalisation references and weighting factors for nutrient enrichment Nutrient enrichment is considered as both a local and a regional effect. It is recommended to use the EU-15 normalisation reference combined with EU- 15 weighting factor for nutrient enrichment. This recommendation is valid for impact potentials in Denmark as well as in EU-15. For impact potentials located outside Denmark and Europe the global reference is recommended. 8.4 Example of applying normalisation reference and weighting for nutrient enrichmentFigure 8.1 illustrates the normalised and weighted nutrient enrichment potential for the example in Chapter 11. For regional impact potentials like nutrient enrichment, the EU-15 normalisation reference and the EU-15 weighting factor are recommended. Based on an impact potential for the product in question 0.4 kg NO3-eq./year the actual normalised and weighted values are 3.4 mPEEU94 and 4.1 mPETEU2004 respectively. Figure 8.1 Normalised (A) and weighted (B) nutrient enrichment potentials for production of a refrigerator at different localities.
Table 8.1 and Figure 8.1 illustrate that the chosen normalisation reference and weighting factor (for EU-15) put more attention to nutrient enrichment than the Danish values, but on the other hand also put less attention to the issue than the global values. It is therefore recommended to examine whether the impact is important when compared to other impacts, using the Danish or global normalisation references. If so, a more detailed sensitivity analysis can be conducted, investigating the contribution from phosphorous and nitrogen compounds, and if possible distinguishing between point sources and more general contributions. 8.5 If you would like to know moreBusch, N.J. 2005, Calculation of weighting factors. In Stranddorf, H.K., Hoffmann, L. & Schmidt, A. Update on impact categories, normalisation and weighting in LCA. Environmental Project no. 995, Danish EPA, 2005. Christensen, N., Paaby, H., & Holten-Andersen, J. 1993, Environment and society - the state of the environment in Denmark. Professional report no. 93, National Environmental Research Institute. In Danish2 EEA 1998a, Europe's Environment:The Second Assessment. Eurostat, European Commission, European Environment Agency. Office for Official Publications of the European Commission, Luxembourg. EEA 1998b,. Europe's Environment: statistical compendium for the Second Assessment. Eurostat, European Commission, European Environment Agency. Office for Official Publications of the European Commission, Luxembourg. Hauschild, M. & Wenzel, H. 1998c, Nutrient enrichment as a criterion in the environmental assessment of products. In Hauschild M, Wenzel H (eds.). Environmental assessment of products.Volume 2: Scientific background. London: Chapman & Hall. Larsen, J. 2005. Nutrient enrichment. In Stranddorf, H.K., Hoffmann, L. & Schmidt, A. Update on impact categories, normalisation and weighting in LCA. Environmental Project no. 995, Danish EPA, 2005.. Larsen, S.E., Erfurt, J., Græsbøll, C., Kronvang, B., Mortensen, E., Nielsen, C.E., Ovesen, N.B., Paludan, C., Rebsdorf, Aa., Svendsen, L.M. & Nygaard, P. 1995, Ferske vandområder - vandløb og kilder.Vandmiljøplanens overvågnings- program 1994. Danmarks Miljøundersøgelser. Faglig rapport fra DMU, nr. 140. Footnotes2 Most of the reports from the Danish Environmental Protection Agency contain English summaries.
|

