|
Ozone depleting substances and the greenhouse gases HFCs, PFCs and SF6 1 Summary1.1 Ozone-depleting substancesODP-weighted consumption for 2003 has been calculated at 17.36 ODP tonnes, a further reduction of 25.6 ODP tonnes compared to 2002, when consumption was 42.97 ODP tonnes. The table below shows ODP-weighted consumption calculated on the basis of information on imports from importers and producers. The ODP values are listed in Appendix 1, Table 1.a. Table 1.1 Overview of consumption and ODP-weighted consumption in 2002-2003, tonnes
(1) In the calculation of the ODP-weighted consumption of CFCs, CFC-113 is the only substance which has been reported and which is included in the calculation basis. Danish consumption of methyl bromide has only been used as feedstock for other chemical production. Therefore it is not included as an emission. CFCs, tetrachloromethane, and trichloroethane are used exclusively for laboratory purposes. HCFCs are used as refrigerants or for foam production (system foam). The areas of application of HCFCs in 2003 are shown in Table 1.2. Table 1.2 Consumption of HCFCs by application area in 2003, tonnes.
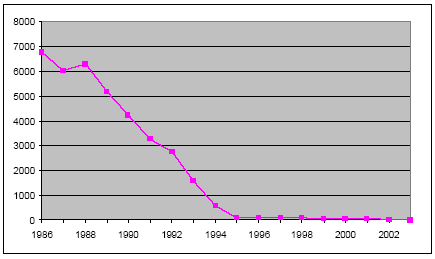
HCFC-22 is used as a refrigerant, and HCFC-141b is used in foam production. Figure 1.1 shows the development of ODP-weighted consumption.
Figure 1.1 The development of ODP-weighted consumption 1986-2003, tonnes. The specific consumption figures for individual substances and groups of substances and the ODP contribution calculated for the period 1986-2003 appear in Table 3.1 in Chapter 3. 1.2 Greenhouse gasesThe GWP-weighted actual emissions of HFCs, PFCs, and SF6 in 2003 were 745.6 thousand tonnes CO2 equivalents. The corresponding emissions were 715.0 thousand tonnes CO2 equivalents in 2002, as reported in /13/. However, an update has been made and the figure for 2002 has now been recalculated as 718.8 thousand tonnes, which corresponds to a total increase of 26.8 thousand tonnes CO2 equivalents. [1] Emissions of HFCs, PFCs, and SF6 in 2002 contributed about 1 per cent of the total Danish GWP contribution /19/. In Table 1.3 below, consumption, actual emissions and stock in products are summarised after making adjustments for any imports and exports of stock in products.
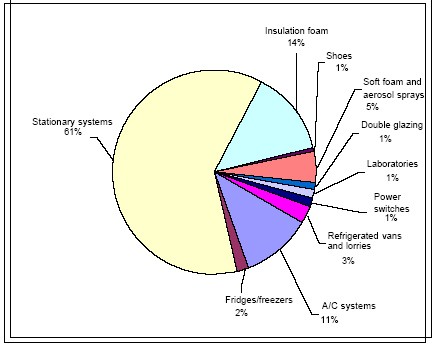
Table 1.3 Consumption, actual emissions, stock, adjusted for imports/exports as well as GWP contribution from greenhouse gases 2003, tonnes. In Figure 1.2 below, total GWP contributions from HFCs, PFCs, and SF6 are shown in relation to individual sources. The figure shows the sources responsible for the greatest individual contributions in 2003.
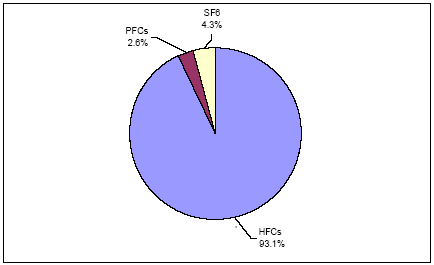
Figure 1.2 The relative distribution in 2003 of GWP contribution, analysed by source The figure shows that emissions from refrigerants used in commercial stationary refrigerators account for the largest GWP contribution. These refrigerators make up 61% of the overall actual contribution in 2003. The contribution is primarily from HFCs, and a small part is from PFCs. The second-largest GWP contribution, accounting for 14 per cent, comes from ongoing releases of HFCs from insulating foam in fridges and freezers. Five per cent of the GWP contribution stems from HFC emissions released during the production of soft foam and from the use of HFC-based aerosol sprays. The three most substantial sources of SF6 emissions in 2003 were power switches, laboratories, and double glazing. These contributed more or less equally, and together account for about 3 per cent of the total GWP contribution. HFCs comprise around 93.1 per cent of the overall GWP contribution in 2003. Emissions of SF6 make up 4.3 per cent and emissions of PFC contribute 2.6 per cent to the total contribution. The relative distribution is shown in Figure 1.3 below.
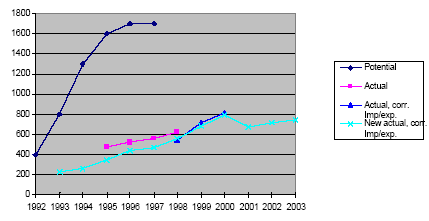
Figure 1.3 The relative distribution of the GWP contribution from HFCs, PFCs, and SF6, 2003. 1.2.1 HFCsIn 2003, the total consumption of HFCs was 528.3 tonnes. This represents a significant reduction compared to 2002, when total consumption was around 713.2 tonnes. The consumption of HFC-134a has almost halved since 2002, because by and large the chemical is no longer used in foam production. The consumption of HFC-404A as a refrigerant in refrigerators has also been reduced, however to a lesser extent. HFC consumption is only continuing to increase with regards to HFC-407c. HFC-407c is frequently applied in new refrigerators, where previously the refrigerant HFC-22 was used. The total GWP contribution from HFCs was 694.4 thousand tonnes CO2 equivalents, which is an increase of 23.2 thousand tonnes compared to 2002. 1.2.2 Sulphur hexafluoride (SF6)The consumption of sulphur hexafluoride was 2.3 tonnes in 2003, which represents an increase compared to 2002, when consumption was 1.4 tonnes. Actual emissions have been calculated at 1.3 tonnes, equivalent to a GWP contribution of 31.9 thousand tonnes CO2 equivalents. In 2002, emissions were about 25.5 thousand tonnes CO2 equivalents. 1.2.3 Perfluorinated hydrocarbons (PFCs)In 2003, the consumption of perfluorinated hydrocarbons (perfluoropropane), which are used exclusively in the refrigerant R413a, was 0.5 tonnes. The actual GWP-weighted emission is 19.3 thousand tonnes CO2 equivalents, which is a reduction from 2002. 1.2.4 Trends in total GWP contribution from potent greenhouse gasesFigure 1.4 shows the trend in Danish GWP contributions 1992-2003 from HFCs, PFCs, and SF6. The differences arising from the present calculations of the total GWP value compared with earlier calculation methods are illustrated in the figure.
Figure 1.4 Trends in GWP-weighted potential, actual and adjusted actual emissions 1992-2003, '000 tonnes CO2 equivalents. The figure shows that, in 2003, there was again an increase in the total GWP contribution. The development in the GWP contribution 1992-2003 can also be seen in Table 1.4 below. Table 1.4 Total GWP-contribution from HFCs, PFCs, SF6, '000 tonnes CO2 equivalents, determined according to the four different methods of calculation applied during this period
Footnotes[1] Due to new knowledge about the consumption of SF6, an update was made of the historical data, which means that 2002 emissions have been corrected upwards by 3.8 thousand tonnes CO2 equivalents.
|


