|
Survey of liquid hand soaps, including health and environmental assessments 9 Effects in the aquatic environment
9.1 Selected substances for simulation of effects in the aquatic environmentThe environmental assessment of the 8 selected substances (chapter 8) showed that 4 of the substances have characteristics which have to be assessed further in a riskassesment to asses if they can cause critical effects in the aquatic environment. These 4 substances, Cocamide DEA, Methylchloroisothiazolinone/ Methylisothiazolinone (Kathon), and 2-Bromo-2-Nitropropane-1,3-Diol, are consequently included in an assessment of the environmental effects of the use of liquid hand soaps. 9.2 The fate of chemical substances in liquid hand soapsChemical substances used in liquid hand soaps will primarily be discharged to the environment through treated waste water from municipal waste water treatment plants. The hand soaps are washed out to the sewerage system and are via sewers lead to the waste water treatment plant. In the waste water treatment plant the chemical substances will be subject to various processes such as degradation under aerobic and anaerobic (anoxic) conditions, sorption to sludge particles, evaporation, hydrolysis, etc. As a result, the share of substances discharged with the treated waste water depend on the fate of the chemical substances in the waste water treatment plants. Furthermore, different biological and abiotic elimination processes in the aquatic environment will affect the concentration of the chemical substances. In addition, the concentration will depend on hydraulic parameters such as mixing/dilution and conditions of the water currents. 9.3 Total estimated use of chemical substances in the productsStatistics are not available of the annual consumption of liquid hand soaps in Denmark. The use of the selected substances is thus estimated indirectly on the basis of the average dose of soap used when washing hands and the average daily frequency of handwashing for normal consumers. The estimated maximum consumption is based on the following assumptions:
Table 9.1 states the estimated amounts of the selected chemical substances used in liquid hand soaps. Table 9.1 Estimated consumption of the selected substances in liquid hand soaps.
9.4 Estimate of Predicted Environmental Concentration (PEC) and Predicted No Effect Concentration (PNEC)In order to estimate the environmental risk resulting from discharge of the selected substances in the liquid hand soaps, the Predicted Environmental Concentration (PEC) is compared with the Predicted No Effect Concentration (PNEC) of the substances in the aquatic environment. The concentration of substances from the waste water treatment plant discharge (PECstp) is estimated based on amounts of consumption of the substance (M), the degree of elimination in the waste water treatment plant (fremoval) and the annually discharged waste water in Denmark (Q):
Q = 611 mill m3/year (37) fremoval is based on references in the EU Technical Guidance Document (TGD) (28). fremoval is a function of the octanol-water partition coefficient (log Pow), Henry's constant (H) and the biodegradability of each substance. The estimated PECstp values are shown in table 9.2 Table 9.2 Estimated PEC values
The highest concentrations expected not cause adverse effects in the aquatic environment, PNEC, are estimated based on data on the toxicity of the substances to aquatic organisms with application of an assessment factor as described in the EU Technical Guidance Document (28). The estimated PNEC values for the selected substances are shown in table 9.3. Table 9.3 Estimated PNEC values
9.5 Estimate of risk quotientsThe estimated risk quotients (RQ) for the selected substances are shown in table 9.4. RQ is estimated as PEC/PNEC. Table 9.4 Estimated risk quotients
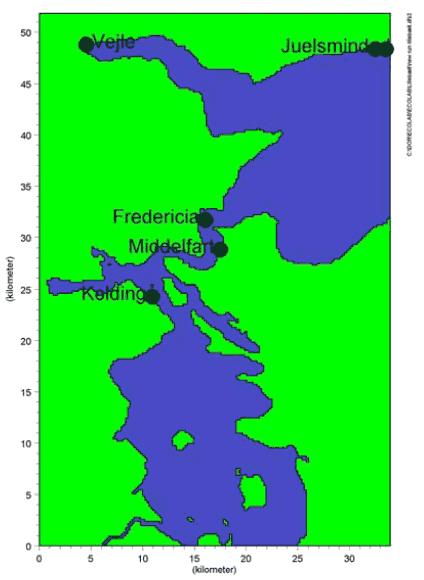
* Risk quotients for Kathon is estimated as the sum of the risk quotients for the two components Methylchloroisothiazolinone and Methylisothiazolinone A risk quotient > 1 indicates a probability of effects in the aquatic environment. A standard dilution factor of 10 after discharge of the treated waste water to the aquatic environment is anticipated. A risk quotient less than 10 thus indicates that there is no risk of adverse effects in the aquatic environment. From table 9.4 it appears that the risk quotient in the discharge from the waste water treatment plant of Cocamide DEA, 2-Bromo-2-Nitropropane-1,3-Diol and Kathon is between 47 and 422. Discharge of substances in the calculated concentrations can thus be expected to cause a risk of adverse effects in the aquatic environment. To assess the effect in the aquatic environment, simulations of the dilution of the substances and their transformation in the environment have been carried out in a defined exposure scenario. 9.6 Exposure scenario: LillebæltTo estimate the concentration (PEC) of the selected chemical substances, a fate model describing the degradation (biological degradation, hydrolysis, photolysis), evaporation, and sedimentation, is used. All processes are described by a first order reactions as regards substance concentration. The process descriptions have been put into a template in the modeling tool ECOLAB developed by DHI. To describe the transport of the substances the fate model is linked to a hydraulic model, which models the water flow in defined waterways. In the following example the two-dimensional model MIKE 21 has been used (concentration in depth is assumed to be distributed evenly). Lillebælt (the Danish strait of Little Belt) has been chosen as a representative exposure scenario, which describes near-shore waters in Denmark. The area covered by the model is approx. 35 km x 50 km. To ensure a kind of equilibrium a simulation period of 2 months has been used. Weather conditions observed during the first week of April 2004 were repeated in the simulation approx. 10 times. The substances are discharged to Lillebælt from 5 waste water treatment plants. Their characteristics and locations appear from table 9.5 and figure 9.1. Table 9.5 Characteristics of waste water treatment plants with discharge into Lillebælt
* M: mechanical; B: biological; N: nitrification; D: denitification; C: Chemical depositing.
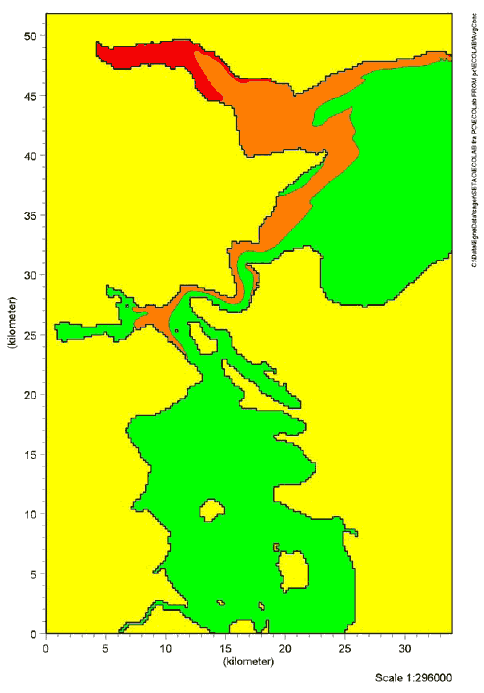
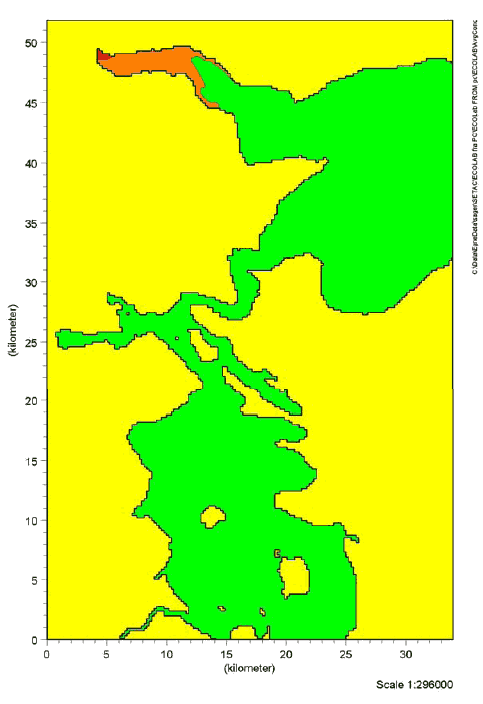
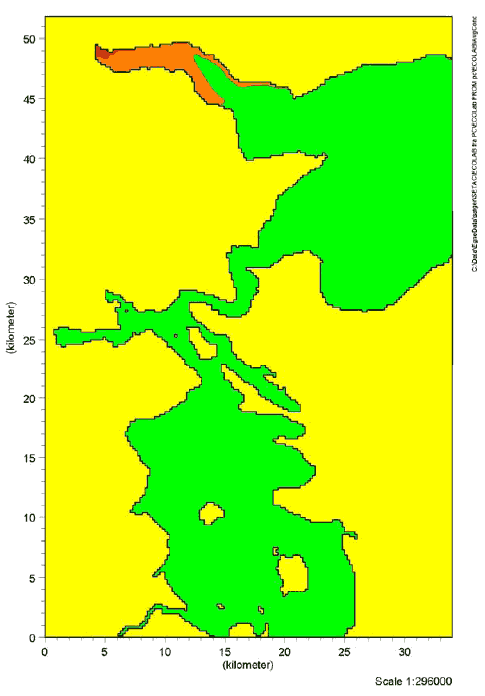
Figure 9.1: Location of outlet from waste water treatment plants, Lillebælt The PEC (Predicted Environmental Concentration) of the selected chemical substances are estimated by linking the fate of the chemical substances in the waste water treatment plants and the aquatic environment with the water flow conditions in Lillebælt. The PEC values are compared with the PNEC (Predicted No Effect Concentration) values of the substances, which is the highest concentration at which no adverse effects in the aquatic environment are expected, and a risk quotient RQ (=PEC/PNEC) for the substances is estimated after discharge to the aquatic environment. During the simulation period, there are great variations in the concentrations of the chemical substances in the aquatic environment as a result of the natural variations of the water flows. In order to assess possible chronic effects, the average concentration of the substances during the simulation period has been estimated and compared with PNEC. To assess possible acute effects, the maximum concentration of the substances during the simulation period has been estimated and compared with 10PNEC, as it is generally assumed that PNEC for acute effects is a factor 10 higher than PNEC for chronic effects. The results of the simulations of the substances Cocamide DEA, 2-Bromo-2-Nitropropane-1,3-Diol and Kathon are illustrated graphically with risk quotients in the intervals RQ ≤ 0,1; RQ 0,1 - 1 and RQ ≥ 1 for the waters in Lillebælt. The area of Lillebælt where there is a risk of acute effects is found to be considerably smaller than the area where there is a risk of chronic effects. Figures 9.2-9.4 show the estimated risk quotients calculated as the ratio of the time weighted average of the estimated concentrations and PNEC.
Figure 9.2 Risk quotients for chronic effects of Cocamide DEA in Lillebælt. The red colour indicates RQ ≥ 1. The orange colour indicates RQ between 0.1-1. The green colour indicates RQ ≤ 0.1
Figure 9.3 Risk quotients for chronic effects of 2-Bromo-2-Nitropropane-1,3-Diol in Lillebælt. The red colour indicates RQ ≥ 1. The orange colour indicates RQ between 0.1-1. The green colour indicates RQ ≤ 0.1
Figure 9.4 Risk quotients for chronic effects of Kathon in Lillebælt. The red colour indicates RQ ≥ 1. The orange colour indicates RQ between 0.1-1. The green colour indicates RQ ≤ 0.1 The results of the simulations showed that risk quotients > 1 for chronic effects of Cocamide DEA were found in a considerable segment of Vejle inlet. For 2-Bromo-2-Nitropropane-1,3-Diol and Kathon, risk quotients > 1 for chronic effects were found in the immediate vicinity of the waste water outlet of Vejle waste water treatment plant. Risks of adverse effects of the substances in the aquatic environment were not detected in the remaining waters in the Lillebælt scenario. Estimates of the risk of acute effects showed that risk quotients > 1 was only found for Cocamide DEA in an area in the inner part of Vejle inlet. However, the area was considerably less compared with the estimated risk of chronic effects. Risk quotients > 1 were not found for 2-Bromo-2-Nitropropane-1,3-Diol and Kathon in Lillebælt (data not shown). The inner part of Vejle inlet is characterized by limited change of water compared with the other waste water outlets in Lillebælt. Consequently, it is not surprising that there is a larger probability of effects precisely in this area. The estimates indicate a worst-case situation with an estimated high consumption of liquid hand soaps and a maximum estimated content of the selected substances in the products. 9.7 Summary, effects in the aquatic environmentThe 3 substances selected for simulation of fate and effects in the environment are assessed to give a representative picture of possible environmental impacts in connection with the use of liquid hand soaps. In the light of the simulations carried out in Lillebælt, it can be concluded that the discharge of Cocamide DEA may cause adverse effects (both acute and chronic) in the aquatic environment in areas with waste water discharge when the area is also characterized by a limited exchange of water. Risk of chronic effects of 2-Bromo-2-Nitropropane-1,3-Diol and Kathon in the aquatic environment was found in only a limited area near the waste water outlet. The area is also characterized by a relatively low exchange of water. Risk of acute effects of 2-Bromo-2-Nitropropane-1,3-Diol and Kathon was not detected in Lillebælt.
|


