| Front page | | Contents | | Back | | Printing instructions |
Impact of CO2 quota allocation to new entrants in the electricity market
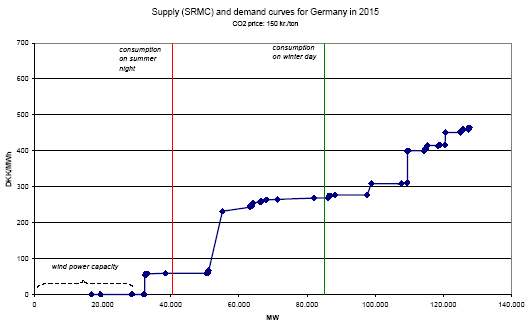
Figure 34: Supply and demand curves for Germany based on data from WILMAR (2015 fuel and CO2 prices).
Version 1.0 June 2007, © Danish Environmental Protection Agency