Ozone-depleting substances and the greenhouse gases HFCs, PFCs and SF6
1 Summary
1.1 Ozone-depleting substances
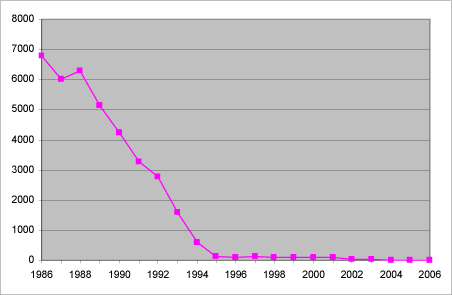
ODP-weighted consumption for 2006 based on reporting from importers has been calculated at 3.05 ODP tonnes. Compared to 2005 it is an increase of 1.29 ODP tonnes. The increase is caused by a larger consumption of HCFC-141b.
The table below shows ODP-weighted consumption calculated on the basis of information on imports from importers and producers. The ODP factors for each substance are listed in Appendix 1, Table 1.a.
Table 1.1 Overview of consumption and ODP-weighted consumption in 2003-2006, Tonnes
Danish consumption of methyl bromide has only been used as feedstock for other chemical production. Therefore it is not included as an emission.
HCFCs are used as refrigerants or for foam production (system foam). The areas of application of HCFCs in 2006 are shown in Table 1.2.
Only regenerated HCFC-22 is used as a refrigerant in Denmark. Thus, there is a reexport of new HCFC-22 to other countries. According to compliance with the UN methodology, regenerated HCFC-22 is not included in calculation of the ODP weighted consumption.
HCFC-141b is used in production of system foam
Table 1.2 Danish consumption of HCFCs by application area in 2006, tonnes.
| Application area | HCFC-22 | HCFC-123 | HCFC-141b | HCFC-142b |
| System foam (for panels, insulation, etc.) | 0 | 0 | 27,7 | 0 |
| Refrigerants, New | 0 | 0 | 0 | 0 |
| Refrigerants, regenerated | 66 | 0 | 0 | 0 |
| Refrigerants, HFC mixtures | 0 | 0 | 0 | 0 |
| Total | 66 | 0 | 27,7 | 0 |
Statistics Denmark has registered an irregular import/export of CFC’s in 2006. The import/export are not confirmed from the importers. There are registered an exports of 1,8 tonnes of CFC-11 and an import of 1,7 tonnes and an export of 3,1 tonnes of CFC-12. Export of CFC-11 and CFC-12 are banned and therefore this registration has undergone an investigation to clarify whether the import were actual or coursed by data failure. Statistics Denmark have examined there data and concluded that there were no data failure. In the light of the conclusion, this case is handed over to DEPA’s Chemical Inspection. Before the use of CFC’s are determined by source, the emissions are not included in the calculation of ODP tonnes.

Figure 1.1 The development of ODP-weighted consumption 1986-2006, tonnes.
The specific figures for consumption of individual substances and groups of substances and the ODP contribution calculated for the period 2000-2006 and year 1992 is shown in Table 3.1 in Chapter 3.
1.2 F-gases
The GWP-weighted actual emissions of HFCs, PFCs, and SF6 in 2006 were 885,3
thousand tonnes CO2 equivalents. The corresponding emissions were 839,5 thousand tonnes CO2 equivalents in 2005, as reported in /13/.
The emission has increased for all three substance groups; HFC’s, PFC’s and SF6. In particular HFC-404a emission from commercial refrigerants and HFC-134a emission from system foam production (export) and commercial refrigerants. Further the SF6 emission from plasma erosion and analysis purpose have increased. Finally a new sector for PFC/HFC emissions has been identified. The substances are used (in a smaller scale) in manufacturing of optical fibres.
The HFC consumption in commercial refrigerants has increased with app. 80 tonnes in total compared to 2005. It also has an effect on the future emission trends, because the stock in commercial refrigeration has increased further.
In Table 1.3 below, consumption, actual emissions and stock in products are summarised.
Table 1.3 Consumption, actual emissions, stock, adjusted for imports/exports as well as GWP contribution from greenhouse gases 2006, tonnes.
| Source | Substance | Consumption and imports, DK, tonnes | Stock, tonnes | Actual emissions, tonnes | GWP contribution, CO2 eqv. tonnes | GWP contribution in total, CO2 eqv. Tonnes |
| Refrigerants for commercial stationary refrigerators and A/C systems | HFC-134a | 170,3 | 920,7 | 86,2 | 112 079 | |
| HFC-404a | 165,5 | 1 114,3 | 108,2 | 352 675 | ||
| HFC-401a | 0,0 | 13,0 | 1,6 | 29 | ||
| HFC-402a | 0,0 | 20,9 | 2,4 | 4 075 | ||
| HFC-407c | 70,6 | 410,3 | 38,9 | 59 353 | ||
| HFC-507a | 6,1 | 60,9 | 6,2 | 19 176 | ||
| Other HFC-er | 12,8 | 110,4 | 11,0 | 19 060 | ||
| PFC | 0,0 | 15,0 | 1,8 | 12 306 | ||
| All substances | 578 752 | |||||
| Household fridges/freezers | ||||||
| Refrigerants | HFC-134a | 63,0 | 842,7 | 9,5 | 12 307 | |
| HFC-404a | 4,3 | 83,2 | 0,9 | 3 032 | ||
| Insulatonfoam | HFC-134 | 0,0 | 1 147,8 | 78,2 | 101 601 | |
| HFC-152 | 0,0 | 2,2 | 0,1 | 14 | ||
| All substances | 116 954 | |||||
| Refrigerants for mobile A/C systems | HFC-134a | 34,4 | 223,6 | 66,6 | 86 642 | 86 642 |
| Refrigerated vans and lorries | HFC-134a | 0,4 | 5,1 | 1,0 | 1 288 | |
| HFC-404a | 6,6 | 34,2 | 6,0 | 19 717 | ||
| HFC-402a | 0,0 | 1,2 | 0,3 | 422 | ||
| All substances | 21 427 | |||||
| Other PUR foam and system foam | HFC-134a/245/365 | 166,2 | 0,0 | 16,3 | 21 196 | 21 196 |
| Soft foam and aerosol sprays etc. | HFC-134a | 12,5 | 15,1 | 19 689 | ||
| HFC-152a | 11,6 | 11,6 | 344 | |||
| All substances | 20 033 | |||||
| Liquid cleaners | PFC | 0,0 | 0,0 | 0 | 0 | |
| Fibre optics | PFC-14 | 0,3 | 0,3 | 1 638 | ||
| PFC-318 | 0,2 | 0,2 | 1 740 | |||
| HFC-23 | 0,1 | 0,1 | 936 | |||
| All substances | 4 314 | |||||
| Double glazing | SF6 | 0,0 | 37,9 | 0,4 | 9 159 | 9 159 |
| High-voltage power switches | SF6 | 3,7 | 71,0 | 0,5 | 12 949 | 12 949 |
| Laboratories | SF6 | 0,6 | 0,6 | 13 884 | 13 884 | |
| Total | HFC-er | 724,5 | 4 990,6 | 460,3 | 833 635 | |
| PFC-er | 0,0 | 15,0 | 1,8 | 15 684 | ||
| SF6 | 4,2 | 108,9 | 1,5 | 35 992 | ||
| GWP contribution | Total | 885 311 |
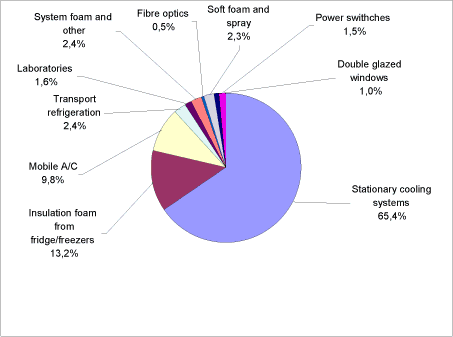
In Figure 1.2 below, total GWP contributions from HFCs, PFCs, and SF6 is shown in accordance to individual sources for emission in 2006.

Figure 1.2 The relative distribution of GWP emissions, analysed by source
The figure shows that emissions from refrigerants used in commercial stationary refrigerators account for the largest GWP contribution. These refrigerators cover 65,4 per cent of the total actual contribution in 2006. The contribution is primarily from HFCs, and a small part is from PFCs.
The second-largest GWP contribution, accounting for 13,2 per cent, comes from ongoing releases of HFC-134a stock in insulating foam in fridges and freezers.
Mobile A/C contribute with 9,8 per cent and only 2,3 per cent of the GWP contribution stems from HFC emissions released during the production of soft foam and from the use of HFC-based aerosol sprays.
The three sources of SF6 emissions in 2006 were power switches, double glazing windows and laboratories/plasma erosien. These account for 4,1 per cent of the total GWP contribution.
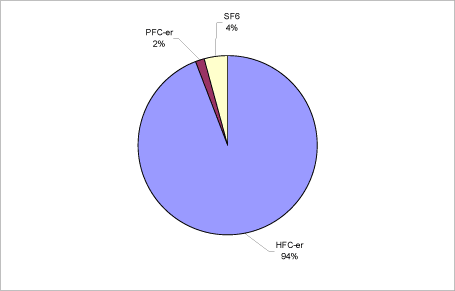
HFCs comprise app. 94 per cent of the overall GWP contribution in 2006, Emissions of SF6 comprise 4 per cent and emissions of PFC contribute with 2 per cent of the total emission.
The relative distribution is shown in Figure 1.3 below.

Figure 1.3 The relative distribution of the GWP contribution from HFCs, PFCs, and SF6, 2006.
1.2.1 HFCs
In 2006, the total import (minus re-export) of pure HFC’s and HFC blends were approx. 724,5 tonnes. Compared to 2005, where total consumption was approx. 559,4 tonnes, the import has increased with total 165,1 tonnes. The import of almost all HFC’s has increased, only import of HFC-417 and 413a are reduced.
Actual emissions from HFC’s have been calculated to approx. 833,600 tonnes CO2 equivalents. In 2005, emissions were 803 900 tonnes CO2 equivalents. It is an increase of approx. 29 700 tonnes CO2 equivalents.
The actual emission from HFC’s has exceeded to highest level since HFC’s has been introduced.
1.2.2 Sulphur hexafluoride (SF6)
The consumption of sulphur hexafluoride was 4,23 tonnes in 2006, which is an increase of approx. 0,7 tonnes compared to 2005.
Actual emissions have been calculated at 1.5 tonnes, equivalent to a GWP contribution of app. 36 000 tonnes CO2 equivalents. In 2005, emissions were 21 700 tonnes CO2 equivalents. This level of emission from SF6 is the highest level in last six years.
1.2.3 Per fluorinated hydrocarbons (PFCs)
In 2006, the emission of PFC’s origins from production of fibre optics and emission from commercial refrigeration containing R413a. The total GWP-weighted PFC emission is 15 680 tonnes CO2 equivalents. The actual emission from stock containing R413a and consumption was 12 300 tonnes CO2 equivalents, which is a continuation of the reduction since 2002. The actual emission from PFC-14 and PFC-318 in production of fibre optics is app. 0,5 tonnes and the actual GWP-weighted emission is 3 380 tonnes CO2 equivalents.
1.2.4 Trends in total GWP contribution from F-gases
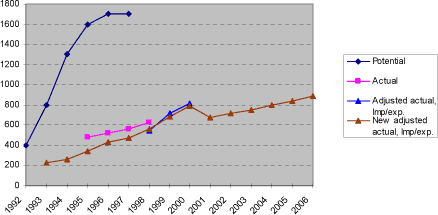
Figure 1.4 shows the trend in Danish GWP contributions 1992-2006 from HFCs, PFCs, and SF6. The differences from the present calculations of the total GWP value compared with earlier calculation methods are illustrated in the figure.

Figure 1.4 Trends in GWP-weighted potential, actual and adjusted actual emissions 1992-2006, 1 000 tonnes CO2 equivalents.
The figure shows that the GWP emission also in 2006, has increased further and exceeded the highest level for calculation of actual emissions.
The development in the GWP contribution 1992-2006 can also be seen in Table 1.4 below.
Table 1.4 Total GWP-contribution from HFCs, PFCs, SF6, 1 000 tonnes CO2 equivalents, determined according to the four different methods of calculation applied during this period
| Potential | Actual | Actual, adjusted imp/exp. |
New actual, adjusted imp/exp. |
|
| 1992 | 400 | |||
| 1993 | 800 | 230 | ||
| 1994 | 1300 | 263 | ||
| 1995 | 1600 | 480 | 344 | |
| 1996 | 1700 | 520 | 435 | |
| 1997 | 1700 | 560 | 472 | |
| 1998 | 625 | 577 | 564 | |
| 1999 | 700 | 683 | ||
| 2000 | 818 | 793 | ||
| 2001 | 699 | |||
| 2002 | 719 | |||
| 2003 | 745 | |||
| 2004 | 797 | |||
| 2005 | 839 | |||
| 2006 | 885 |
Version 1.0 May 2008, © Danish Environmental Protection Agency