Buffer zones for biodiversity of plants and arthropods: is there a compromise on width?


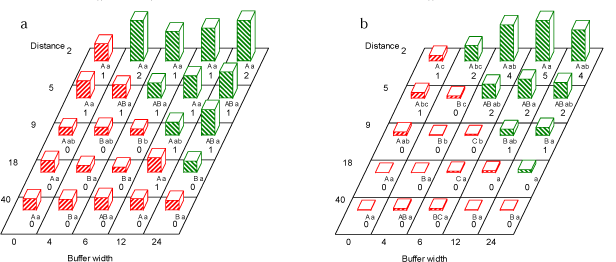
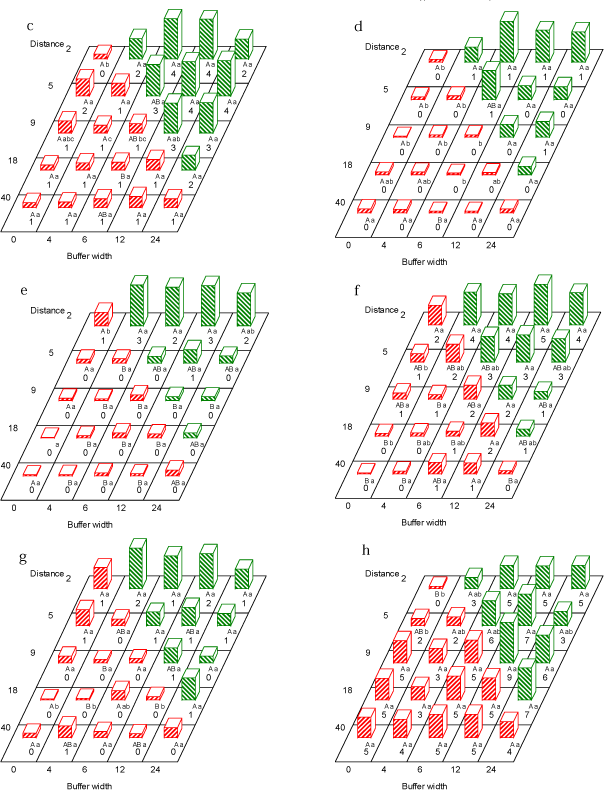
Fig. 3.4. Number of weedplants (no. per m²) for each of the families: Apiaceae (a), Asteraceae (b), Brassicaceae (c), Chenopodiaceae (d), Lamiaceae (e), Poaceae (f), Scrophulariaceae (g) and Violaceae (h) at the second sampling run (late June-July)at the distances 2, 5,9, 18 and 40 m to the hedgerow at the buffer widths 0, 4, 6, 12 and 24 m. Within each buffer width, figures with the same capital letter are not significantly different (P=0.05). Within each distance, figures with the same lower case letter are not significantly different (P=0.05). Red bars (hatched from lower left to upper right) are numbers in areas treated with fertilizer and pesticides. Green bars (hatched from upper left to lower right) are non-treated area (buffer zone).
Version 1.0 November 2009, © Danish Environmental Protection Agency