Buffer zones for biodiversity of plants and arthropods: is there a compromise on width?
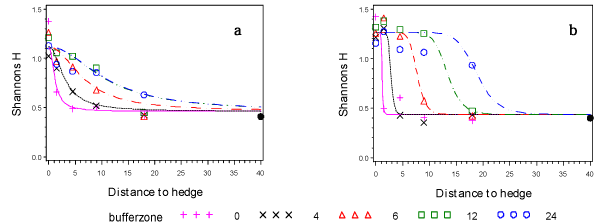
Fig. 3.6. Modelled biodiversity index (Shannon H) against distance to hedge for each buffer width a: Sampling run 1 b: sampling run 2. The fitted curves are based on the logistic model presented in Table 3.4 with common slope for all buffer zones (Model 1) using observations at distance 0-18 m and the mid-field references at 40 m.
Version 1.0 November 2009, © Danish Environmental Protection Agency