Buffer zones for biodiversity of plants and arthropods: is there a compromise on width?

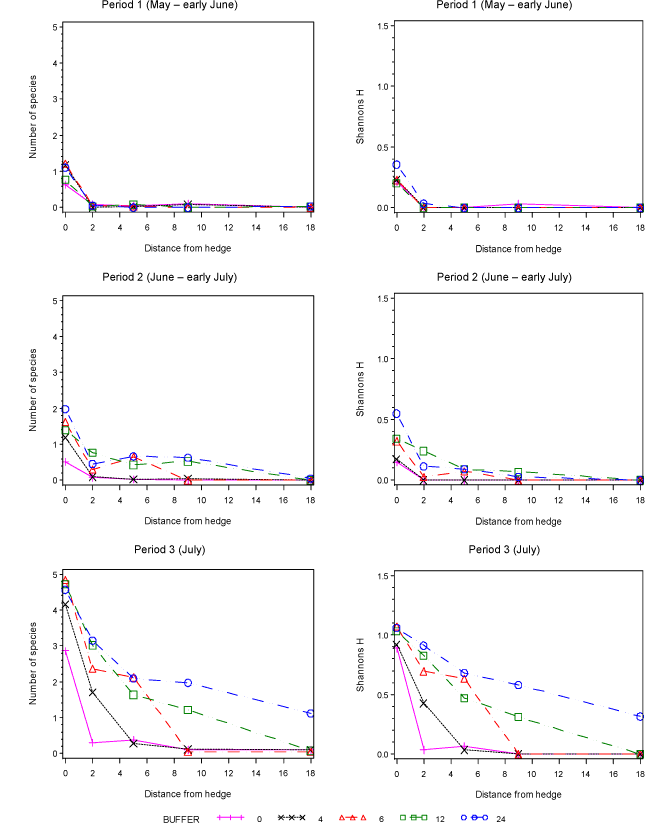
Fig. 3.21. Estimated average number (per 10 sweeps) of Heteroptera species (Left) and Shannon’s index (right) at each of the three sampling periods. Period 1: After herbicide application (May). Period 2: After first insecticide application (June). Period 3: After second insecticide application (July). In Appendix D, the 95% Confidence limits (Tables D.12 & 14) and significant differences at each distance (Tables D.13 & 15) are presented.
Version 1.0 November 2009, © Danish Environmental Protection Agency