Buffer zones for biodiversity of plants and arthropods: is there a compromise on width?
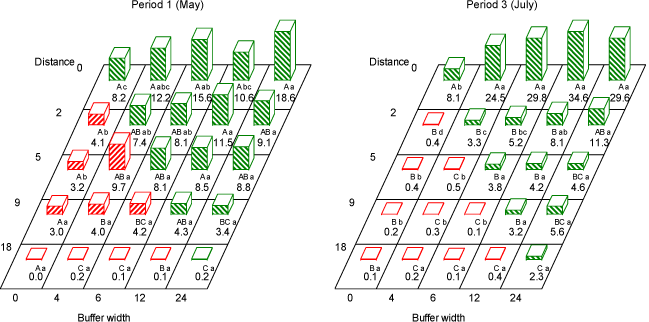
Fig. D.5. Estimated average number of Heteroptera (bugs per 10 sweeps) for each combination of buffer width (m) and distance from hedge (m). Red bars (hatched from lower left to upper right) are numbers in areas treated with fertilizer and pesticides. Green bars (hatched from upper left to lower right) are non-treated area (buffer zone). Within each buffer width, figures with the same capital letter are not significant different (P ≥ 5%). Within each distance, figures with the same lower case letter are not significant different (P ≥ 5%). For 95% confidence limits see Table D.10.
Version 1.0 November 2009, © Danish Environmental Protection Agency