Assessment of the consequences of a possible ban on phosphates in household detergents
Appendix C: ECO Lab model
Modelling the complexity of sewage treatment systems in Europe is not possible in EUSES, which cannot include combinations of highly sophisticated and less sophisticated STPs (Sewage Treatment Plants). Therefore, an emission/inventory model was developed with the aim to estimate the emission fractions of single detergent ingredients from household use on a country level. The model core is based on the national wastewater distribution pattern statistics. These data combined with the overall removal fractions by various types of sewage treatment systems enable the estimation of the emission fraction from complex sewage treatment systems consisting of many types of sewage treatment. The following types of treatments are considered in the inventory model:
E1: Mini STPs
E2: Septic tanks
E3: STPs with primary treatment
E4: STPs with secondary treatment
E5: STPs with tertiary treatment
E6: Direct emissions
Once a substance is emitted to surface water, a number of fate and transport processes will take place, e.g. advection, dispersion, sedimentation, degradation.
The modelling was carried out by combining a hydraulic model for the description of the water movements and a fate model. The fate model was programmed in an ECO Lab template and combined with the hydraulic model MIKE 21.
The hydraulic model needs a specification of the water body and meteorological data.
The Little Belt was chosen for the Danish surface water scenario, and meteorological data for April 2004 was used. Furthermore, the model needs a specification of the emission sources with respect to location and size. The specification of the emission sources with respect to position is illustrated in Figure C.1. Only STPs with tertiary and primary treatment are included in the scenario and only one source with direct discharge (summer cottage area) was included in the scenario.
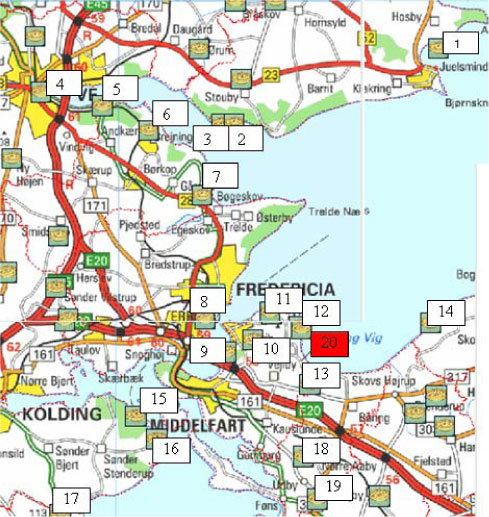
Figure C.1 Position of emission sources
The fate model includes the following fate processes:
Volatilization, where the model suggested by Schwarzenbach et al. (1993) is used. This model accounts for the effects of diffusion rates in water and air, Henry's law constant and air velocity on the rate of volatilization.
Net sedimentation, where a linear rate of sedimentation of suspended matter is assumed. Only substances bound to the suspended matter are assumed to sedimentate.
Biodegradation, where first order rate degradation kinetics are assumed. The influence of temperature on the biodegradation rate constant is described through an Arrhenius-like description: kbio(t) = kbio (t0)×eA(t-t0), where kbio(t) is the rate constant at temperature t, t0 is the reference temperature at which the reference biodegradation rate constant kbio(t0) is specified, and A is a temperature coefficient.
Photolysis, where the rate of photolysis is described by a first order degradation rate constant at the water surface and by the absorption of light through the water column.
Diffusion of the chemicals from the water column to the sediment is neglected. However, this process may be important for environments not previously exposed with a particular substance; if surfaces for sorption in the sediment are unsaturated (this situation is not likely for high volume chemicals). The concentration of the substances in top layer of the sediment is calculated by assuming that the sediment surface layer is in equilibrium with the overlying water.
The output of the model is predicted concentrations in surface water varying in time and space. For the further risk assessment, the following approach was used:
For each emission source, the average and maximum concentration in a volume around the point of discharge was derived
The 90th percentile concentration was derived for each type of emission source
The overall PEC to be used in the risk assessment was found by a weighted average (with respect to percentage of population connected to the type of wastewater treatment).
Version 1.0 December 2009, © Danish Environmental Protection Agency