Environmental Project No. 1322, 2010
The Advisory list for self-classification of dangerous substances
Ver. 2.1 (June 2010)
Contents
1 Introduction to classification and (Q)SAR
2 Creation and use of the advisory self-classification list
- 2.1 The selected dangerous properties
- 2.2 The evaluated chemical substances
- 2.3 Test data
- 2.4 Reliability of (Q)SAR-predictions
- 2.5 Validation
- 2.6 Applicability domain
- 2.7 Application of the models
- 2.8 The result
- 2.9 How the self-classification list can help manufacturers and importers to comply with the classification duties
Technical description of the self-classifications
- 2.10 Mutagenicity
- 2.11 Carcinogenicity
- 2.12 Reproductive toxicity
- 2.13 Acute oral toxicity
- 2.14 Sensitisation by skin contact
- 2.15 Skin irritation
- 2.16 Danger to the aquatic environment
- 3.1 Chemicals on AL2010 that were not on AL2001
- 3.2 Chemicals on AL2001 that are not on the current list
- 3.3 Conclusion
Annex 2. Analysis of positive predictions of cancer classification
Preface
The current report is a background report for the Danish EPA advisory self-classification list. The list is based on assessments from (Q)SAR researchers from the National Food Institute – Technical University of Denmark. The advisory self-classification list is available as a database via www.mst.dk.
This is a consolidated report, which includes documentation on all endpoints presently covered by the Danish EPA advisory self-classification list;
- CMR and danger to the aquatic environment (from 2009) /62/
- acute toxicity by oral intake (new 2010 update of 2001 endpoint)
- skin irritation (new 2010 endpoint)
- skin sensitisation from 2001 (not updated) /5/
This report provides the following background material:
- Chapter 1: A general regulatory background on hazard classification of chemicals and how (Q)SAR based assessments can be used in this context.
- Chapter 2: Description of the general methodology applied to make the advisory self-classifications.
- Chapter 3: Description of the (Q)SAR models and the (Q)SAR based assessments in relation to the individual hazard classification criteria.
- Chapter 4: Discussion and conclusions regarding comparisons of the current advisory self-classification list with the 2001 version of the list.
Summary
All chemical substances marketed in the EU must be classified and labelled according to the regulation on classification and labelling of dangerous substances /7/. Substances with harmonised classifications adopted in the EU are included in the List of harmonised classification and labelling of hazardous substances (Annex VI of 1272/2008/EU). This list covers around 7000 substances which have been classified for their hazardous properties. However, this also means that about 93,000 of the 100,204 existing substances in the EU (EINECS list), are not classified in a harmonised way. For these substances, it is the manufacturer's or importer's responsibility to carry out an appropriate classification of the dangerous intrinsic properties (“self-classification”). In most cases however, there are currently no test data (from animal testing, etc.) available on their properties in relation to human health or the environment hazards.
To address this issue, the Danish Environmental Protection Agency published the Advisory self-classification list in 2001 /5/.
The Advisory self-classification list is created by the use of (Q)SARs ((Quantitative) Structure-Activity Relationships) to predict the intrinsic properties and harmful effects of chemicals.
The updated Advisory self-classification list contains the results of a systematic assessment of 49,292 discrete[1] organic EINECS substances in relation to the following endpoints for which new and/or improved (Q)SAR model predictions were available:
- Mutagenicity
- Carcinogenicity
- Reproductive toxicity (possible harm to the unborn child)
- Acute oral toxicity
- Skin irritation
- Danger to the aquatic environment
The advisory classifications for mutagenicity, carcinogenicity, and danger to the aquatic environment are 2009 updates of the advisory classifications on the 2001 self-classification list, and reproductive toxicity is a new classification endpoint from 2009 /62/.
Acute oral toxicity is a new 2010 update of the advisory classifications from 2001, and skin irritation is a new 2010 endpoint.
The Advisory self-classification list also contains the 2001 results of a systematic assessment of approximately 47,000 EINECS substances for the following endpoint /5/:
- Skin sensitisation
For the classification endpoint skin sensitisation the advisory classifications of the Advisory self-classification list (2001) has been maintained. The reason is that technical issues related to new modelling tools prevented the update of these advisory classifications.
The updated advisory list is available as an Excel file for download and as an online searchable database from DK-EPA's website (http://www.mst.dk).
The consolidated Advisory self-classification list including the current 2001, 2009 and 2010 advisory classifications contains 34,292 chemicals with advisory classifications for one or more of the selected endpoints.
The advisory classifications are made by using combinations of (Q)SAR models relevant for each classification endpoint . This report describes the basic methodology used and how specific model predictions have been applied.
This report is an update of the report published in October 2009 /62/. One further update of the advisory list is planned; to modify the advisory classifications to meet the classification criteria set out in the new CLP-regulation for the classification and labelling of chemicals /7/.
[1] Discrete organic substance means organic substances with an unambiguous 2D structural formula.
Dansk sammenfatning
Alle kemiske stoffer, der markedsføres i EU, skal klassificeres og mærkes efter reglerne i klassificeringsbekendtgørelsen (Bek. nr. 329 af 16/5 2002) og listen over farlige stoffer (1272/2008/EU, bilag VI, tabel 3.2). Listen over farlige stoffer dækker i dag ca. 7.000 stoffer, hvis fareklassificering er blevet harmoniseret i EU. Det betyder, at omkring 93.000 af de 100.204 eksisterende stoffer i EU (EINECS-fortegnelsen) endnu ikke har undergået en harmonisering af deres fareklassificering. For disse stoffer er det producentens eller importørens ansvar at påføre en korrekt klassificering for stoffernes iboende farlige egenskaber (”selvklassificeringer”). Imidlertid er der for de fleste af disse stoffer kun få eller ingen test resultater (fra dyreforsøg m.m.) om stoffernes farlighed overfor mennesker eller miljø.
Som et bidrag til at afhjælpe denne problemstilling, offentliggjorde Miljøstyrelsen i 2001 den såkaldte selvklassificeringsliste /5/ og nærværende rapport beskriver opdateringen af denne liste. Selvklassificeringslisten er lavet ved brug af (Q)SAR modeller ((kvantitative) struktur-aktivitets sammenhænge), som er blevet brugt til at forudsige de iboende egenskaber og farlige virkninger af kemiske stoffer.
Modellerne er blevet anvendt til en systematisk vurdering af 49.292 organiske enkeltstoffer[2] fra EINECS-fortegnelsen for følgende effekter:
- Skader på arveanlæggene
- Kræftfremkaldende effekt
- Reproduktionstoksicitet (skader på afkommet)
- Akut dødelig virkning ved indtagelse
- Hud irritation
- Farlighed for vandmiljøet
De vejledende klassificeringer for skader på arveanlæggene, kræftfremkaldende effekt og farlighed for vandmiljøet er opdateringer af de vejledende klassificeringer på selvklassificeringslisten fra 2001 og vejledende klassificeringer for reproduktionstoksicitet er fra 2009 /62/.
Vejledende klassificeringer for akut dødelig virkning ved indtagelse er nye 2010 opdateringer af 2001 vejledende klassificeringer, og vejledende klassificeringer for hud irritation er nye fra 2010.
Den vejledende selvklassificeringsliste indeholder også resultaterne fra 2001 af en systematisk vurdering af ca. 47,000 EINECS stoffer for følgende effekt /5/:
- Allergifremkaldende effekt ved hudkontakt
De vejledende klassificeringer for allergifremkaldende effekt ved hudkontakt fra den tidligere vejledende selvklassificeringsliste er bibeholdt. Det skyldes, at tekniske forhold vedrørende de nye modelleringsværktøjer indtil videre har forhindret opdateringer af de vejledende klassificeringer, selvom nye modelværktøjer i mellemtiden er blevet udviklet og valideret.
Den opdaterede liste med selvklassificeringer er tilgængelig via Miljøstyrelsen hjemmeside (www.mst.dk) som Excel fil til download og som en søgbar online database.
Den konsoliderede vejledende selvklassificeringsliste inklusive de nuværende 2001, 2009 og 2010 vejledende klassificeringer indeholder 34.292 kemiske stoffer med vejledende klassificeringer for en eller flere af de udvalgte effekter.
De vejledende klassificeringer er lavet ved hjælp af kombinationer af (Q)SARs som er relevante for hver enkelt klassificering. Rapporten beskriver det principielle grundlag for at anvende sådanne modeller samt hvordan modellerne konkret er blevet anvendt i dette projekt.
Denne rapport er en opdatering af en rapport som blev publiceret i oktober 2009 /62/. Der er ydermere planlagt en opdatering af listens vejledende klassificeringer i forhold til klassificeringskriterierne opstillet i den nye CLP-forordning for klassificering og mærkning af kemiske stoffer /7/.
[2] Hermed menes organiske stoffer med en entydig 2D strukturformel.
1 Introduction to classification and (Q)SAR
1.1 Background
When chemical substances are classified in terms of the danger they represent, their inherent properties are assessed on the basis of the knowledge and information available /2, 60/. Such assessments are often carried out on the basis of laboratory test results because the hazard classification criteria to a large extent refer to such results. Assessment must be carried out individually for each property, which means that often extensive animal testing may be required for a single substance. Thus, complete identification of all the properties for which hazard classification criteria exist, at present requires results from many animal studies for just one substance.
Given the extensive requirements for data from animal studies in chemical hazard and risk assessment, it is not surprising that lack of test data represents a major problem in the assessment of dangerous properties of chemicals. It is a well-known fact that there are currently few or no test data for a very large fraction of the 100,204 chemical substances on the European INventory of Existing Commercial chemical Substances (EINECS) /3, 4, e.g. 36/.This means that many chemical substances within the European market may have unknown dangerous properties even though they have been used for many years.
With the new chemicals legislation in EU, REACH, new information demands for chemicals have been imposed in the EU. However, especially for chemicals produced in volumes below 10 tpa per manufacturer or importer in the EU it is unlikely that test data on a broad spectrum of dangerous properties will be available within the foreseeable future.
With the aid of mathematical modelling, so-called (Quantitative) Structure-Activity Relationships, (Q)SARs, for prediction of properties of chemicals can be established. Classifications based on (Q)SARs predicted dangerous properties can save time and money if used as an alternative to animal testing, as well as increase the level of information for chemicals that will not undergo testing. The Danish EPA in 2001 published the first version of the advisory self-classification list of dangerous substances (denoted AL2001 in the current report) /5/ where 20.624 substances were assigned advisory classifications according to the following dangerous properties: Acute oral toxicity, sensitisation by skin contact, mutagenicity, carcinogenicity, and danger to the aquatic environment.
1.2 Classification of chemicals
Criteria for classification, packaging and labelling of dangerous substances and preparations is harmonised in order to protect public health and the environment and ensure the free movement of such products /6, 7, 60/. Harmonised hazard labelling allows consumers to recognize dangerous substances and preparations easily and to take adequate measures as regards risk avoidance and safe handling and disposal.
Existing regulation
The present regulation for classification and labelling involves an evaluation of the hazard of a substance or preparation in accordance to Council Reg. 1272/2008/EU /7/ and a communication of that hazard via the label.
Classification of a substance or preparation is considered in relation to several endpoints concerning physical-chemical properties, health effects or environmental properties. This evaluation must be made for any substance or preparation manufactured within or imported into the EU and placed on the EU market. Classification and labelling is therefore an essential element of risk management measures of chemicals.
All marketed substances and preparations must be evaluated for hazard classification and labelling, irrespective of the quantity placed on the market. The labelling is the first and in practice often the only information on the hazards of a chemical that reaches the user, which could be a consumer or a worker. In addition the hazard classification has a large number of downstream consequences within the EU legislation.
New regulation
By January 2009 the new CLP regulation on classification, labelling and packaging of substances and mixtures has had legal effect in the EU /7/. This regulation will gradually replace the present regulation for classification and labelling. The new regulation will come into force for single substances December 1st 2010 and for mixtures June 1st 2015 /7/. Until December 1st 2010 substances and mixtures shall be classified labelled and packaged in accordance with the present legislation or they can be classified according to the CLP regulation.
The CLP regulation is based on the Globally Harmonised System of Classification and Labelling of Chemicals (GHS, UN 2007) /61/. The GHS classification criteria are in certain cases slightly different than those of the current legislation /7/.
1.3 (Q)SARs and their use in chemical assessment
Structure-activity relationships (SARs) and quantitative structure-activity relationships (QSARs), collectively referred to as (Q)SARs, are theoretical models that can be used to predict the physico-chemical, biological (e.g. toxicological) and environmental fate properties of molecules based on the chemical structure.
(Q)SARs tools are used more and more by authorities e.g. in the US and the EU, as well as by industry, to assess physico-chemical, (eco-)toxicological, and fate properties of substances.
REACH
In the new EU chemicals legislation, REACH, all other options, including use of (Q)SARs, should be considered before performing (or requiring) vertebrate testing /1/. Annex XI of REACH contains the following wording regarding (Q)SARs:
Results obtained from valid qualitative or quantitative structure-activity relationship models ((Q)SARs) may indicate the presence or absence of a certain dangerous property. Results of (Q)SARs may be used instead of testing when the following conditions are met:
- Results are derived from a (Q)SAR model whose scientific validity has been established,
- The substance falls within the applicability domain of the (Q)SAR model,
- Results are adequate for the purpose of classification and labelling and/or risk assessment, and,
- Adequate and reliable documentation of the applied method is provided.
There will be no formal adoption process for (Q)SARs under REACH. QSAR Model Reporting Formats (QMRF’s) to compile information on endpoint, training set, validation results etc. for individual models will be gathered in a JRC QSAR Model Database. There will not be made fixed criteria for how the (Q)SARs should perform to receive regulatory acceptance, but rather a learning-by-doing process to gain experience and common understanding of use of (Q)SARs in chemical assessments /9/.
In the hazard and risk assessment process, (Q)SARs are already often used in combination with other sources of information on chemicals, either to prioritise chemicals for further assessment, to supplement or to replace testing.
With the implementation of REACH it is expected that (Q)SARs will be used increasingly for the direct replacement of test data as their use, when available and adequate, is in fact an obligation /9/. The goal of assessing many thousands of chemicals under REACH may not be achievable without the use of (Q)SARs and other non-test methods. Especially for low tonnage chemicals, (Q)SARs and other non-test methods may also give further information beyond the standard information requirements of regulations such as REACH.
2 Creation and use of the advisory self-classification list
- 2.1 The selected dangerous properties
- 2.2 The evaluated chemical substances
- 2.3 Test data
- 2.4 Reliability of (Q)SAR-predictions
- 2.5 Validation
- 2.6 Applicability domain
- 2.7 Application of the models
- 2.8 The result
- 2.9 How the self-classification list can help manufacturers and importers to comply with the classification duties
Following development of new and/or improved (Q)SAR-models the list of advisory self-classification of dangerous substances has been updated and expanded. This chapter of the report presents the methodology applied.
2.1 The selected dangerous properties
The following endpoints were addressed using (Q)SARs :
- Mutagenicity
- Carcinogenicity
- Reproductive toxicity (possible harm to the unborn child)
- Acute oral toxicity
- Sensitisation by skin contact[3]
- Irritant
- Danger to the aquatic environment
(Q)SAR-predictions for these endpoints were used to assign the classifications listed in Table 1.
| Dangerous property | Classification | Risk phrase |
|---|---|---|
| Mutagenicity | Mut3;R68 | Mutagen, category 3; possible risk of irreversible effects |
| Carcinogenicity | Carc3;R40 | Carcinogen, category 3; possible risk of irreversible effects |
| Reproductive toxicity | Rep3;R63 | Reproductive toxicant, category 3, Possible risk of harm to the unborn child |
| Acute oral toxicity | Xn;R22 | Harmful if swallowed |
| T;R25 | Toxic if swallowed | |
| Tx;R28 | Very toxic if swallowed | |
| Sensitisation by skin contact | R43 | May cause sensitisation by skin contact |
| Irritant | Xi;R38 | Irritating to skin |
| Danger to the aquatic environment | N;R50 | Dangerous for the environment; very toxic to aquatic organisms |
| N;R50/53 | Dangerous for the environment; very toxic to aquatic organisms, may cause long-terms adverse effects in the aquatic environment | |
| N;R51/53 | Dangerous for the environment; toxic to aquatic organisms, may cause long-terms adverse effects in the aquatic environment | |
| R52/53 | Harmful to aquatic organisms, may cause long-terms adverse effects in the aquatic environment |
Table 1: Advisory classifications in the consolidated AL
2.2 The evaluated chemical substances
The overall purpose of the current project was to evaluate as many chemical substances as possible with relevance to the existing regulation for chemicals within the EU.
Under REACH /1/ all chemicals with tonnages above 1 ton/year should undergo pre-registration between June 1st 2008 and December 1st 2008. It would have been relevant to evaluate all chemicals in this inventory but at the time of preparation of the advisory classification list no official list existed.
It was therefore decided to base the evaluations on the EINECS list /3,4/. This list consists of 100,204 entries, covering organic and inorganic substances in both single substance entries (mono-constituent substances) and mixtures (multi-constituent substances and UVBCs).
The exercise was limited to cover "discrete organics," meaning that multi-constituent substances and UVCBs (Unknown, Variable Composition and Biologicals) were excluded for practical reasons – “if you don’t know what it is, you can’t model it”.
Inorganic substances have likewise not been evaluated. These are usually better approached by simpler methods of evaluating the availability of the respective an- and cations with well-known hazard profiles. "Organo-metallics" have also been excluded as being poor candidates for modelling. As an error check, only such structural representations, which could be successfully converted to 3D were used /10/.
When it was possible using a CAS number comparison, all substances already classified on the list with formal EU harmonized classifications, Annex I of Directive 67/548/EEC (List of dangerous substances, /2/) were also removed. However, as there is no official overview of the substances covered by the group entries in Annex I, and because a chemical may have more than one CAS number, a few chemicals covered by Annex I may not have been removed from AL2009.
This resulted in a total of 49,292 discrete organic substances, or about half of all EINECS chemicals, which could be subjected to (Q)SAR based assessment.
2.3 Test data
For the vast majority of the assessed chemicals no test data were available. However, if test data were available as part of the (Q)SAR-model, this was generally used in preference to the estimates.
It is important to stress that no attempt was made to search published or unpublished databases for toxicological, ecotoxicological or environmental fate information to determine whether a (Q)SAR was necessary for any endpoint assessed.
2.4 Reliability of (Q)SAR-predictions
The reliability of (Q)SAR-predictions depend on numerous parameters relating to the mathematical methods used, the number and precision of the underlying data used for developing the model and how suitable the model is for the particular substance.
In general the uncertainty of (Q)SARs is caused predominantly by two different reasons: a) the inherent variability of the input data used to establish the model (training set); and b) the uncertainty resulting from the fact that a model can only be a partial representation of reality (in other words it does not model all possible mechanisms concerning a given endpoint and it does not cover all types of chemicals). However, as a model averages the uncertainty over al chemicals, it is possible for an individual model estimate to be more accurate than an individual measurement /9/.
The reliability of (Q)SAR predictions can be described in many ways. Usually a range of parameters and concepts are used (see e.g. /9/ for a more extensive review). These concepts may not be known by all readers. Annex 1 contains descriptions of the concepts applied in this report.
2.5 Validation
Validation is a trial of the model performance for a set of substances independent of the training set, but within the domain of the model. The model predictions for these substances are compared with measured endpoints for the substances in order to establish the predictivity of the model.
Ideally all models should be assessed by checking how well they predict the activity of chemicals, which were not used to make them. This is, however, not always simple. In part valuable information may be left out by setting aside chemicals to be used in such an evaluation, and in part it can be extremely difficult to assess how “external” chemicals relate to the model’s domain; that is, if they represent a random distribution within this applicability domain and thereby giving a fair picture of the predictivity of the model.
This problem is often addressed by using cross-validation, where a number of partial models are “externally validated” by splitting the training set into a reduced training set and a testing set. The reduced training set is used to develop a partial model, while the remaining data are used as a test set to evaluate the model predictivity.
This is repeated a number of times and the results are used to calculate the predictivity measures for the models; for quantitative models in the form of Q² and SDEP (standard deviation error of prediction), and for qualitative (yes/no) models in the form of sensitivity, specificity and concordance (se Annex 1 and refs /9/ and /11/ for further details).
While drawbacks of cross-validation exist /14, 15/, much of the criticism is directed towards a particular form of cross validation; the leave-one-out cross-validation /14/. In the validations carried out on the models applied in this project the more stable leave-many-out (LMO) cross-validation approach by leaving out random pos/neg balanced sets of 50% of the chemicals, repeated ten times, was used (se also the indicated LMO 50 % values in the tables in chapter 3) /13/. Leaving out 50% of the chemicals in the partial validation models is a large perturbation of the training set, which generally leads to realistic, and often pessimistic, measures of the predictivity of the model.
The commercial models for acute oral toxicity and cancer were validated by external validation /24/.
Concordance will vary depending on both the method used, and the endpoint in question. In general, accuracy of contemporary (Q)SAR systems can often correctly predict the activity of about 70 – 85% of the chemicals examined, provided that the query structures are within the domains of the models. This also applies to the models described in this paper.
QSAR Model Reporting Formats (QMRF’s) for all the toxicity models applied in this project, including training sets for the DK models, have been submitted to the EU JRC QSAR Model Database and the OECD QSAR Application Toolbox /35, 37/.
2.6 Applicability domain
When applying (Q)SARs it is important to assure that an obtained prediction falls within the domain of the models i.e., that there is sufficient similarity (in relevant descriptors) between the query substance and substances in the training set of the model.
There is no single and absolute applicability domain for a given model /9/. Generally, the broader the applicability domain is defined the lower predictivity can be expected. The applicability domain should be clearly defined and the validation results should correspond to this defined domain, which is again used when the model is applied for predictions.
The applicability domains for MultiCASE models as defined by the US Food and Drug Administration (FDA) /24/ and implemented in the MultiCASE software were used in this project. No warnings in the predictions were accepted, except warning for one unknown fragment in chemicals where a significant biophore has been detected. Only positive predictions where no significant deactivating fragments were detected were accepted.
For the acute oral toxicity predictions from the Pharma ToxBoxes, reliability indexes (RI) are given by the software. Based on an analysis performed by DTU Food on an external validation set provided by Pharma Algorithms Inc. / ACD/Labs, an RI cut-off of 0.5 was applied in this project.
The EPISUITE models for rapid biodegradation /43, 45/ and the bioconcentration factor in fish /42/ do not automatically flag the predictions for domain coverage. No attempts have been made to consider the applicability domain for predictions made by these models.
Depending on the endpoint in question, predictions outside the applicability domain were obtained for between 27 and 58% of the chemicals examined by the individual MultiCASE and Pharma ToxBoxes models.
2.7 Application of the models
It is important to note that the applied models in principle do not predict a "classification" – they predict a biological activity that may lead to a classification.
Because of the large number of chemicals involved, “rules” were used for each endpoint to try and link the biological prediction with a risk phrase. In essence the process is not different than that imposed upon a human expert forced to interpret the information available in order to comply with the duty to make an assessment and self-classification.
The applied models have been used in combinations / batteries within the chosen classification endpoints to reach a final call in an attempt to reach further reliability beyond individual model predictions and to best comply with the classification criteria.
2.8 The result
The result of the computer-based assessment is this consolidated advisory self-classification list, which comprises 34,292 chemical substances with advisory classifications for one or more of the dangerous properties selected.
The results only represent POSITIVE predictions (for quantitative models “positive” here means predicted to have the effect or property as determined in relation to a cut-off point). No distinction has been made between a negative prediction for an endpoint, and an unreliable prediction (prediction outside the applicability domain of the model), which was simply discarded.
Evaluated substances which are not on the list, or substances which are on the list but without advisory classifications for one or more of the selected dangerous properties, may have been predicted as not having this / these dangerous property(ies), or the models may not have been valid for this substance (i.e. predictions were outside the applicability domain for these models).
Therefore the advisory list cannot be used to conclude that these substances do not possess dangerous properties.
Another important point is that the advisory self-classification list represents (Q)SAR based identifications of possible hazardous properties of the included chemicals; no attempt has been made to evaluate the risk that these chemicals constitute in their current use in the EU.
All results are available on the website of the Danish EPA (www.mst.dk) where searches can be made on substance name (in Danish), CAS-number, EINECS number, EINECS name, CAS number and chemical formula. The whole list can also be downloaded via www.mst.dk as an Excel file.
Figure 1: Number of substances with individual advisory classifications
2.9 How the self-classification list can help manufacturers and importers to comply with the classification duties
By making the advisory self-classification list available to the public, the Danish EPA wishes to offer manufacturers and importers a tool, which is based on predictions from sophisticated modelling software. The predictions have been interpreted in relation to the hazard classification criteria and transformed into advisory classifications which are easy to use. They can be applied when carrying out self-classification of chemical substances for the dangerous properties included in the list.
If available, reliable test data or predictions using other non-test methods on specific substances should always be considered in parallel to computer predictions and expert judgements in a weight of evidence (WoE) approach to decide on the appropriate classification for a given endpoint.
It is recommended that the list is used in the following way in the classifications of chemicals:
- Examine if the substance is on Annex VI, table 2 of the EU regulation for classification, labelling and packaging of dangerous substances /6/. If so it should be classified accordingly. For non-classified endpoints no classification can be recommended.
- If the substance is not in Annex VI, table 2, it should be classified according to the criteria in the regulation for classification, packaging and labelling of dangerous substances /6/ using all available test and non-test data.
- In cases where other reliable information does not exist for a substance for the endpoints covered by this list, the Danish EPA recommends the use of the advisory classifications given in the Advisory self-classification list.
[3]For the endpoint sensitisation by skin contact the methodology undertaken was slightly different with a start list with somewhat fewer chemicals, etc. Details are given in the documentation report from 2001 /5/.
Technical description of the self-classifications
- 2.10 Mutagenicity
- 2.11 Carcinogenicity
- 2.12 Reproductive toxicity
- 2.13 Acute oral toxicity
- 2.14 Sensitisation by skin contact
- 2.15 Skin irritation
- 2.16 Danger to the aquatic environment
The current chapter gives the detailed description of how the advisory classifications were assigned to the chemicals in the advisory self-classification list. This includes description of the classification rules and the (Q)SARs used for predicting the dangerous properties of the chemicals.
2.10 Mutagenicity
The criteria for classification for mutagenicity are divided into 3 different categories:
Classification as mutagen, category 1 (Mut1;R46, May cause heritable genetic damage) is based on evidence of a causal association between human exposure to the substance and heritable genetic damage.
Classification as mutagen, category 2 (Mut2;R46, May cause heritable genetic damage) is based on animal studies showing mutagenity to germ cells either in assays on germ cells or by demonstrating mutagenic effects in somatic cells in vivo or in vitro as well as metabolic proof that the substances reaches the germ cells.
The criteria for classification as mutagen, category 3 (Mut3;R68, Possible risks of irreversible effects) is based either on in vivo mutagenicity tests or on cellular interactions with in vitro tests acting as supportive evidence. For this classification, it is not necessary to demonstrate germ cell mutations.
(Q)SAR based evaluation
Five models predicting genotoxicity in vivo endpoints were applied in the screening. Data for the training sets were obtained from the literature. The technical specifications for the models are given in Table 2.
Drosophila melanogaster Sex-Linked Recessive Lethal (SLRL) (in vivo)
The training set consists of data from Lee et al. /16/. In the experimental method, Drosophila melanogaster males and females are used. Males are treated with the test substance and mated individually to virgin females. The test detects the occurrence of mutations, point mutations and small deletions, in the germ line of the insect. The mutations are phenotypically expressed in males carrying the mutant gene. When the mutation is lethal in the hemizygous condition, its presence is inferred from the absence of one class of male offspring out of the two that are normally produced by a heterozygous female. The assay has a low sensitivity for genotoxins other than direct-acting agents and simple promutagens, but a very high specificity, which means that in general a positive result has considerable value for prediction of potential genotoxicity in mammals.
Mutations in mouse micronucleus (in vivo)
The training set includes data from Hayashi et al. /17/, Mavournin et al. /18/, Waters et al. /19/, and Morita et al. /20/. The test detects micronuclei produced by damage to the chromosomes or the mitotic apparatus in red blood cells. Micronuclei are small nuclei produced during cell division. They contain chromosome fragments or whole chromosomes. In the test, mice are exposed to the test substance and young red blood cells (erythrocytes) from the bone marrow are isolated and analysed for micronucleus. The test is especially relevant to assess mutagenic hazard in that it allows consideration of factors of in vivo metabolism, pharmacokinetics and DNA-repair processes.
Dominant lethal effect in rodents (in vivo)
The training set is comprised of data from Green et al. /21/ and other references. In the experimental method, mice and rats are used. Treated males are mated to virgin females according to an experimental scheme. Females are sacrificed in the second half of pregnancy and uterine contents are examined to determine the number of implants and live and dead embryos. The category of early embryonic deaths is the most significant index of dominant lethality and as such used as endpoint. The test identifies major genetic damage, mainly the induction of structural and numerical chromosomal anomalies.
Sister chromatid exchange in mouse bone marrow (in vivo)
Data from Tucker et al. /22/ are used in the training set. The sister chromatid exchange (SCE) assay detects interchange of DNA between two sister chromatids of a duplicating chromosome. Mice are exposed to the test chemical. Then a thymidine analog, bromodeoxyuridine (BrdU) is injected. If DNA exchanges occur, BrdU can be identified by use of a fluorescence technique in chromosomes in the metaphase. The test is considered to be a sensitive method for evaluating mutagenicity and may be an indicator of carcinogenicity.
Comet assay in mouse (in vivo)
The training set includes data from Sasaki et al. /23/ plus a number of physiological chemicals theoretically assumed not to have the effect (such as various amino acids, sugar molecules, fatty acids etc.). The latter was included to get a better distribution between positives and negatives in the training set for the model). Included in the training set of the model are results from eight tissue types; stomach, colon, liver, kidney, bladder, lung, brain and bone marrow. The comet assay detects DNA strand break and can be applied to virtually any organ of interest. In the experimental test, a microgel electrophoretic technique is used for detecting DNA damage at cell level. The tested chemical is positive if it produces breaks in DNA-strings, resulting in small strings of DNA that are able to migrate further in a microgel, than intact DNA strings. In the microscope, damaged DNA is seen as a “comet” while not damaged DNA appear as a dot. If appropriately performed, the test has been shown to be reliable with high sensitivity to detect DNA damage in organs that cannot be investigated in other classical mutagenicity assays.
| Model | Technical summary |
|---|---|
| Drosophila melanogaster Sex-Linked Recessive Lethal (in vivo) | MultiCASE, DK model Training set: n=377 Cross-validation 10*50% gave Sensitivity: 73.9% Specificity: 88.0% Concordance: 81.6% Domain: 48% |
| Mutations in mouse micronucleus (in vivo) | MultiCASE, DK model Training set: n=358 Cross-validation 10*50% gave Sensitivity: 30.1% Specificity: 84.5% Concordance: 66.1% Domain: 59% |
| Dominant lethal mutations in rodent (in vivo) | MultiCASE, DK model Training set: n=191 Cross-validation 10*50% gave Sensitivity: 41.3% Specificity: 95.2% Concordance: 75.9% Domain: 42 |
| Sister chromatid exchange in mouse bone marrow (in vivo) | MultiCASE, DK model Training set: n=265 Cross-validation 10*50% gave Sensitivity: 70.4% Specificity: 86.9% Concordance: 85.5% Domain: 53% |
| COMET assay in mouse (in vivo) | MultiCASE, DK model Training set: n=286 Cross-validation 10*50% gave Sensitivity: 63.3% Specificity: 93.3% Concordance: 83.9% Domain: 45% |
Table 2: Technical summary for the mutagenicity models
Figure 2: Schematic diagram illustrating the systematic evaluation applied to assign advisory classifications for mutagenicity.
For a substance to be selected as a probable mutagen it was necessary for the following criteria to be fulfilled: Positive prediction in two or more models, accepting only predictions where no significant deactivating fragments were detected. If one or more positive tests could be seen (as part of the training sets for the models) for any genotoxicity endpoint, this took precedence over model predictions.
When classification is proposed on basis of test data, a positive result in a single in vivo test is sufficient evidence on which to base the classification. In contrary to that, positive predictions in at least two models were required.
5,742 of the chemicals investigated in the current project met the criteria in the systematic evaluation and were assigned advisory classifications Mut3;R68.
2.11 Carcinogenicity
This endpoint can result in classification in 3 different categories:
Classification as carcinogen in category 1 (Carc1;R45, Toxic; May cause cancer, or Carc1;R49, Toxic; May cause cancer by inhalation) is based on a strong causal relationship in humans.
Classification as carcinogen in category 2 (Carc2;R45, Toxic; may cause cancer, or Carc2;R49, Toxic; may cause cancer by inhalation) is based on conclusive animal data from 2 species or 1 species with supportive evidence such as genotoxic effects in vitro or in vivo.
Classification as carcinogen in category 3 (Carc3;R40, Harmful; Possible risks of irreversible effects”) is subdivided into two:
- Well-investigated substances with restricted tumorigenic effects. It is normally based on clear data of tumour formation in one species. Mutagenicity data in vitro and in vivo can be used as supportive evidence.
- Substances that are insufficiently investigated, but raising concern for man.
(Q)SAR based evaluation
Four models predicting carcinogenicity in vivo and models predicting three genotoxicity in vitro endpoints were applied in the screening. Commercial MultiCASE training sets constitutes the basis of the carcinogenicity models. The technical specifications for the models are given in Table 3.
Carcinogenicity male and female, rats and mice (in vivo)
The models are the MultiCASE commercial models AG1-4 /24/. The training sets were constructed using the NTP (US National Toxicology Program) rodent carcinogenicity database, the Lois Gold Carcinogen Potency Database, FDA/CDER (US Food and Drug Administration / Center for Drug Evaluation and Research) archives, and the scientific literature. Training sets include both non-proprietary and proprietary data. Proprietary (confidential) data constitute around ten percent of the training sets. The open models based on the non-proprietary data were also available and consulted in the screening process.
In the experimental test, the test substance is administered by an appropriate route to the animals for a major portion of their lifespan. The highest dose level should elicit signs of toxicity, without substantially altering the normal lifespan due to effects other than tumours. During and after exposure, the animals are observed daily to detect signs of toxicity, particularly the development of tumours.
Reverse mutation test, Ames (in vitro)
The training set is from Kazius et al. /25/. The bacterial reverse mutation test detects point mutations, which involve substitution, addition or deletion of one or a few DNA base pairs. Amino-acid (histidin) requirering strains of Salmonella typhimurium are used. Mutations, which revert mutations present in the test strains and restore the functional capability of the bacteria to synthesise the amino acid (histidin), are detected. These appear by the ability of the bacteria to grow in the absence of histidin required by the parent test strain. The test is a useful tool as an initial screen for potential in vivo genotoxic activity, and has become the most extensively used in vitro short-term test in the screening for mutagenicity.
Chromosomal aberration CHO/CHL (in vitro)
This model was used by Niemela and Wedebye /28/ to evaluate the OECD principles for development and validation of (Q)SARS /27/. The Chinese Hamster Ovary (CHO) model is the commercial MultiCASE model A61 /26/ and the training set for the Chinese Hamster Lung (CHL) model was taken from Ishidata /28,29/. The in vitro mammalian chromosome aberration test identifies agents that cause structural chromosome aberrations in cultured cells. Chromosome damage is expressed as breakage of single or both chromatids, sometimes followed by reunion between chromatids or of both chromatids at an identical site. Many compounds that are positive in this test are mammalian carcinogens causing DNA damage.
Mutations in mouse lymphoma (in vitro)
The training set is comprised of data from Grant et al. /30/. The mouse lymphoma assay detects mutations affecting the heterozygous thymidine kinase (TK) locus. It identifies chemicals acting as clastogens (delete, add, or rearrange chromosome sections) as well as point mutagens. Mutations in genes coding for TK are identified. TK is involved in the phosphorylation of thymidin and subsequently in the formation of DNA. Positive chemicals may give rise to mutations in genes coding for TK. A mutation may result in loss of the ability to phosphorylate the pyrimidin analogs, which is detected by the test. The assay has a reputation for high sensitivity and low specificity of detecting genotoxic agents. However, in this exercise the model is used to give mechanistic information to chemicals already predicted to be carcinogens.
| Model | Technical summary |
|---|---|
| Carcinogenicity in male rat (in vivo) | MultiCASE, AG1 Training set: n=1381 External validation (100 chemicals): Sensitivity: 58.6% Specificity: 97.6% Concordance: 75.0% Domain: 70% |
| Carcinogenicity in female rat (in vivo) | MultiCASE, AG2 Training set: n=1376 External validation (100 chemicals): Sensitivity: 58.6% Specificity: 97.6% Concordance: 75.0% Domain: 70% |
| Carcinogenicity in male mouse (in vivo) | MultiCASE, AG3 Training set: n=1252 External validation (100 chemicals): Sensitivity: 58.6% Specificity: 97.6% Concordance: 75.0% Domain: 71% |
| Carcinogenicity in female mouse (in vivo) | MultiCASE, AG4 Training set: n=1263 External validation (100 chemicals): Sensitivity: 58.6% Specificity: 97.6% Concordance: 75.0% Domain: 71% |
| Reverse mutation test, Ames (in vitro) | MultiCASE, DK model Training set: n=4102 Cross-validation 10*50% gave Sensitivity: 84.4% Specificity: 82.5% Concordance: 83.5% Domain: 73% |
| Chromosomal aberration CHO (in vitro) | MultiCASE, A61 Training set: n=233 Cross-validation 10*50% gave Sensitivity: 32.0% Specificity: 91.2% Concordance: 69.9% Domain: 45% |
| Chromosomal aberration CHL (in vitro) | MultiCASE, DK model Training set: n=600 Cross-validation 10*50% gave Sensitivity: 57.8% Specificity: 86.5% Concordance: 74.3% Domain: 64% |
| Mutations in mouse lymphoma (in vitro) | MultiCASE, DK model Training set: n=555 Cross-validation 10*50% gave Sensitivity: 68.5% Specificity: 86.3% Concordance: 79.2% Domain: 64% |
Table 3: Technical summary for the carcinogenicity models
Identification of carcinogenic substances
For a substance to be selected as a probable carcinogen it was necessary for the following criteria to be fulfilled: Positive according to the ICSAS methodology /24/, corresponding to two or more positive carcinogenicity predictions, accepting only predictions for chemicals without significant deactivating fragments.
If one or more positive tests could was observed (as part of the training sets for the models) for any cancer endpoint, this took precedence over model predictions. As the models are heavily biased towards making a correct prediction for substances used to make them the latter criterion only resulted in little change. However, it was felt that there was no reason to artificially reduce the quality of the advisory classification by neglecting to use data, which happen to be present.
One or more negative tests in the training set of each model also took precedence over predictions of that model, except in cases where positive training set tests were present in other cancer models.
Employing this carcinogenicity identification algorithm resulted in a list of 3,726 positive predictions.
Figure 3: Schematic diagram illustrating the systematic evaluation applied to assign advisory classifications for carcinogenicity.
Identification of genotoxic carcinogens
While there are many non-genotoxic carcinogens acting by a wide variety of often-unknown mechanisms, it was chosen to focus here on chemicals likely to cause cancer through a genotoxic mechanism. Therefore, a further selection criterion for genotoxicity was set up.
As opposed to the selection criteria for mutagenicity, not all genotoxic carcinogens are necessarily clastogenic (cause loss, addition or rearrangement of parts of chromosomes). To select the genotoxic chemicals from the chemicals already predicted positive for in vivo carcinogenicity,which include genotoxic as well as non-genotoxic carcinogens, a battery of models for sensitive in vitro genotoxicity endpoints was used.
The genotoxicity criterion was a positive estimate in one or more of the models for the following in vitro genotoxicity endpoints; Reverse mutation test (Ames), chromosomal aberrations (CHO/CHL), or mutations in mouse lymphoma.
A schematic diagram of the systematic evaluation is given in Figure 3. According to these criteria, 3,726 of the chemicals assessed in the current project were identified as genotoxic carcinogens and selected for advisory classification for carcinogenicity. It is not felt that the models employed allow discrimination between classification in the three categories, so the lower classification Carc3;R40 was applied in all cases.
2.12 Reproductive toxicity
This endpoint can result in classification in 3 different categories:
Classification as toxic to reproduction in category 1 (Rep1;R60, Toxic; May impair fertility, or Rep1;R61, Toxic; May cause harm to the unborn child) is based on a strong causal relationship in humans.
Classification as toxic to reproduction in category 2 (Rep2;R60, Toxic; May impair fertility, or Rep2;R61, Toxic; May cause harm to the unborn child) is based primarily on animal data, and secondly on “other relevant information”. Data from in vitro studies, or studies on avian eggs, are regarded as “supportive evidence” and would only exceptionally lead to classification in the absence of in vivo data.
Classification as toxic to reproduction in category 3 (Rep3;R62, Harmful; Possible risks of impaired fertility, or Rep3;R63, Harmful; Possible risk of harm to the unborn child) is based primarily on animal data, and secondly on “other relevant information”. Substances in category three are insufficiently investigated, but raising concern for man.
Classification for reproductive toxicity covers a wide range of effects on either fertility or to the developing organism before and after birth (structural or functional damage). The (Q)SAR models applied in the current project only cover certain but far from all types of harm to the unborn child. Hence only certain types of mechanisms causing malformations or foetal mortality are covered.No (Q)SAR models were used for effects concerning other types of developmental toxicity and fertility.
(Q)SAR based evaluation
Three models predicting in vivo teratogenicity or fetal lethality related endpoints were applied in the assessment. A commercial MultiCASE training set constitutes the basis of one model. Data for the training sets for the two other models were obtained from the literature. The technical specifications for the models are given in Table 4.
Teratogenic risk (in vivo)
The model is the MultiCASE commercial model A49 /31/. The training set is composed of data taken from the TERIS (Teratogen Information System) and a compilation in which the FDA (US Food and Drug Administration) definitions were used to quantify risk of developmental toxicity from drugs used during pregnancy. The training set consists of clinical and epidemiologicdata. Many biological mechanisms are involved in the effects.
Drosophila melanogaster SLRL effect (in vivo)
The training set consists of data from Lee et al. (1983) /32/. In the experimental method, Drosophila melanogaster males and females are used. Males are treated with the test substance and mated individually to virgin females. The test detects the occurrence of mutations, point mutations and small deletions, in the germ line of the insect. The mutations are phenotypically expressed in males carrying the mutant gene. When the mutation is lethal in the hemizygous condition, its presence is inferred from the absence of one class of male offspring out of the two that are normally produced by a heterozygous female. The assay has a low sensitivity for genotoxins other than direct-acting agents and simple promutagens, but a very high specificity.
Dominant lethal effect in rodents (in vivo)
The training set is comprised of data from Green et al. (1985) /33/ and other references /21/. In the experimental method, mice and rats are used. Treated males are mated to virgin females according to an experimental scheme. Females are sacrificed in the second half of pregnancy and uterine contents are examined to determine the number of implants and live and dead embryos. The category of early embryonic deaths is the most significant index of dominant lethality and as such used as endpoint. The test identifies major genetic damage, mainly the induction of structural and numerical chromosomal anomalies.
| Model | Technical summary |
|---|---|
| Teratogenic risk in humans (in vivo) | MultiCASE, A49 Training set: n=323 Cross-validation 10*50% gave Sensitivity: 50.2% Specificity: 91.3% Concordance: 79.3% Domain: 48% |
| Mutations in Drosophila melanogaster SLRL (in vivo) | MultiCASE, DK model Training set: n=377 Cross-validation 10*50% gave Sensitivity: 73.9% Specificity: 88.0% Concordance: 81.6% Domain: 48% |
| Dominant lethal mutations in rodent (in vivo) | MultiCASE, DK model Training set: n=191 Cross-validation 10*50% gave Sensitivity: 41.3% Specificity: 95.2% Concordance: 75.9% Domain: 42% |
Table 4: Technical summary for the models for reproductive toxicity.
The dominant lethal test in rodents and the Drosophila SLRL test are initially meant for genotoxicity effects on germ cells, but the resulting effect is early embryonic deaths and lethal effect on offspring, respectively. Therefore, the endpoints are relevant for reproductive toxicity assessment.
In many cases, a toxicological threshold is assumed to exist for reproductive toxicity. With mutagenic chemicals this may not be the case.
Figure 4: Schematic diagram illustrating the systematic evaluation applied to assign advisory classifications for reproductive toxicity.
For a substance to be selected as probable toxic to reproduction in the assessment, the criterion was a positive prediction in any of the three models and without a negative prediction in the teratogenic risk in humans model (see Figure ) (see also /34/).
The screening resulted in a list of 4,036 positive predictions. The models employed do not allow discrimination between classification in the three classification categories, so the lower classification Rep3;R63 was applied in all cases.
2.13 Acute oral toxicity
The formalized criteria for classification for acute oral toxicity includes a number of options of tests including fixed-dose procedure and interpretation of the various sources of information about acute oral toxicity, but is often based on acute LD50 tests in the rat for which the following classification criteria are used:
| Classification | Classification criteria |
|---|---|
| Tx;R28 (very toxic; very toxic if swallowed) | LD50 oral, rat = 25 mg/kg |
| T;R25 (toxic; toxic if swallowed) | 25 mg/kg < LD50 oral, rat = 200 mg/kg |
| Xn;R22 (harmful; harmful if swallowed) | 200 mg/kg < LD50 oral, rat = 2,000 mg/kg |
Table 5: EU criteria for classification for acute oral toxicity
2.13.1 (Q)SAR based evaluation
If test results measured in the rat were readily available (had been used to make the model) these took precedence over any predictions.
Moreover, as acute toxicity data from the mouse following a variety of different routes of administration was also available in some cases, this was used to predict rat oral LD50’s using the QAARs (Quantitative activity-activity relationships) preferentially as follows /63,64/:
| 1. | Log LD50 oral, rat = 0.190 + 0.953 * (Log LD50 oral, mouse) RTECS data 1989, n=1257, R² = 0.82 |
| 2. | Log LD50 oral, mouse = 0.682 + 0.373 * (Log LD50 iv, mouse) + 0.518 * (Log LD50 ip, mouse) RTECS data 1994, n = 286, R² = 0.766, Q² = 0.764 |
| 3. | Log LD50 oral, mouse = 0.731 + 0.841 * (Log LD50 ip, mouse) RTECS data 1994, n=286, R² = 0.724, Q² = 0.724 |
| 4. | Log LD50 oral, mouse = 0.945 + 0.802 * (Log LD50 iv, mouse) RTECS data 1994, n=286, R² = 0.689, Q² = 0.688 |
iv: intravenous
ip: intraperitonial
Table 6: QAAR equations for acute oral toxicity correlating mouse and rat data by different routes
Biological data consisting of LD50’s in mice or rats was available for about 15% of the chemicals processed.
If no test data were available, rat oral LD50 was estimated according to the Pharma Algorithms Inc. ToxBoxes (vers. 2.9) acute toxicity LD50 for Rat (oral) which is based on RTECS (Registry of Toxic Effects of Chemical substances) and ESIS (European Survey of Information Society) data for 8,631 substances /65, 67/.
In the Pharma ToxBoxes predictions of LD50 are given together with applicability domain estimates in the form of reliability indexes (RI=Reliability Index), which take into account the similarity of the query compound to the training set, the difference between predicted LD50 and experimental values for similar compounds, and the consistence of experimental values for similar compounds.
An external validation of this model using a test set with 2,167 tests from Pharma Algorithms gave a multiple R-squared of 0.524. When using a RI of 0.5, the R-squared went up to 0.639 for the 1,332 tests that met this RI cut-off.
This is a significant improvement over the TOPKAT model which was applied as basis for advisory classifications for acute oral toxicity in the 2001 version of the list. This TOPKAT model was evaluated by external validation with 1,840 chemicals resulting in an R-squared of 0.31.
| Model | Technical data |
|---|---|
| Acute toxicity LD50 for Rat (in vivo), oral | Pharma ToxBoxes version 2.9 Commercial model Training set: n=8,631 External validation with 2,167 tests gave: At RI set to 0.5; N=1,332 R2=0.639 Domain: 51% |
Table 7: Technical summary for the Pharma ToxBoxes acute toxicity model
In modern acute oral toxicity tests using small numbers of animals, statistical variation is often within a factor of 2-4, and inter-laboratory variations of up to an order of magnitude is not uncommon /66/.
The accuracy of the Pharma model is considered to be sufficient to differentiate between the three different levels of acute toxicity (“harmful”, “toxic” and “very toxic”).
A schematic diagram of the systematic evaluation is given in figure 5.
This resulted in 13,873 substances with an advisory classification of Xn;R22, 1,184 substances with an advisory classification of T;R25 and 168 substances with an advisory classification of Tx;R28. In total 15,225 substances with advisory classifications for acute oral toxicity.
Figure 5: Diagram illustrating the systematic evaluation used to assign advisory classifications for acute oral toxicity
2.14 Sensitisation by skin contact
The current advisory classifications for sensitisation by skin contact originate from 2001 and have not been updated. The general documentation on the assessments undertaken - start list, criteria for application domain etc. - can be found in the documentation report from 2001 /5/. No attempt to search for and exclude chemicals with advisory classifications for skin sensitization, which have received harmonized EU classifications since 2001 have been made. The general advice on the use of the advisory self-classification list is to first check whether the substance in question has harmonized EU classifications and if so classify accordingly.
Classification as sensitising by skin contact, R43 (“May cause sensitisation by skin contact”), is based either on animal studies or practical experience or combinations thereof. The animal criterion is based on either an adjuvant or non-adjuvant test.
Different adjuvant tests exist, but the Magnusson-Kligmann’s method (GPMT: Guinea Pig Maximization Test) is preferred. Response in 30% of the animals results in classification. For a non-adjuvant test (for example the Büehler test) 15% responding animals is regarded as positive. The human data can be results from patch testing, case studies or epidemiological studies.
2.14.1 (Q)SAR based evaluation
Two approaches were used to estimate contact sensitisation /68,69/.
The first approach uses two TOPKAT QSTR models. The first model was used to predict “Allergy versus non-allergy”, and, in cases where this was positive, the second model was used to predict “Strong versus weak/moderate allergy”. The models used were primarily related to the GPMT. Only predictions of “Strong allergy” were considered as being likely to fulfill the EU criteria for R43.
In a second approach, predictions were also made using MultiCASE. The data set used to produce the MultiCASE models differed somewhat from the TOPKAT set, in that both data from the GPM tests and human data were represented. Only positive predictions with MultiCASE scores of > 40 (corresponding to “very active”) were selected.
| Model | Technical specifications |
|---|---|
| TOPKAT (v. 5.01 1998) No sensitisation vs Any |
N=389 GPMT Cross validation result (Q²) /68/: Sensitivity 84-94% Specificity 87-96% |
| TOPKAT (v. 5.01 1998) Strong vs Weak/Moderate |
N=266 GPMT Cross validation result (Q²) /68/: Sensitivity 88-96% Specificity 88-98% (Q²) |
| MultiCASE (v. 3.320 1999) Model A33: Allergic contact dermatitis |
N=1034 GPMT or data from human experience Cross validation result (3*10% out) /69/: Sensitivity 69 – 89% Specificity 89– 94% Chi² > 50, p<0.0001 |
Table 8: Technical summary for the models for sensitisation by skin contact
External validation of both TOPKAT and MultiCASE models was also attempted using confidential results from the EU New Chemicals program. Using the two-stage TOPKAT model (n= 64 AOK[4] predictions) 67% of positives were correctly identified, and 77% of negatives. For MultiCASE, (n= 75 AOK predictions) 45% of positives were correctly predicted, and 81% of negatives /70/.
It is difficult to know how representative “New Chemicals” are with regard to the universe of Existing Chemicals (EINECS). Generally “New Chemicals” are more complex structures with higher molecular weights. Perhaps the most surprising aspect of this exercise was to find that for over three thousand chemicals that should have been assessed for this endpoint, such a tiny percentage of useful test data could be found.
Compounds predicted as positive by either TOPKAT or MultiCASE according to the above criteria were selected, provided that they were either AOK in the first, or contained no unknown fragments or equivocal results in the latter.
While it was considered to use “positive” in both models as a criterion, in the end this seemed inefficient, not so much due to lack of concordance between model predictions, but because the acceptance domains (AOK or all fragments known) of the two methods differed considerably.
No attempt was made to further reduce the list by systematically applying expert judgment.
A schematic diagram of the systematic evaluation is given in figure 6.
Figure 6: Schematic diagram illustrating the systematic evaluation applied to assign advisory classifications for sensitisation by skin contact
9.669 chemicals met the above criteria, for which an advisory classification of R43 was assigned. This strike many experts as being a rather large number of chemicals and while these models represent the current “state-of-the-art” it may indicate that they are over-sensitive. However, it was very difficult to obtain any reliable indication of how many Existing Chemicals would cause contact allergy if actually tested in animals or humans. Estimates of percentages of allergens on EINECS ranged from 5-25%, with some preference being expressed for 10%, which is the number of Annex I (now Annex VI of 1272/2008/EU) substances currently classified for this effect. It is not possible, however, to estimate the influence of confounders on the distribution represented in Annex I. Positive bias can have been introduced because chemicals testing positive are over-represented. Negative bias can have been caused by the fact that most of the chemicals have never been tested at all. The question of numbers remains open.
2.15 Skin irritation
Substances which cause significant inflammation of the skin determined on the rabbit according to the cutaneous irritation Annex V test method (persisting for =24h after exposure =4h) should be classified for skin irritation with Xi;R38 (Irritating to skin).
2.15.1 (Q)SAR based evaluation
If test results measured in the rabbit were readily available (had been used to make the model) these took precedence over any predictions.
Positive test data for rabbits were available for 213 of the chemicals processed.
If no test data were available, skin irritation was estimated according to the DK MultiCASE model for severe skin irritation vs. mild skin irritation. The training set for the model includes data from RTECS /71/ on 701 chemicals[5], HSDB /72/ on 31 chemicals[6], EU Annex I classifications for a total of 56 chemicals[7], and expert judgments for certain groups of chemicals for a total of 49 chemicals[8].
As the model training set contains both information on skin irritation and corrosion, positive predictions from the model may in reality be due to either of the effects.
| Model | Technical data |
|---|---|
| Skin irritation in rabbits (in vivo), severe vs mild | MultiCASE version 2009 DK model Training set: n=837 Cross-validation 10*50% gave: Sensitivity: 63.8% Specificity: 81.0% Concordance: 72.7% Domain: 49% |
Table 9: Technical summary for the model for skin irritation
The software used in the current project is unable to predict the properties of ionized compounds (salts) and therefore predictions have not been made for ionized compounds, as skin irritation is a local effect, which can be highly sensitive to pH.
A schematic diagram of the systematic evaluation is given in figure 7.
Figure 7: Schematic diagram illustrating the systematic evaluation used to assign advisory classifications for skin irritation
This resulted in 8,005 substances, which were assigned an advisory classification of Xi;R38. As the model does not discriminate between strong irritants and corrosive chemicals, the advisory classifications based on the predictions from the model should be considered as “minimum classifications”.
2.16 Danger to the aquatic environment
The classification criteria are composed of three main elements: 1) potential for rapid degradation, 2) bioconcentration potential in fish, and 3) short-term toxicity to aquatic organisms (fish, daphnia, and algae). Classifications are assigned according to the following scheme:
| Classification | Classification criteria* |
|---|---|
| N;R50 Dangerous for the environment; very toxic to aquatic organisms |
Acute toxicity = 1.0 mg/L |
| N;R50/53 Dangerous for the environment; very toxic to aquatic organisms; may cause long-term adverse effects in the aquatic environment |
Acute toxicity = 1.0 mg/L and not readily degradable or BCF**= 100 |
| N;R51/53 Dangerous for the environment; toxic to aquatic organisms; may cause long-term adverse effects in the aquatic environment |
Acute toxicity > 1 and = 10 mg/L and not readily degradable or BCF** = 100 |
| R52/53 Harmful to aquatic organisms; may cause long-term adverse effects in the aquatic environment |
Acute toxicity > 10 and = 100 mg/L and not readily degradable |
| R53 Harmful to aquatic organisms |
Solubility in water < 1 mg/L and not readily degradable and BCF** = 100 |
Table 10: EU criteria for classification for danger to the aquatic environment
* The lowest effect concentration, EC50, for fish, daphnia or algae is used
** BCF: Bioconcentration factor
(Q)SAR based evaluation
Advisory classifications were assigned on the basis of combinations of estimates for ready biodegradability, bioconcentration and acute toxicity according to the criteria in Table 5. Classification with risk phrase R53 alone was not done in this exercise, as the strong co-linearity between water solubility and bioconcentration factor made it redundant.
It is noted that compared to the classification criteria according to which abiotic degradation (and assessment of primary degradation products for their environmental hazard classification) can be used, only predictions concerning potential for rapid biodegradation was employed here. Furthermore only predictions for bioconcentration in fish were used even though the classification criteria refers to use of log Kow when reliable measured BCF data in fish are not available.
Biodegradation
Biodegradability was estimated using the Syracuse BIOWIN program /43/. Only the non-linear equation for rapid/non-rapid biodegradation (BPP2) was applied. Previous validation of this parameter compared with 304 MITI “ready/not-ready (45:259) results showed that while a relatively high percentage of “not-ready” chemicals were missed (sensitivity result was 53%), 97% of “not ready” predictions were correct (PPV, Positive Predictive Value) in this “chemical universe” of 85% not-ready chemicals /44/. MITI data was also applied by Tunkel et al /41/ who found a sensitivity of 53%, a specificity of 86% and a PPV of 83% for 884 chemicals (385 ready: 499 not-ready). These findings were largely confirmed in a comparison exercise made by the Danish EPA and based on chemicals assessed at OECD (SIAM 11-18), where 128 chemicals (59 ready:69 not-ready), which were not part of the BPP2 training set indicated a sensitivity of 54%, a specificity of 85% and a positive predictive value of 80% /38/. In other words while this model may fail to identify around half of all “non-ready” substances, the number of false predictions for not-ready biodegradability will be very low.
A total of 11,766 chemicals of the 49,292 chemicals studied were found to be “not-readily degradable” according to this criterion.
Bioconcentration
The classification and labelling guidence prefers measured data for bioconcentration, but as this rarely is available, a Log Kow of greater than three is recommended as an indication that BCF will be 100 or greater, in accordance with the linear equation of Veith /55/. While a good rule-of-thumb, this relation both over- and underestimates BCF for many classes of chemicals, and it is only applicable in the Log Kow interval 2-6.
Bioconcentration was therefore predicted using Syracuse BCFWIN /42/, a method based on a combination of Log Kow relations and structural fragment categories. This method was evaluated by its authors as having a statistical accuracy of R² = 0.74 (n = 694, S.D. 0.65, mean error = 0.47), which is a significant improvement over the standard equation of Veith (log BCF = 0.85 * Log Kow – 0.70) where predictions for the same 694 compounds had a statistical accuracy of R² = 0.32 (S.D. 1.62 and mean error = 1.12).
No attempt was made to further assess bioaccumulation potential.
For chemicals predicted to have aquatic toxicity concentrations below 10 mg/L and to be readily biodegradable, 4,662 chemicals were predicted to have BCF estimates of equal to or greater than 100.
Acute toxicity
For aquatic toxicity classifications, it is recommended to used L(E)C50-values for fish, daphnia and algae. Aquatic toxicity to fish, daphnia and algae were predicted using three models and a theoretical equation.
Fish
For acute aquatic toxicity to fish a DK MultiCASE model using 96h LD50 data on 569 chemicals from the Duluth Fathead minnow database was applied /48/. Cross-validation of this model gave a R² of 0.735. As there was insufficient test data for very hydrophobic substances the MultiCASE model was only applied for chemical substances with Log Kow of 6 or less.
Daphnia
For acute aquatic toxicity to daphnia a DK MultiCASE model using 48h EC50 data on 641 chemicals from various sources was applied /49/. Cross-validation of this model gave a R² of 0.69. As there was insufficient test data for very hydrophobic substances the MultiCASE model was only applied for chemical substances with Log Kow up to 7.
Algae
For acute aquatic toxicity to daphnia a DK MultiCASE model using EC50 data on 531 chemicals (396 tests made at the Technical University of Denmark for the Danish EPA, plus literature data from various sources) /50/ was applied. Cross-validation of this model gave a R² of 0.74.
A regression equation was used on top of MultiCASE predictions to adjust for Log Kow contribution to the toxicity:
Log EC50 (μM) = 0.593*Log EC50 (MultiCASE prediction, μM) – 0.257*Log Kow + 1.076
N = 343, R2 = 0.743, S.E = 0.853
(Log Kow below –1 were set to –1, Log Kow above 7 and less or equal to 8 were set to 5, and Log Kow above 8 were set to 1)
As there was insufficient test data for very hydrophobic substances the MultiCASE model was only applied for chemical substances with Log Kow of up to 8.
Non-polar narcosis predictions for highly hydrophobic substances
Another relationship was used for chemicals with a Log Kow of greater than six. Here, all substances were assumed to act by non-polar narcosis (minimum or baseline toxicity) , and toxicity at dynamic equilibrium (or steady state) was estimated according to a relation to the predicted bioconcentration factor in small fish:
LC50 (equilibrium) = 8.15 mmol /BCF
The choice of 8.15 mmol corresponds to the theoretical level inducing aquatic lethal effects represented by the non-polar narcosis fish (Q)SAR recommended in the REACH-guidance /51/. Non-polar narcosis Lethal Body Burden’s for fish are generally assumed to be within the range of about 2–8 mmol /53/.
While simple Log Kow relationships exist for predicting the non-polar narcotic toxicity for fish, daphnia and algae, these do not distinguish specific toxicity’s unique to any of the three taxa, and were not felt to offer any advantage over using the fish models alone, which also adequately predict non-polar narcosis. For all practical purposes, non-polar narcosis induces effects at the same concentration levels in all three taxa for chemicals with these high Log Kow values.
Aquatic toxicity screening
Using the three Multicase models and the non-polar narcosis equation, 18,809 of the chemicals assessed in the current project had acute aquatic toxicity’s of = 100 mg/L.
| Model | Technical summary |
|---|---|
| Biodegradation, Syracuse BIOWIN2 non-linear model for rapid/non-rapid aerobic biodegradation probability (BPP2) | Syracuse BIOWIN, US EPA /45/ Training set: n=295 External validation (n=304) gave Sensitivity: 53.3% Specificity: 91.1% Concordance: 58.9% PPV: 97.2% |
| Bioconcentration (BCF), Syracuse BCFWIN | Syracuse BCFWIN, US EPA /42,46/ Training set: n=694 Cross-validation gave R² = 0.74 S.D. = 0.65 Mean error = 0.47 |
| Acute toxicity to fish, Fathead minnow LC50 (96h) | MultiCASE, DK model /48/ Training set: n=569 Cross-validation 3*10% gave R² = 0.74 Domain: 52% |
| Acute toxicity to daphnia, Daphnia magna, EC50 (48h) | MultiCASE, DK model /49/ Training set: n=641 Cross-validation 3*10% gave R² = 0.69 Domain: 52% |
| Acute toxicity to algae, Pseudokirchneriella subcapitata, EC50 | MultiCASE, DK model /50/ plus Log Kow equation Training set: n=531 Cross-validation 10*50% for the two-step model gave R² = 0.74 Domain: 58% |
| Non-polar narcosis, LC50 (equilibrium) = 8.15 mmol /BCF | Theoretical equation /51-54/ |
Table 11: Technical summary for the models used for classification of danger to the aquatic environment.
Advisory classifications
A total of 18,809 of the chemicals assessed in the current project were selected according to one of the four classification categories based on the combination of model predictions as indicated in the classification criteria and shown in Figure 8. The classifications for danger to the aquatic environment were assigned to the following number of chemicals:
| N;R50 | 2,381 |
| N; 50/53 | 7,376 |
| N; R51/53 | 6,063 |
| N; R52/53 | 2,989 |
Figure 8: Schematic diagram illustrating the systematic evaluation applied to assign advisory classifications for danger to the aquatic environment.
[4]AOK means within applicability domain as defined in /5/
[5] 291 were positives and 410 were negatives. For the positives, the search criterion in RTECS was the RTECS code “SEV” for severe skin irritation and no requirements on dose or duration of exposure was made. For the negatives, the search criterion in RTECS was the RTECS code “MLD” for mild skin irritation, and moreover a requirement of 500 mg and 24H exposure was set.
[6] The 31 chemicals from HSDB were all positives; highly irritation or corrosive according to HSDB criteria.
[7] The 56 chemicals with EU classifications were either corrosive with R34 (causes burns) or corrosive with R35 (causes severe burns).
[8] Of the expert judgment groups entered, some consisted of presumably not irritating chemicals that the model was otherwise confused by and where experimental data could not be found, together with some well known groups of positives. A QMRF including the full training set with statements of source for both test data and expert judgments will be submitted for inclusion the EU QMRF inventory and is also available on request.
3 Discussion & Conclusions
- 3.1 Chemicals on AL2010 that were not on AL2001
- 3.2 Chemicals on AL2001 that are not on the current list
- 3.3 Conclusion
This consolidated report contains documentation for all of the current advisory classifications on the DK EPA Advisory self-classification List (AL), i.e.:
- Carcinogenicity (update, from 2009)
- Mutagenicity (update, from 2009)
- Reproductive toxicity/harm to the unborn child (new, from 2009)
- Acute oral toxicity (update, from 2010)
- Sensitisation by skin contact (not updated, from 2001)
- Skin irritation (new, from 2010)
- Danger to the aquatic environment (update from 2009)
The 2009 update of the advisory classifications for cancer and mutagenicity was made using entirely new models; i.e. none of the models used to make the advisory classifications for mutagenicity and carcinogenicity on AL2001 were used in the update.
Annex 2 contains examples of how further structural analyses of substances belonging to various chemical classes can be made on top of the predicted properties from this project to visualize and gain further insight into relations between sub-structures and, in this case, the carcinogenicity properties of chemicals.
For the environmental advisory classifications some of the models used for AL2001 were used again for AL2009 (BCFWIN and model for aquatic toxicity to Fathead minnow), and new models were applied for biodegradation and aquatic toxicity to Dahpnia and Algae.
Comparisons between AL2001 and AL2009 are made in the following for the individual advisory classifications represented in both lists.
The following text originates from the AL2009 report /62/ and has only partly been updated to the 2010 update of acute oral toxicity and the addition of skin irritation.
3.1 Chemicals on AL2010 that were not on AL2001
As shown in figure 9, a larger number of chemicals have been assigned advisory classifications for the individual advisory classifications in the current advisory list than in the former. This is due primarily to the application of entirely different models with in many cases larger chemical domains than the models applied for AL2001. Also, a little more substances were included in the start list for AL2009 and AL2010 than for AL2001 (49,292 for AL2009/AL2010 and approximately 47,000 for AL2001)
For the advisory classifications for danger to the aquatic environment the reasons for the differences more specifically relate to the addition of aquatic toxicity models for Daphnia and Algae, plus the use of the non-linear BIOWIN 2 model instead of the linear BIOWIN 1 model, which was used for AL2001. BIOWIN 1 has a lower sensitivity than BIOWIN 2.
For the carcinogenicity and mutagenicity endpoints the increased number of predictions on AL2009 as compared with AL2001 is generally due to the use of new and improved (Q)SAR-models with larger applicability domains.
Figure 9 presents an overview of the number of advisory classifications for individual endpoints on AL2001 and the current consolidated AL2010. Reproduction and skin irritation are included although these endpoints were not addressed in AL2001.
Figure 9: Overview of the number of substances for each advisory classification in the current version compared to the 2001 version of the Advisory self-classification list. (Note: Reproductive toxicity and skin irritation were not included in AL2001. The advisory classifications sensitisation by skin contact, R43, have not been updated, and the number in the current version is therefore the same as in 2001.)
3.2 Chemicals on AL2001 that are not on the current list
There are also substances that were assigned advisory classifications on AL2001 that are not on AL2009/2010. It is for the individual endpoints seen that between 11 and 14% of the advisory classifications from AL2001 are not on AL2009/2010. An exception is acute oral toxicity, where around 45% of the 2001 advisory classifications are not on AL2010, primarily due to different applicability domains for the TOPKAT model applied for AL2001 and the Pharma ToxBoxes model applied for the current update. The differences for the other endpoints are also primarily due to the use of new models for AL2009/2010.
Chemicals on AL2001 may not have been included in updates made for AL2009/2010 for one or more of the following reasons:
- they have entered the List of Dangerous substances in the EU (EU harmonised classifications)
- they were not included on the new starting list for technical reasons (e.g. errors in the structural information or structure information not accepted by the (Q)SAR software)
- they were not within the applicability domain of some or all of the models applied for AL2009/2010
- they do not fulfil the new (Q)SAR model algorithms established for advisory classifications in AL2009/2010
For the mutagenicity endpoint, for example, where five models were used, many of the chemicals that were included on AL 2001 but not on AL 2009 did not have robust predictions (within applicability domain) in two or three models, but often with flags in one or more of these models showing that a possible active fragment was identified. Additionally, many have positive predictions in models for in vitro genotoxicity endpoints (which were not included in the evaluation). In total, the majority of the chemicals that were not identified this time appear to be borderline mutagens.
As there were mixed results (negative / out-of-domain / positive) from the battery of models applied within an endpoint, it is not possible to separate the chemicals strictly into groups of chemicals that were not identified this time because they could not be predicted (i.e. outside domain) or because the models applied in the new selection algorithm for AL2009 predict them to be negative for the effect.
A detailed comparison between numbers of chemicals with advisory classifications for carcinogenicity, mutagenicity and danger to the aquatic environment on AL2001 and AL2009 is given in table 12. VIOS det
| Advisory classifi- cation |
Substances on AL2001 | Substances on AL2009 | ||||
|---|---|---|---|---|---|---|
| Total no. with this advisory classifi- cation |
- also on AL2009 with same advisory classifi- cation |
- also on AL2010 but with different advisory classifi- cations |
- not on AL2009 | Total with this advisory classifi- cation |
- not on AL2001 with this advisory classifi- cation |
|
| Mut3;R68 | 1,678 | 695 | 742, including - 284 with Carc3;R40 - 80 with Rep3;R63 (total 349)* |
241 (14%), including - 7 now on Annex 1 - 3 not on start list |
5,742 | 5,047 |
| Carc3;R40 | 642 | 287 | 287, including - 144 with Mut3;R68 - 45 with Rep3;R63 (total 160)* |
68 (11%), including - 13 now on Annex 1 - 2 not on start list |
3,726 | 3,439 |
| Rep3;R63 | - | - | - | - | 4,036 | - |
| Danger to the aquatic environ-ment | 8,730 | 7,546** | 203 | 981 (11%), including - 22 now on Annex 1 - 3 not on start list |
18,809 | 11,263 |
* Due to overlap; some chemicals have advisory classifications for more than one CMR endpoint
** with one of the classifications for danger to the aquatic environment
Table 12. Overview of the occurrence of substances on AL2001 and AL2009
3.3 Conclusion
Due primarily to the application of combinations of new (Q)SAR models, in many cases with larger applicability domains, the number of substances with advisory classifications has increased considerably for individual classifications as compared to AL2001. Moreover, reproductive toxicity (possible harm to the unborn child), skin irritation, and differentiated advisory classifications for acute toxicity (harmful, toxic and very toxic) were included for the first time.
4 References
- Regulation (EC) No 1907/2006 of the European Parliament and of the Council of 18 December 2006 concerning the Registration, Evaluation, Authorisation and Restriction of Chemicals (REACH), establishing a European Chemicals Agency, amending Directive 1999/45/EC and repealing Council Regulation (EEC) No 793/93 and Commission Regulation (EC) No 1488/94 as well as Council Directive 76/769/EEC and Commission Directives 91/155/EEC, 93/67/EEC, 93/105/EC and 2000/21/EC.
- Council Directive 67/548/EEC on the approximation of the laws, regulations and administrative provisions relating to the classification, packaging and labelling of dangerous substances.
- EINECS (European Inventory of Existing Commercial Chemical Substances). Official Journal of the European Union (1990). 146A, 15.6.1990
- Addendum to EINECS (European Inventory of Existing Commercial Chemical Substances). Official Journal of the European Union (2002). C 54/13 01.03.2002, 2002/C54/08
- The Danish Environmental Protection Agency (2001). Report on the Advisory list for self-classification of dangerous substances. Environmental Project No. 636
- Council Directive 1999/45/EEC concerning the approximation of the laws, regulations and administrative provisions of the Member States relating to the classification, packaging and labelling of dangerous preparations
- Regulation (EC) no 1272/2008 of the European Parliament and of the Council on classification, labelling and packaging of substances and mixtures, amending and repealing Directives 67/548/EEC and 1999/45/EC, and amending Regulation (EC) No 1907/2006
- M-CASE, Users Guide, Version 3.30 (Rev. 1.0), Multicase inc., 25825 Science Drive Park, suite 100, Cleveland, OH, 44122.
- Guidance for the implementation of REACH - Guidance on information requirements and chemical safety assessment Chapter R.6: (Q)SARs and grouping of chemicals. European Chemicals Agency, 2008
- Oxford Molecular, Chem-X version July 1998, SMILES to 3D (three dimensional) conversion module
- J.A. Cooper, R. Saracci and P. Cole, Describing the validity of carcinogen screening tests, British Journal of Cancer, 39 (1979), pp. 87-89.
- Dimitrov, S., Dimitrova, G., Pavlov, T., Dimitrova, N., Patlewicz, G., Niemelâ, J., and Mekenyan, O. A Stepwise Approach for Defining the Applicability Domain of SAR and QSAR Models. J. Chem. Inf. Model., Vol. 45 (4), 839 -849, 2005.
- J.J. Kraker, D.M. Hawkins, S.C. Basak, R. Natarajan, and D. Mills, Quantitative Structure-Activity Relationship ((Q)SAR) modeling of juvenile hormone activity: Comparison of validation procedures, Chemometr. Intell. Lab. Syst. 87 (2007), pp. 33–42.
- A. Golbraikh, and A. Tropsha, Beware of q2!, J. Mol. Graph. Model. 20 (2002), pp.269-276.
- R.Benigni, and C.Bossa, Predictivity of (Q)SAR, J. Chem. Inf. Model. 48 (2008), pp.971-980.
- W.R. Lee, S. Abrahamson, R. Valencia, E.S. von Halle, F.E. Würgler, and S. Zimmering, The sex-linked recessive lethal test for mutagenesis in Drosophila melanogaster. A report of the U.S. Environmental Protection Agency Gene-Tox Program. Mut. Res. 123 (1983), pp.183-279.
- Hayashi et al. Micronuleus tests in mice on 39 food additives and eight miscellanneous chemicals”, Food Chem. Toxicol. 26 (1988) pp 487-500
- Mavournin et al. The in vivo micronucleus assay in mammalian bone marrow and peripheral blood”, Report of the US EPA Gene-Tox Program, Mut. Res. 239 (1990) pp. 29-80.
- Waters et al. The performance of short-term test in identifying potential germ cell mutagens: A quantitative and qualitative analysis”, Mut. Res. 341 (1994) pp. 109-131.
- Morita et al., ”Evaluation of the rodent micronucleus assay in the screening of IARC carcinogens (Groups 1, 2A and 2B)”, The summary report of the 6th collaborative study by CSGMT/JEMS-MMS, Mut. Res. 389 (1997) pp. 3-122.
- Green et al., Current status of bioassays in genetic toxicology--the dominant lethal assay. A report of the U.S. Environmental Protection Agency Gene-Tox Program. Mut. Res. 154, 1 (1985) pp. 49-67. Review.
- J.D. Tucker, A. Auletta, M.C. Cimino, K.L. Dearfield, D. Jacobson-Kram, R.R. Tice, and A.V. Carrano, Sister-chromatid exchange: Second report of the Gene-Tox program. Mut. Res. 297 (1993) pp. 101-180
- Sasaki et al., Crit. Rev. in Toxicol. 30, 6 (2000) pp. 629-799.
- J. Matthews and J.F. Contrera. A new highly specific method for predicting the carcinogenic potential of pharmaceuticals in rodent using enhanced MCASE (Q)SAR-ES software. Reg. Toxicol. and Pharmacol. 28 (1998) pp. 242-264.
- J. Kazius, R. McGuire, and R. Bursi. Derivation and validation of toxicophores for mutagenicity prediction. J. Med. Chem. (2005) 48, pp. 312-320.
- Rosenkranz,H.S.; Ennever,F.K.; Klopman,G. Relationship between carcinogenicity in rodents and the induction of sister chromatid exchanges and chromosomal aberrations in Chinese hamster ovary cells. Mutagenesis (1990) 5, pp. 559-571.
- Evaluation of the Setubal Principles for establishing the status of development and validation of (Q)SARs, OECD, Paris. OECD Environment, Health and Safety Publication. Annex 4 pp. 91-110, J.
- J. Niemela, E. Wedebye (2004), “A ‘global’ Multi-Case model for in vitro chromosomal aberrations in mammalian cells”. OECD Environment Health and Safety Publications, Series on Testing and Assessment, No. 49, OECD, Paris, 113-133in vitro”.
- Motoi Ishidata, Jr., "Data book of Chromosomal Aberration Test In Vitro", Biological Research Centre, National Institute of Hygienic Sciences, Japan, Elsevier Life-Science Information Center, New York 1988
- Ishidata M., Jr. Taken from Sofoni, T. (Ed), "Data Book of Chromosomal Aberration Test In Vitro", LIC. Tokyo, 1998.
- Grant et al., Mut. Res. 465 (2001), pp. 201-229
- Ghanooni, M.; Mattison, D. R.; Zhang, , Y. P.; Macina, O. T.; Rosenkranz, H. S., and Klopman, G. Structural determinants associated with risk of human developmental toxicity. Am.J.Obstet.Gynecol. 176, 4 (1997) pp. 799-805.
- Lee, W.R.; Abrahamson, S.; R. Valencia, E.S. von Halle, F.E. Würgler, and S. Zimmering, The sex-linked recessive lethal test for mutagenesis in Drosophila melanogaster. A report of the U.S. Environmental Protection Agency Gene-Tox Program. Mut. Res. 123 (1983), pp.183-279.
- Green, S.; A. Auletta, J. Fabricant, R. Kapp, M. Manandhar, C-j. Sheu, J. Springer, and B. Whitfield, Current status of bioassays in genetic toxicology – the dominant lethal assay. Part of the U.S. Environmental Protection Agency Gene-Tox Program. Mut. Res. 154 (1985), pp. 49-67.
- G. E. Jensen; J. R. Niemelä; E. B. Wedebye; N. G. Nikolov (2008) QSAR models for reproductive toxicity and endocrine disruption in regulatory use - a preliminary investigation. SAR and QSAR in Environmental Research, 19 (7&8) 631-641.
- (Q)SAR Model Reporting Format Inventory, European Commission, Joint Research Centre (JRC), http://qsardb.jrc.it/qmrf/
- Allanou, R., Hansen, Bjørn G., Bilt, Yvonne van der (1999), “Public availability of Data on EU High Production Volume Chemicals”, European Commission, JRC, EUR 18996 EN.
- OECD (Q)SAR Application Toolbox v. 1.1. OECD Quantitative Structure-Activity Relationships [(Q)SARs] Project, http://www.oecd.org/. Search for OECD (Q)SAR Application Toolbox download.
- OECD document ENV/JM/TG(2004)26/REV1: ”COMPARISON OF SIDS TEST DATA WITH (Q)SAR PREDICTIONS FOR ACUTE AQUATIC TOXICITY, BIODEGRADABILITY AND MUTAGENICITY ON ORGANIC CHEMICALS DISCUSSED AT SIAM 11-18”
- Loonen, H., Lindgren, F, Hansen, B., Karcher, W., Niemelä, J., Hiromatsu, K.\ Takatsuki, M.\ Peijnenburg, W., Rorije, E., and Struijs, J. PREDICTION OF BIODEGRADABILITY FROM CHEMICAL STRUCTURE: MODELING OF READY BIODEGRADATION TEST DATA. Env. Toxicol. Chem., Vol. 18(8), 1763–1768, 1999.
- Klopman, G. Meihua, T. STRUCTURE–BIODEGRADABILITY STUDY AND COMPUTER-AUTOMATED PREDICTION OF AEROBIC BIODEGRADATION OF CHEMICALS. Env. Toxicol. Chem., Vol. 16(9), 1829-1835, 1997.
- Tunkel, J., Howard, P.H., Boethling, R.S., Stiteler, W., Loonen, H. Predicting Ready Biodegradability in the Japanese Ministry of International Trade and Industry Test. Env. Toxicol. Chem. 19(10); 2478-2485, 2000.
- Meylan, W.M., Howard, P.H., Boethling, R.S., Aronson,D., Printup,H., Gouchie, S. Improved method for estimating bioconcentration/
bioaccumulation factor from octanol/water partition coefficient. Environ. Toxicol. Chem, 18(4); 644-672, 1999.
- BIOWIN Biodegradation Probability Program for Microsoft Windows, Syracuse Research Corporation, Syracuse, NY, U.S.A.
- Pedersen, H. Tyle, J.R. Niemelä, B. Guttman, L. Lander, and A. Wedebrand, Environmental Hazard Classification – data collection and interpretation guide for substances to be evaluated for classification as dangerous to the environment. Appendix 9; Validation of the BIODEG Probability Program, TemaNord Report 589, 1995, pp. 153-156.
- Howard, P.H., Boethling, R.S., Stiteler, W.M., Meylan, W.M., Hueber, A.E., Beauman, J.A., Larosche, M.E. Predictive Model for aerobic biodegradability developed from a file of evaluated biodegradation data. Environ. Toxicol. Chem, 11; 593-603, 1992.
- European Commission, Technical Guidance Document in Support of commission directive 93/67EEC on Risk Assessment for New Notified Substances and Commission Regulation (EC) No. 1488/94 on Risk Assessment for Existing Substances, Part III, ISBN 92-827-8013-9, 1996, p. 554.
- Improved Method for Estimating Bioconcentration Factor (BCF) from Octanol-Water Partition Coefficient, SRC TR-97-006 (3rd Update), August 13, 1997; prepared for: Robert S. Boethling, EPA-OPPT, Washington, DC; Contract No. 68-D5-0012; prepared by: W.M. Meylan, P.H. Howard, D. Aronson, H. Printup and S. Gouchie; Syracuse Research Corp., Environmental Science Center, 6225 Running Ridge Road, North Syracuse, NY 13212.
- Data from Brooke, L.T. et al. Acute Toxicities of Organic Chemicals to Fathead Minnows (Pimephales promelas), Center for Lake Superior Environm. Studies, University of Wisconsin, Superior 1988. G. Klopman, R. Saiakov, and S. Rozenkranz, Multiple Computer-Automated Structure Evaluation Study of Aquatic Toxicity II. Fathead minnow, Env. Toxicol. and Chem., Vol. 19, No 2, pp. 441-447 and data from G. Klopman, R. Saiakov, H.S. Rosenkranz, J.L.M. Hermans, Multiple Computer-Automated Structure Evaluation program study of aquatic toxicity 1: Guppy, Env. Toxicol. Chem. 18, 1999, pp. 2497-2505.
- Data from The Aquire Database (US EPA Ecotox Database), and R. Kühn, et. al. Results of the harmful effects of selected water pollutants (anilines, phenols, aliphatic compounds) to Daphnia magna, Water Res. 23; 495-499 (1989), and E. Urrestarazu Ramos, Aquatic Toxicity of Polar Narcotic Pollutants, Thesis - University of Utrecht (1998) ISBN 90-393-1638-4, p. 82-85, and O.C.Hansen, DTI Environment, Quantitative Structure-Activity Relationships ((Q)SAR) and Pesticides, April 1999, and Danish EPA report from VKI (Finn Pedersen) 1998, Immobilization Test of Aniline Compounds with the Crustacean Daphnia magna, and Danish EPA report from VKI (Finn Pedersen) 2002. Immobilization Test of Selected Organic Amines with the Crustacean Daphnia magna, and Danish EPA report from VKI (Finn Pedersen) 2003 Immobilization Test of Three Trialkylamine Compounds with the Crustacean Daphnia magna.
- Included were 396 tests made at the Danish Technical University for the Danish EPA, 85 physiological substances which theoretically are non-toxic to Algae, 17 Aquire tests (US EPA Ecotox Database), 27 tests from C.D.S Tomlin, The Pesticide manual , ISBN 1 901396 11 8, British Crop Protection Council, Surrey UK, 1997. 5 tests from Environmental Project no. 615 2001, Environmental and Health Assessment of Substances in Household Detergents and Cosmetic Detergent Products, Danish EPA. 1 test from D.R. Orvos, D.J. Versteeg, J. Inauen, M. Capdevielle, A. Rothenstein, V. Cunningham, Aquatic Toxicity of Triclosan, Env. Toxicol. and Chem. 21, 7, 2002,
- Guidance for the implementation of REACH - Guidance on information requirements and chemical safety assessment. European Chemicals Agency, 2008
- Hermens, J.L., et. al., Aquatic Toxicity of Polar Narcotic Pollutants, University of Utrecht, Utrecht, Netherlands, 1998.
- ECETOC Technical Report No. 67, The Role of Bioaccumulation in Environmental Risk Assessment: The Aquatic Environment and Related Food Webs, 1995.
- Pedersen, F., Tyle, H., Niemela, J., Guttman, B., Lander, L., and Wedebrand, A., 1995, Environmental Hazard Classification – data collection and interpretation guide for substances to be evaluated for classification as dangerous to the environment. Appendix 9; Validation of the BIODEG Probability Program, TemaNord Report 589, 153-156.
- Veith, G.D., D.L. Defoe and B.V. Bergstedt. 1979. Measuring and estimating the bioconcentration factor of chemicals on fish. J. Fish. Res. Board Can. 36:1040-1048.
- Danish Environmental Protection Agency (2004). List of Undesirable Substances. Environmental Review, 15/2004. ISBN 87-7614-477-1. Danish Environmental Protection Agency.
- Danish Environmental Protection Agency (1996). Criteria for selection of undesirable substances. Environmental Review, 71/1996. Danish Environmental Protection Agency.
- Danish Environmental Protection Agency (2000). List of Effects 2000. Environmental Review, 6/2000. Danish Environmental Protection Agency.
- The European lists of High Production Volume Chemicals (HPVs) and the Low Production Volume Chemicals (LPVCs) are listed in ESIS (European chemical Substances Information System). http://ecb.jrc.ec.europa.eu/esis/
- Globally Harmonized system of Classification and Labelling of Chemicals (GHS). United Nations, New York, Geneva. 2007. http://www.unece.org/trans/danger/publi/ghs/ghs_welcome_e.html
- 61. OECD (2004). OECD Principles for the Validation, for Regulatory Purposes, of (Quantitative) Structure-Activity Relationship Models. http://www.oecd.org/document/23/
0,2340,en_2649_34379_33957015_1_1_1_1,00.html
- The Danish Environmental Protection Agency (2009). The Advisory list for self-classification of dangerous substances. Environmental Project No. 1303.
- Niemela, J., “Non-Structural Activity Coefficients for Acute Oral Toxicity in the Mouse and Rat”, Danish EPA, working document, 1992 (available on request)
- Niemela, J., “Acute Toxicity versus rout of Administration in Mice”, Danish EPA, working document, 1995 (available on request)
- http://pharma-algorithms.com/
- Hunter, W.J., et. al., “Intercomparison Study on the Determination of Single administration Toxicity in Rats,” J. ASSOC. AFF. ANAL. CHEM., Vol. 62, no. 4, 1979.
- Japertas, J., Didziapetris, R., Sazonovas, A, “Acute toxicity (LD50) prediction involving fragmental QSAR model, similarity analysis and reliability of predictions”, Abstracts / Toxicology Letters 172S (2007) S1-S240.
- Health Designs, Inc., “New Skin Sensitization Model,” Computational Toxicology News, no. 21, 1998
- MultiCASE; Model A33 Allergic contact dermatitis, July, 1998
- Niemela, J., “QSAR’s for the Estimation of Sensitization Potential,” Danish EPA, working document, 1999 (available on request).
- RTECS (Registry of Toxic Effects of Chemical Substances), US National Institute for Occupational Safety and Health (NIOSH), version of November 2000 from CHEMBANK.
- HSDB (Hazardous Substances Data Bank), US National Library of Medicine’s (NLM) Toxicology Data Network (TOXNET®), version of November 2000 from CHEMBANK
- Arnot J.A., W.M.Meylan, J. Tunkel, P.H Howard, D. Mackay, M. Bonnell, R.S. Boethling: “A Quantitative Structure-Activity relationship for Predicting Metabolic Biotransformation rates for Organic Chemicals in Fish”, Env. Toxicol. Chem 28 (6), 1168-77
Annex 1. Glossary
| Description | |
|---|---|
| Training set | The collection of experimental data on a range of chemicals that have been used to develop the (Q)SAR-model. |
| Sensitivity | The sensitivity is a measure of how well the model ”catches” the substances with positive effect in relation to the endpoint being modelled. A sensitivity of 80% means that 80% of the ”true positives” in the validation set were correctly predicted as positives (the remaining 20% were falsely predicted as negatives (false negatives)). The sensitivity is not dependent on the prevalence of positives in the “chemical universe”. |
| Specificity | The specificity is a measure of how well the model predicts substances with lack of effects in relation to the endpoint modelled. A specificity of 80% means that 80% of the ”true negatives” in the validation set were correctly predicted as negatives (the remaining 20% of the negatives were falsely predicted as positives (false positives)). The specificity is not dependent on the prevalence of negatives in the “chemical universe”. |
| Concordance | Also referred to as overall accuracy. The concordance is an overall measure of the correctness of the predictions. A concordance of 80% means that 80% of the substances in the validation set were correctly predicted as positives or negatives (the remaining 20% are the false predictions i.e. false negatives and false positives). |
| Predictive values | Positive and negative predictive values, PPV and NPV are measures of how well the model positive or negative predictions, respectively, are correct. A PPV of 80% means that 80% of the positive predictions in the validation set were correct (the remaining 20% were false positives). The predictive values are dependent on the split between positives and negatives in the “chemical universe”. |
| Applicability domain | The Applicability Domain (AD) of a (Q)SAR expresses the limits of the training set of the model for which it can give predictions for new compounds with a reliability as determined in the validation. The limits of the training set are expressed by parameters characterising the physico-chemical, structural or biological space of the model. The development of statistical and mathematical methods for defining applicability domains is an active field of current research /9/. |
| Validation | Validation is a trial of the model performance for a set of substances independent of the training set, but within the domain of the model. The model predictions for these substances are compared with measured endpoints for the substances in order to establish the sensitivity and specificity and overall accuracy of the model. |
Annex 2. Analysis of positive predictions of cancer classification
LeadScope is a predictive data-mining tool for exploring and filtering data sets based on both structural features and associated data[9]. This software contains a predefined library of over 27,000 chemical functional groups (medicinal chemistry building blocks), which can be applied in the analysis of structural similarities within data sets. Structural similarities may lead to logical paths linking chemical structures with a biological endpoint.
In this example, structural similarities associated with (Q)SAR predictions used for the advisory classifications for cancer were analysed based on a large data set to try and gain further insight into the predictions.
A random set of 21,000 chemicals from the full set of around 185,000 chemicals in the DK (Q)SAR prediction database was imported into LeadScope. The size of the set, which was chosen for practical and technical reasons, is judged to be representative of the full database.The cancer predictions made in the four Multicase FDA cancer models[10] for carcinogenicity to male and female Mice and Rats, respectively, were entered as the overall call made by the so-called FDA ICSAS methodology[11]. Also entered were predictions from the Multicase Ames mutagenicity model (described in 3.2.2), and an overall prediction of in vivo genotoxicity[12] based on five Multicase models for in vivo genotoxicity endpoints (Drosophila SLRL, mutations in Mouse micronucleus, dominant lethal mutations in rodents, sister chromatid exchange in mouse bone marrow, and COMET assay in mouse).
The 21,000 chemicals were organized into groups based on structural features according to the LeadScope library of chemical functional groups. This first rough structural grouping in LeadScope is shown in figure 1. The groups are coloured based on the cancer predictions from the FDA cancer models.
Groups with over-representation of positive predictions have red bars, groups with over-representation of equivocal predictions or predictions, which are out of the applicability domain, have grey bars, and groups with over-representation of negative predictions have green bars. Interpretation of colours is indicated in the bottom right corner.
The length of the bars indicates the number of chemicals (plotted on a log scale). For each group there are a number of more narrowly defined sub-groups, named clusters, which may have different distributions of positives, negatives and “out-of-domain” chemicals.
Figure 1. First rough structural grouping in LeadScope of the 21,000 chemicals with FDA ICSAS cancer calls
Out of the 21,000 chemicals, 4,705 chemicals were assigned to the group “reactive groups” by LeadScope. This group is marked with blue in figure 1, and was selected for further analysis in this annex.
Identification of a group of genotoxic carcinogens
Within the “reactive groups” LeadScope made a number of chemical clusters. Figure 2 gives the first part of a list of these clusters, and again clusters with over-representation of positive cancer calls are shown in red. Further down the list are further out-of-domain clusters (grey) and negative clusters (green).
In the leftside of figure 2, the cluster numbered “90” is highlighted in blue. This cluster is in red colour and contains 24 chemicals.
Figure 2. Cluster 90 with positive predictions for cancer
The first 20 chemicals in cluster 90 are given in figure 3. The FDA predictions of cancer are given for each chemical in the upper left corner. FDACALL of “1.0” means positive cancer prediction.
Figure 3. Chemicals in cluster 90
From figure 4 it can be seen that all 24 chemicals in cluster 90 are predicted positive for both cancer (yellow column to the left) and for Ames mutagenicity (yellow column to the right). The chemicals in cluster 90 appear on this basis to be genotoxic carcinogens.
Figure 4. FDA cancer predictions and Ames mutagenicity predictions for chemicals in cluster 90
Identification and mechanistic profile of a group of steroidal carcinogens
If we go back to the clusters within the “reactive groups” and instead of cluster 90, choose cluster 51, we find a very different group of chemicals. In the left side of figure 2, cluster number 51 is highlighted in blue. This cluster contains 156 chemicals, with over-representation of positive cancer predictions as can be seen from the red colour of the bar.
Figure 5. Clusters within the ”Reactive groups” with cluster 51 highlighted (left)
Cluster 51 is composed of steroids that are likely to be promoters of cancer. The first of the 156 chemical structures are given in figure 6.
Figure 6. Chemicals in cluster 51; steroids which are likely to be promoters
In figure 7, the distribution of cluster 51 chemicals with positive and negative cancer predictions, Ames mutagenicity predictions and in vivo mutagenicity predictions is graphed. “0.0” are the negatives and “1.0” are the positives. Approximately half of the chemicals in cluster 51 are predicted positive for carcinogenicity as can be seen from the graph in the upper left part of figure 6. Almost all chemicals are predicted negative in the Ames model (upper right part), and all chemicals are predicted negative for in vivo genotoxicity (lower left part).
I.e. according to the model predictions from models for cancer and genotoxicity, some of the chemicals in this steroid cluster are carcinogens, but probably with a non-genotoxic mechanism. It is well-known that some steroids can cause cancer through a hormonal non-genotoxic mechanism[13].
Figure 7. Distribution of cancer predictions (FDACALL), Ames mutagenicity (AMESCALC) predictions and in vivo mutagenicity (M_1) predictions in cluster 51
The picture of a non-genotoxic mechanism is confirmed in figure 8 and 9, where the chemicals predicted to be negative (figure 8) and positive (figure 9), respectively, for Ames mutagenicity are highlighted in yellow. Both the predicted Ames positive and negative chemicals are evenly distributed between the chemicals predicted positive and negative for cancer, i.e. there’s no significant relation between Ames positive and positive cancer predictions, this confirms that the chemicals in cluster 51 are not likely to be carcinogenic by a genotoxic mechanism.
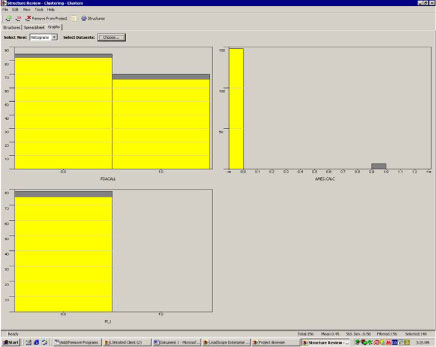
Figure 8. Distribution of Ames negatives among the carcinogenicity and in vivo mutagenicity predictions
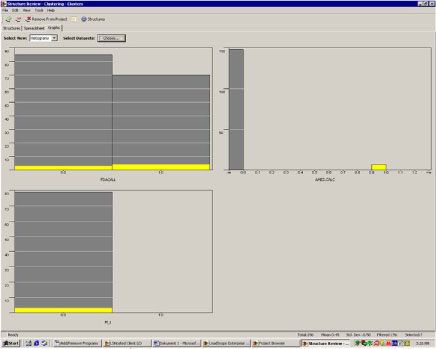
Figure 9. Distribution of Ames positives among the carcinogenicity and in vivo mutagenicity predictions
The seven chemicals predicted to be positive for Ames mutagenicity are shown in figure 10. All of them contain additional reactive fragments such as the diketone, the hydroperoxy group, and the strained 3-member ring (epoxide). By inspection the chemicals look like potential genotoxic compounds by electrophilic mechanisms, not because of the steroid part of the structures but rather because of the additional reactive fragments.
Figure 10. The seven steroid chemicals predicted positive for Ames mutagenicity
Structural identifiers for carcinogenicity of steroids
In the following, LeadScope was asked to find rules about chemical feature combinations that can be used to discriminate between positive and negative cancer predictions within the cluster of 156 steroid chemicals.
Figure 11 shows the generated fragment combination tree. The interpretation of the colours of the boxes is given in the bottom right corner; red box again means over-representation of chemicals with positive cancer predictions, green boxes means over-representation of non-cancer predictions, etc.
Figure 11. A fragment combination tree within the steroids (red means over-representation of positive cancer predictions)
In figure 12, the red box is marked and the rules leading to classification into this box appears in the bottom windows. As it appears, a positive prediction in the steroid cluster is associated with the 17-hydroxy-steroid skeleton (lower left window) and an unsaturated ketone ring (lower right window). There are 18 chemicals in the selected box.
Figure 12. A positive prediction is associated with the 17-hydroxy-steroid skeleton (left) and an unsaturated ketone ring, cyclohexenone, (right)
The 18 chemicals in the red box are given in figure 13. The highlighted part of the structure is the combination of the two structural features; the steroid fragment and the unsaturated ketone ring. The cancer predictions, FDA calls “1.0”, “0.0” or “?”, for cancer are shown in the upper left corner for each chemical. 14 of the 18 chemicals are predicted positive for cancer, 3 are predicted negative and 1 is equivocal/out-of-domain. In other words, this simple rule, i.e. a combination of a 17-hydroxy-steroid skeleton and an unsaturated ketone ring, has a discrimination of 14:3 (not including the out-of-domain prediction) for predicting whether a chemical is predicted to be carcinogenic by the Multicase FDA cancer models. In other words, based on the 17 chemicals with robust cancer predictions, this rule has a Positive Predictive Value (PPV) of 14*100%/17=82%.
Figure 13. Overlay of steroids containing the two structural combinations
Characterizing non-carcinogenic steroids
Of the remaining 138 chemicals in cluster 51, 132 were predicted negative for cancer. Some of these are shown in figure 11. This gives the rule of structure combinations of steroid skeleton plus cyclohexenone a discrimination of 132:6 for predicting whether a chemical is not predicted to be carcinogenic by the Multicase FDA cancer models. In other words, based on the 138 chemicals, this rule has a Negative Predictive Value (NPV) of 132*100%/138=97%.
Figure 14. 132 out of the 138 substances are predicted negative for cancer
LeadScope also identified another rule for discrimination between positive and negative FDA cancer predictions as shown in figure 15 (red box). This rule combines a distance between two hydrogen bond acceptors (HBA) and a cyclohexenone fragment. 6 chemicals had this structure combination, of which 4 were predicted positive for cancer according to the Multicase FDA cancer models. This gives a discrimination for positives of 4:2, or in other words, based on the 6 chemicals, this rule has a Positive Predictive Value (PPV) of 4*100%/6=67%.
Figure 15. Another feature combination (6 structures) within cluster 51
The 6 chemicals are given in figure 16, with the FDA cancer calls in the upper left corner for each chemical.
Figure 16. 4 of the 6 structures are predicted positive for cancer
[9] 1. Roberts G., Myatt G.J., Johnson W.P., Cross K.P., Blower P.E., ”LeadScope: Software for Exploring Large Sets of Screening Data”, J. Chem. Inf. Comput. Sci., 2000, 40 (6), 1302-1314.
[10] J. Matthews and J.F. Contrera. A new highly specific method for predicting the carcinogenic potential of pharmaceuticals in rodent using enhanced MCASE (Q)SAR-ES software. Reg. Toxicol. and Pharmacol. 28 (1998) pp. 242-264.
[11] Positive according to the FDA ICSAS methodology corresponds to two or more positive cancer calls, accepting only predictions for chemicals without significant deactivating fragments. See footnote 2 for reference.
[12] The criteria for the overall call for genotoxicity is the one used for advisory classifications and described in 3.1 Mutagenicity; positive experimental test result in at least one training set or positive predictions in at least two models.
[13] E.g. Lima, B.S., Van der Laan, J.W.; ”Mechanisms of Nongenotoxic Carcinogenesis and Assessment of the Human Hazard”, Reg. Tox. and Pharm. (2000) 32, 135-143.
Version 1.0 March 2010, © Danish Environmental Protection Agency