Life Cycle Assessment of Biogas from Separated slurry
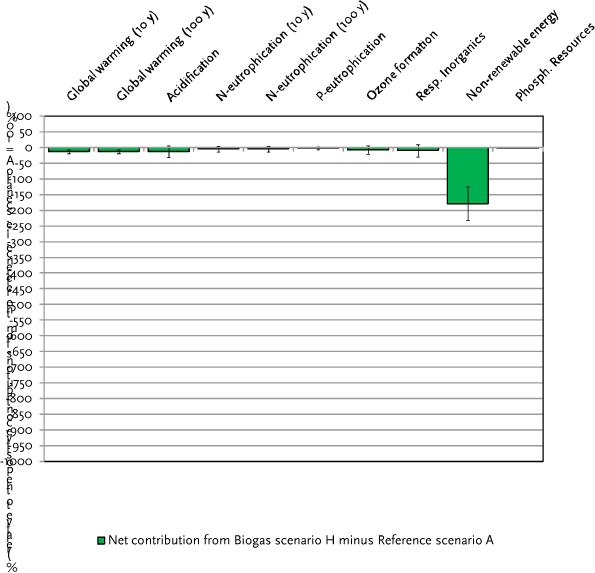
Figure 6.10.B Comparison of the environmental impacts from Scenario A (reference) versus Scenario H (biogas from raw pig slurry + fibre fraction from mechanical separation). Net difference only. Axis ranging from -1000 to 100.

Version 1.0 August 2010, © Danish Environmental Protection Agency