Life Cycle Assessment of Biogas from Separated slurry
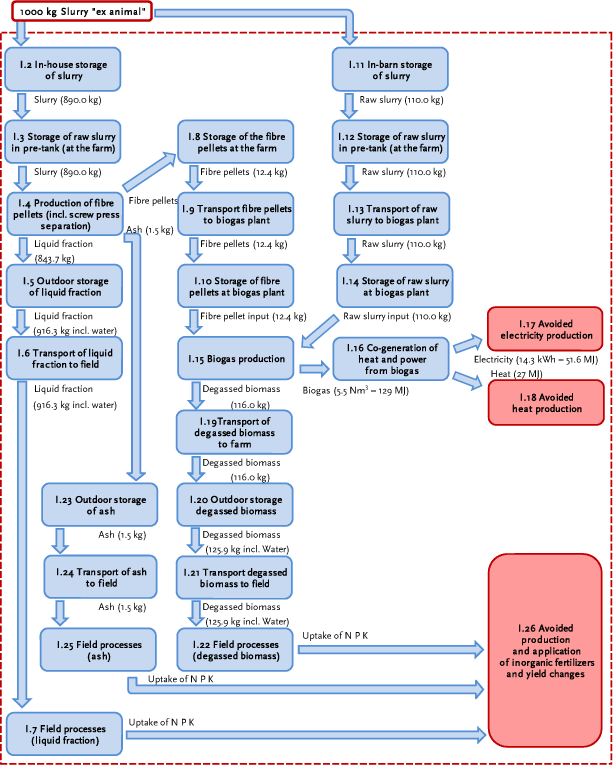
Figure 7.1. Process flow diagram for “scenario I” – biogas production from raw pig slurry and fibre pellets. The process numbers follows the numbers of the sections in annex I.

Version 1.0 August 2010, © Danish Environmental Protection Agency