Stofkoncentrationer i regnbetingede udledninger fra fćllessystemer
2. Procedures for predicting stormwater pollutant loads
2.1 Types of methods
2.2 Definition of the EMC and SMC
2.3 Pollutant concentrations in separated and combined sewer systems
2.4 Simple procedures for estimating pollution runoff
2.5 Discussion
2.1 Types of methods
Three levels of detail
A large variety of methods exist for estimating pollution runoff loads from urban areas. In this review we distinguish between the following three levels of detail
- Area unit pollution loads, i.e. tables stipulating loads of different pollutants in e.g. kg/(ha year).
- Simple procedures that predict pollution loads from knowledge about rainfall, catchment characteristics and average pollutant concentrations.
- Simulation models that describe both rainfall-runoff and pollution transport processes.
This discrimination in three levels is consistent with the three levels of calculation methods proposed by the Danish EPA (Miljřstyrelsen, 1990b).
Level-1: Area unit pollution loads
Many authors stipulate areal unit pollution loads for different pollutants and catchment types, e.g. (Novotny, 1991, 1992). However, such values are calculated based on measured data from local sampling stations and subjective judgments are sometimes applied widely in this process. Direct transfer of unit pollution loads to catchments with other climatic and societal conditions may be questionable and we thus choose not to assess this type on information in the review.
Level-2: Simple procedures
Numerous simple procedures for predicting pollution loads from knowledge about rainfall, catchment characteristics and average pollutant concentrations exist. They are either empirical regression models or equations that in a simplified manner represent the hydrological processes and the average pollutant concentration in the runoff water. The regression models may give valuable information about features governing the variation between storm events and between catchments, and the major part of the review will thus be devoted to such procedures.
Level-3: Simulation models
Regarding simulation models, a large number of different models exist on the international market, involving different levels of complexity in the description of hydrologic and pollution transport processes. Considering the typical lack of pollution measurements in most practical cases, use of such models becomes a controversial subject of debate and this is not the purpose of the review.
The SAMBA model has been used extensively in Denmark over the past decades. It is based on simple mixing of wastewater and stormwater with different average concentrations and facilitates transport and storage, before final discharge into receiving waters via overflow structures or outlets. There is some discussion whether more phenomena could be included in planning-level models like SAMBA and thus, part of the review will also cover the extent to which different transport processes have been documented in international investigations. The purpose would be to identify a few variables that can be used to describe the variation of the pollutant concentrations during and between events.
2.2 Definition of the EMC and SMC
EMC - The event mean concentration
The level-2 and level-3 methods for estimation of urban runoff pollution are typically based on average representative concentrations of pollutants. It is commonly accepted to use event mean concentrations (EMC’s) to characterize urban runoff. An EMC is calculated for an individual storm event as the total mass load of a pollutant parameter divided by the total runoff water volume discharged during the storm. Commonly, a large variation is observed when calculating EMC’s for several events from the same site.
SMC - The site mean concentration
When estimating annual pollution loads it is of primary importance to know the average level of EMC’s. A site mean concentration (SMC) is the arithmetic mean value of the EMC’s measured at one site. Commonly, a large variation is observed when comparing SMC’s from different sites.
2.3 Pollutant concentrations in separated and combined sewer systems
The Danish level-2 procedure
The Danish level-2 calculation method (Miljřstyrelsen, 1990; SVK, 1984) facilitates estimation of runoff pollution from combined sewer systems by calculating the water volumes discharged via an overflow structure and working with mixtures of two types of water, (1) Wastewater from household and industrial sources and (2) stormwater runoff. It is emphasized that for combined sewer systems the pollutant concentrations in "stormwater" (EMC) is significantly higher than for separate sewer systems due to erosion of sediments deposited during dry weather periods. A "stormwater" event mean concentration can be calculated as
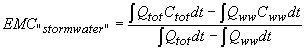 |
(2.1) |
where the subscripts ww and tot denote the wastewater and the total (wastewater and stormwater) flows (Q) and concentrations (C), and the integral signs illustrate that the EMC is evaluated as an average for the whole event duration. The wastewater flow and concentration is measured during dry weather assuming only minor variations whereas the total flow and concentration is measured during runoff.
Total and "stormwater" concentrations
It is common in the Scandinavian countries to distinguish between stormwater in separated systems and the "stormwater" fraction in combined sewer systems, both in calculation procedures and in reported EMC’s and SMC’s. However, it is more common internationally to work with total concentrations only. These will, ideally, be higher in combined sewer systems due to the mixing with wastewater and re-suspension of sediments during rain. There are, however, indications that the differences are not as large as expected.
Fault connections
Canadian studies have shown between 5 and 13% of illicit sanitary connections to storm sewers (Field, 1984). A possible indication on how severely fault connections may influence storm sewers can be seen in Table 2.1 which compares expected concentration levels of TSS, COD and BOD in storm sewers, polluted storm sewers and combined sewers. The data originates from the French database Qastor (Saget and Chebbo, 1996) and it is important to stress that site variations are large, even larger than indicated in the table. This indicates that it may be hard to conclude which type of sewer system has the most polluted runoff water during wet weather.
Table 2.1
Comparison between expected concentration levels in storm sewers and combined sewers
during wet weather (Saget et al, 1998).
| Pollutant | Storm sewer |
Polluted storm sewer |
Combined sewer |
Concentration [mg/l] |
|||
| TSS | 160 – 460 |
240 – 400 |
240 – 670 |
| COD | 80 - 320 |
180 - 470 |
350 – 570 |
| BOD | 13 -130 |
35 -120 |
90 – 270 |
2.4 Simple procedures for estimating pollution runoff
Several authors describe or review methodologies for estimating annual pollutant loads (AL) under wet-weather conditions from separate storm sewers, and we found no similar references dealing with combined systems. Despite this fact some of the procedures for separate systems will be briefly reviewed, because of the systematic approaches taken. Part of the review is based on (Pandit and Gopalakrishnan, 1997).
2.4.1 Regression equations
SWMM Level 1
The Storm Water Management Model (SWMM) Level-1 is a preliminary screening procedure developed with the support of the US EPA by reviewing and using non point source pollution data (Heaney et al, 1976). The model provides estimates of annual loads of five pollutants (BOD, TSS, VSS, TP and TN) as a function of land use, type of sewer system, precipitation, population density and street-sweeping density. The basic equation is
(2.2) |
| where | ai,j is a load factor that varies with pollutant type and land use |
| P is the annual rainfall depth | |
| PDd is the population density under developed conditions (depends to some extent on the percent imperviousness, I) |
|
| f(PDd) is a population density function (depends on the land-use) | |
| SWF is factor accounting for the effect of frequent street-sweeping | |
| A is the catchment area. |
USGS regression model
The United States Geological Survey (USGS) developed regression models from data in two large national databases of urban runoff quality (see section 4.7) for predicting ten pollutants at ungauged locations (Tasker and Driver, 1988; Driver and Tasker, 1990). The final regression relationship yields
(2.3) |
| where | BCF is a bias correction factor |
| N is the number of storms per year | |
| b1-b5 are regression coefficients | |
| MAR is the mean annual rainfall | |
| MJT is the mean minimum January temperature | |
| X2 is a discrete parameter that depends on the type of land-use. |
The annual pollutant load is not directly proportional to the catchment area, and the regression model thus produces estimates notably different from other methods. Typically, much higher loads are predicted for relatively small-size catchments (below app. 10 ha) and they get relatively smaller as the catchments get larger (Pandit and Gopalakrishnan, 1997).
2.4.2 Methods based on the EMC/SMC concept
The simple method
As indicated by its title, this is a simple method in its formulation (Schueler, 1987). The annual load is estimated as
(2.4) |
| where | EMC is an event mean concentration |
| SRC is a storm runoff coefficient (ratio of event runoff and event rainfall depths) | |
| Pj is a correction factor that accounts for storms that produce no runoff or fraction of annual rainfall that does not produce any measurable runoff |
Continuous simulation method
Estimation of Pj may give some difficulties and Pandit and Gopalakrishnan (1996) thus proposed the following method
(2.5) |
where ASRC is an annual storm runoff coefficient, which is determined by simulating annual runoff volumes based on historical rainfall series with the SCS (soil conservation services) method and calculating ASRC=Ra/P where Ra is the annual storm runoff depth.
Runoff model
The last reviewed method based on the EMC/SMC concept yields
(2.6) |
where Ai and Ap are the effective impervious and pervious areas and ri and rp are runoff coefficients of these areas, respectively (Chiew and McMahon, 1999).
2.5 Discussion
Disadvantage of regression models
The disadvantage of the two regression methods is that the parameters and relations are difficult to generalize and transfer to conditions outside the United States. Systematic differences between pollutant loads from different catchments are "hidden" in several variables making it difficult to distinguish between different effects.
Advantage of EMC/SMC based models
The advantage of the three methods listed in Eqs. (2.4-6) is that they distinguish between runoff volumes and concentrations of pollutants in the runoff water (EMC/SMC’s). The difference between the methods is only the way the annual runoff is estimated.
In the two first methods the average EMC (or SMC) of a site is determined by finding the mean EMC of three or more "representative" storm events. These storms are selected based on their magnitude, their antecedent dry weather periods and the deviation of their depth and duration from those of the average storm in the area. However, in lack of measurements the three methods may be used with regional EMC/SMC-values taken from the literature, in which case the models can only give a guide to the probable range of pollution loads.
Adjusting EMC’s with local data
Villadsen (1998) estimated using first order analysis of Eq. (2.5) for a given Danish example an annual total Nitrogen load of 550 kg/year with a standard deviation of 250 kg/year. This highlights the need for adjusting regional EMC/SMC values with local data. Hoos (1996) mention four different methods, but this aspect will not be explored in more detail.
Good EMC/SMC data are required
It is clear from above that good estimates of EMC’s and/or SMC’s is crucial to the accuracy of calculating annual pollution discharges during wet-weather.
|
|