|
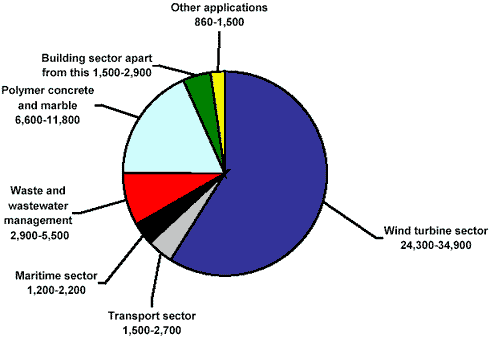
Armeret epoxy- og polyesterplast - forbrug og affaldsmængder Summary and ConclusionsThe aim of this project is to establish an overview over the consumption and the composition of reinforced epoxy and polyester plastics (composites) in Denmark and on this basis projected the volumes of composite waste to be generated within the period of 2000 to 2020. The composites consist of a reinforcement of fibres or stones embedded in a matrix of polyester, epoxy or phenol resin. The fibres are most often made of glass, but fibres of other materials like carbon and plastic are used as well. For many of the main application areas - among others wind turbine arms, boats and refrigerated trailers - the materials consist of a sandwich construction. In the sandwich construction two layers of fibre reinforced epoxy or polyester plastics are separated by a layer of a lighter core material, which can be expanded PVC, balsa wood or expanded polyurethane. The core materials only account for up to a few percentages of the weight of the total construction. Current consumption The consumption of reinforced epoxy and polyester plastic for production of products in Denmark in 2000 is shown in Figure 1. In total, 39,000-62,000 tonnes composites are used for production in Denmark. Composites are used in a considerable number of products, but the following application areas account for the chief part of the consumption for production in Denmark:
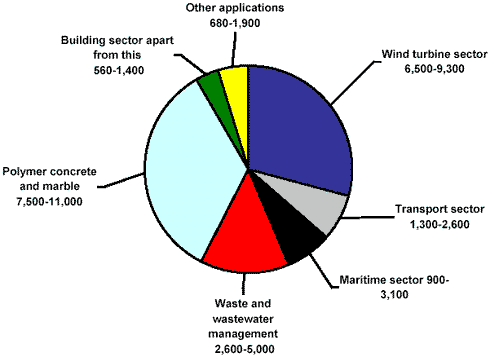
Figure 1 Due to a large net export of especially wind turbines, the pattern is somewhat different when the total amount of composites in products sold in Denmark is regarded (see figure 2). The main application areas are however the same, but the wind turbine sector is less dominant. The total volume in finished products sold in Denmark is estimated at 20,000-34,000 tonnes.
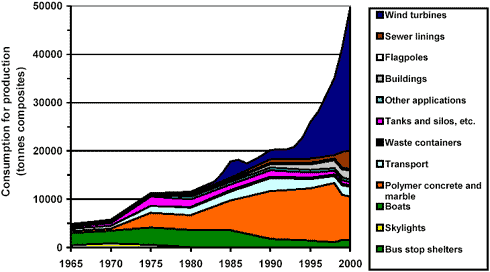
Figure 2 Consumption trend 1965 - 2000 Composites have very long service lives; and to make projections of the volumes of composite waste to be generated in the coming years, it has been necessary to assess the consumption of products containing composites during the period of 1965 to 2000. For all application areas - except wind turbines - no satisfactory statistical information of consumption is available. Consequently the main entrance for the estimation of the historical consumption is information on the consumption of resins for production of composites in Denmark obtained from leading suppliers of resins. The conversion from consumption of resin to the consumption of composites with finished products appears in detail from the report.
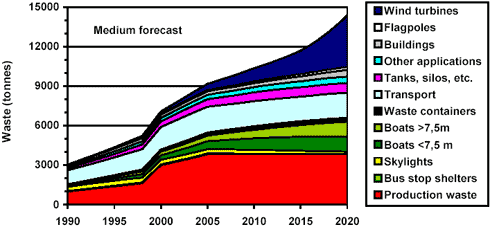
Figure 3 Projections Based on information on the historical consumption and the estimated lives of the products, projections of the expected volumes of composite waste from discarded products within the coming 20 years have been made. The projected volumes are compared to the volumes of composite waste from the production of products in Denmark. The medium projection of discarded products in combination with the production waste is shown in Figure 4. Waste of polymer concrete and synthetic marble is not included, as these materials are substantially different from the other composites. It should be noted that the projections are encumbered with a very high uncertainty, and the projections are in the report represented by minimum and maximum projections for each application area. The total volumes of composite waste from discarded products are estimated at 1,700-6,400 tonnes in 2000, 2,900-10,100 tonnes in 2010 and 5,700-15,300 tonnes in 2020. Included in these volumes are products that are disposed of extra the waste management system, e.g. heating oil tanks left in the ground and refrigerated trailers that are exported and disposed of abroad. For comparison, the production of composite products in 2000 generated about 2,400 tonnes cured composite waste (exclusive of epoxy prepreg and polymer concrete and synthetic marble) and 610 tonnes epoxy prepreg (partly cured).
Figure 4 Alternative disposal Both production waste and composite waste of discarded products have traditionally been disposed of to solid-waste incinerators or refuse dumps. In recent years, a number of experiments with alternative waste treatment have been initiated. These experiments are briefly described in the report. The experiments concern partly different sorts of thermal treatment, where the fibre part of the composites is recycled or down-cycled in new products, partly experiments where all the composites are crushed and recycled in new composites.
|


