|
Undersøgelse af bakterieantal og eftervækstpotentiale i vandværksvand Bilag C
|
|||||||||||||||||||||||||||||||||||||||||||||||||||||||||||||||||||||||||||||||||||||||||||||||||||||||||||||||||||||||||||||||||||||||||||||||||||||||||||||||||||||||||||||||||||||||||||||||||||||||||||||||||||||||||||||||||||||||||||||||||||||||||||||||||||||||||||||||||||||||||||||||||||
Nox |
AOC |
µg/l |
||||
Lab |
1 |
4 |
2 |
3 |
5 |
6 |
Kiwa (1) |
9,56 |
8,78 |
8 |
7,44 |
3,69 |
3,31 |
2 |
13,73 |
13,9 |
11,97 |
13,5 |
10,49 |
8,26 |
VKI (3) |
7,3 |
8,4 |
4,3 |
4,2 |
2,5 |
2,9 |
IMT (4) |
7,8 |
7,1 |
5 |
6,1 |
2,8 |
2,2 |
5 |
8 |
9 |
11 |
9 |
3 |
2 |
P17 |
AOC |
µg/l |
||||
Lab |
1 |
4 |
2 |
3 |
5 |
6 |
Kiwa (1) |
48,46 |
44,88 |
86,16 |
75,2 |
101,46 |
108,05 |
2 |
43,02 |
36,14 |
83,48 |
77,27 |
100,78 |
106,54 |
VKI (3) |
55 |
49 |
113 |
101 |
143 |
144 |
IMT (4) |
44,3 |
49,2 |
84,4 |
85,3 |
140,1 |
167,5 |
5 |
123 |
86 |
183 |
155 |
190 |
198 |
Sum |
AOC |
µg/l |
||||
Lab |
1 |
4 |
2 |
3 |
5 |
6 |
Kiwa (1) |
58 |
54 |
94 |
83 |
105 |
111 |
2 |
56,75 |
50,04 |
95,45 |
90,77 |
111,27 |
114,8 |
VKI (3) |
62 |
57 |
117 |
105 |
146 |
147 |
IMT (4) |
52,2 |
56,3 |
89,4 |
91,4 |
142,9 |
169,7 |
5 |
131 |
95 |
194 |
164 |
193 |
200 |
Homogeneity
The aim of comparison of the samples at VKI was to insure that the samples distributed to other laboratories were homogenous. The samples for this analysis were sampled from the batch supposed to contain 50 µg C l-1. Conventionally a test for homogeneity is conducted as a nested analysis of variance testing the variance between the samples over the variance between within the samples. For chemical analysis the estimation of within sample variance is typically estimated on the basis of a doublet analysis within each sample. However, for the AOC analysis conducted in the present project it was not possible to conduct a double estimation and a chemical analysis based on a nested variance analysis could therefore not be carried out. As an alternative to the conventional homogeneity test the correlation between the sample time and the concentration were therefore carried out, with the aid of a nonparametric Kendal correlation analysis. For none of the AOC determinations a significant correlation was found, since the p values were 0.78 or even bigger in every case. Thus it is concluded that the samples are homogeneous.
Comparison between laboratories and AOC concentration levels
Statistical models
The aim of the analysis was to determine significant differences between the laboratories estimations of AOC and whether possible differences were dependent on the concentration level. To analysis this problem the following statistical model 1 was formulated:
Yijl = µ + Labi + Concj + Lab*Concij + el(ij), where
| Yijl: | Denotes the concentration of AOC at the i’th laboratory at the j’th concentration level in the l’th sample |
| µ: | Denotes the overall average level of AOC |
| Labi: | Denotes the contribution from the i’th laboratory |
| Concj: | Denotes the contribution from the j’th concentration level. |
| Lab*Concij: | Denotes the contribution from the interaction between laboratorium and concentration level |
| el(ij): | Denotes the contribution from residual variation at the l’th sample in the i’th laboratorium at the j’th concentration level. |
The model was analysed as a analysis of variance using the proc glm procdure implemented in the SAS version 6.12 software package. If the interaction between laboratory and concentration level (Lab*Concij) was significant the following statistical model 2 was applied at each concentration level:
Yij = µ + Labi + ej(i), where
| Yij: | Denotes the concentration of AOC at the i’th laboratory |
| µ: | Denotes the overall average level of AOC |
| Labi: | Denotes the contribution from the i’th laboratory |
| ej(j): | Denotes the contribution from residual variation in the i’th laboratorium in the j’th sample. |
If the contribution from laboratory was significant in model 2 Tukey test was conducted to investigate the differences between the laboratories. All statistical analysis were conducted on log transformed data, since this transformation usually full fill the assumption of normal distributed residuals and variance homogenity.
Another aim of the analysis was to investigate whether an estimate of P17 could be used instead of an estimate of NOX + P17. This hypohesis was tested with the aid of model 2 and a contrast statement in case of a significant contribution from laboratory in model 2. A contrast statement compares the average level of the NOX + P17 determinations with the level of the determination using P!7 only.
Results
For all measurements of AOC all terms in model 1 was significant (p<0.05) and detailed analysis with the aid of model 2 was therefore conducted. At all concentration levels significant differences between the laboratories were found for all strains. Thus analysis with the aid of a Tukey test was conducted. The results of the Tukey tests appear from table 1.
Table 1.
Results of the Tukey test conducted for model 2. Laboratories belonging to the
same Tukey group were not significant different. The highest AOC concentrations were
obtained at the laboratories belonging to Tukey group A, the second highest in Tukey group
B and so on. Within each Tukey group the laboratories are written in descending order.
Strain |
Acetate conc. |
Tukey group |
Laboratory |
NOX |
0 |
A |
2 |
NOX |
0 |
B |
1, 5, 3, 4 |
|
|||
NOX |
10 |
A |
2, 5 |
NOX |
10 |
B |
5, 1 |
NOX |
10 |
C |
1, 4 |
NOX |
10 |
D |
4, 3 |
|
|||
NOX |
50 |
A |
2 |
NOX |
50 |
B |
1, 3, 4, 5 |
|
|||
P17 |
0 |
A |
5 |
P17 |
0 |
B |
3, 4, 1, 2 |
|
|||
P17 |
10 |
A |
5 |
P17 |
10 |
B |
3, 4, 1, 2 |
|
|||
P17 |
50 |
A |
5, 4 |
P17 |
50 |
B |
4, 3 |
P17 |
50 |
C |
1,2 |
|
|||
P17+NOX |
0 |
A |
5 |
P17+NOX |
0 |
B |
3, 1, 4, 2 |
|
|||
P17+NOX |
10 |
A |
5 |
P17+NOX |
10 |
B |
3, 2, 4, 1 |
|
|||
P17+NOX |
50 |
A |
5, 4 |
P17+NOX |
50 |
B |
4, 3 |
P17+NOX |
50 |
C |
2, 1 |
Apparently laboratory 5 was the most deviating laboratory in the above analysis. Thus it
was decided to conduct an analysis omitting this laboratory. To provide a visual
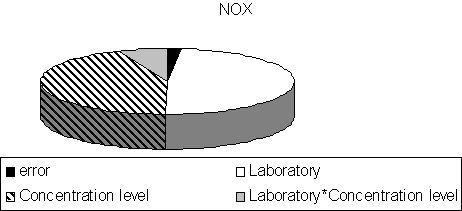
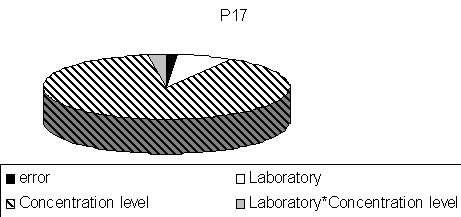
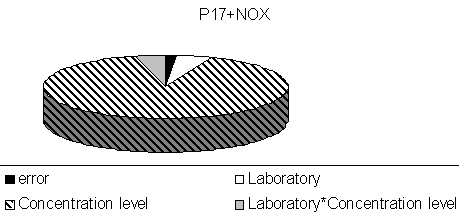
impression of this analysis pie diagrams showing the variance attributable to error or
background variance and the variance attributable to different sources of variation were
made. The pie diagrams shows the sum of squares for the contribution form error,
laboratories, concentration levels and the interaction between laboratory and
concentration for each strain (figure 1 to 3). For the P17 and the NOX + P17 strain
variance was mainly attributable to variation between the concentration levels. For the
NOX strain the variance was mainly attributable to differences between the concentration
levels and the laboratories.

Figure 1.
Pie diagram of the sum of squares obtained for the strain NOX using model 1.

Figure 2.
Pie diagram of the sum of squares obtained for the strain P17 using model 1.

Figure 3.
Pie diagram of the sum of squares obtained for the strain P17 + NOX using
model 1.
Besides the above analysis the AOC determinations using P17 were compared with the AOC determinations using both NOX and P17. The analysis revealed that significant higher concentrations was obtained with the aid of NOX and P17 (<0.0001).