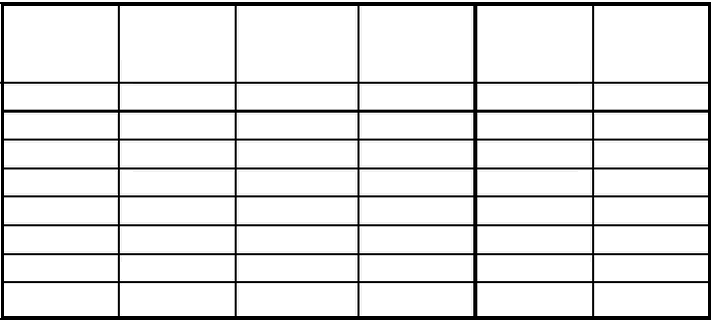
Table 0.1.
Plastic packaging collection in Denmark 1999, 2000 and 2001. Tons
Material
1999
2000
2001
Potential
2001
Percentage of
potential
2001 (%)
LDPE
9.381
10.784
11.750
89.577
13,1
HDPE
4.772
4.526
4.841
23.298
20,8
EPS
60
116
572
3.354
17,1
PP
2.116
2.284
1.645
18.827
8,7
PET
1.405
1.161
1.088
6.032
18,0
PS
189
517
502
3.929
12,8
Other plastic
570
243
423
5.155
8,2
Total
18.493
19.631
20.821
150.172
13,9
Source: Statistics for Packaging Supply Amount in Denmark 1999, 2000 and 2001 as well as Reports to the
Statistics concerning plastic packaging for 2001.
|