[Front page] [Contents] [Previous] [Next] |
Impact of Regulations of Traffic Emissions on PAH Level in the Air
3 Results and discussions
3.1 The general air pollution situation
3.2 Air pollution of PAH and other mutagenic PAC
3.3 Comparison of N-PAC and PAH
3.4 Correlations with other parameters
3.5 Trend analysis
3.6 The influence of ambient temperature and global radiation
3.1 The general air pollution situation
Inorganic components
Table 3.1.1 shows the 24-h levels of airborne inorganic components in the street in the 1996 samples and the 1992 - 1993 samples. The levels appeared to be typical for street stations in Copenhagen (Jensen et al., 1993).
1996 to 1992-93 ratios
The major change from 1992-1993 to 1996 is the one order of magnitude decrease of in
particulate lead and bromine. Pb and Br are formed by the thermal decomposition of
tetraalkyl lead compounds and the lead scavenger, ethylene dibromide, and therefore
emitted from vehicles using leaded petrol (Nielsen, 1984a). The phase-out of leaded petrol
and consequently also the lead scavengers, is the background for the strong decrease in
lead and bromine. Sulphur dioxide has decreased by almost a factor of three as a result of
limiting the content of sulphur in oil and diesel fuels and a decrease in the application
of oil burners for local house heating. Also the annual average of
Manganese
The strong increase in particulate manganese from 1992-1993 to 1996 is unique for the measuring station at H. C. Andersens Boulevard and does not appear to have any relation to the traffic. The source for manganese appears to be soil dust, but if the soil dust in the area is enriched with manganese, the reason for this is unknown (Kaare Kemp, private communication, 1998).
Resuspension
When the 1996 and 1992 mean concentrations (Table 3.1.1) of the particulate inorganic elements were compared, the variation of in the levels of the other elements, including particulate matter, were less than that of lead, bromide and manganese. However the contributions of soil dust elements (aluminium, calcium, silicon and titanium) and particulate matter were higher in the 1996 samples by a factor of 1.3-2.3. Also, other particulate inorganic elements had increased 1996 to 1992 ratios, e.g. sulphate (1.09), potassium (1.4), vanadium (1.04), nickel (1.03), copper (1.4) and zinc (1.4). A possible explanation is a higher impact of resuspension processes in the 1996 than 1992 samples. This explanation is supported by the increased soil dust contribution in the 1996 samples.
Table 3.1.1. Particulate polycyclic aromatic compounds (PAC)
3.2 Air pollution with PAH and other mutagenic PAC
1996 and 1992-93
The 1996 mean levels of some of the major PAC are shown in Fig. 3.2.1. Table 3.1.1
compares the levels of particle associated PAH and other mutagenic PAC in 1996 with those
in 1992-1993. Both for the PAH and the mutagenicity the 1996 levels were about 40-50%
lower than the 1992-93 levels. Thus the average of the 1996 to 1992-93 ratios for the
different PAH was 0.61 ± 0.09 and that for the different mutagenicity tests was 0.50 ±
0.22 (see also Fig. 3.2.2). The difference between the PAH ratios and the mutagenicity
ratios was not significant (p = 0.22). The 1996 measurements include two oxygenated PAH,
anthraquinone
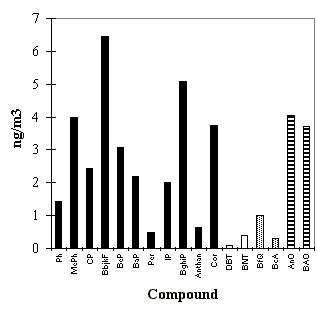
Fig. 3.2.1: The mean levels of some PAH, S-PAC, N-PAC and oxy-PAH. Legends for the four groups: PAH: Ph: phenanthrene, MePh: methylphenanthrenes, CP: cyclopenteno(cd)pyrene, BbjkF: benzo(b)- + benzo(j)- + benzo(k)fluoranthene, BeP: benzo(e)pyrene, BaP: benzo(a)pyrene, Per: perylene, IP: indeno(1,2,3-cd)pyrene, BghiP: benzo(ghi)perylene, Anthan: anthanthrene, Cor: coronene. S-PAC: DBT: dibenzothiophene, BNT: benzo(b)naptho(2,1-d)thiophene. N-PAC: BfQ: benzo(f)quinoline, BcA: benz(c)acridine. Oxy-PAH: AnO: anthraquinone, BAO: benzanthrone.
Benzo(a)pyrene
The mean value of BaP was 2.2±0.6 in 1996 compared to 4.4±1.2 ng
Mutagenicity
The mean mutagenic activity seen in TA98+S9 was 48±41 in 1996 and 59±29 revertants
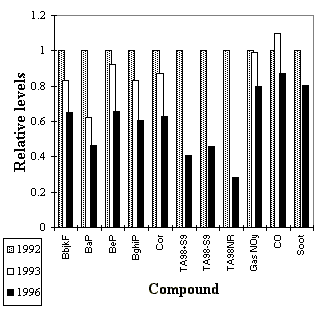
Fig. 3.2.2: Variation in the concentrations of different air pollution components
in 1992, 1993 and 1996 normalised to 1992 levels. Abbreviations: see the legend to Fig.
3.1.1. TA98+S9: Indirect mutagenicity, TA98-S9: Direct mutagenicity, TA98NR: Mutagenic
activity of direct acting non-nitro PAC, gas
PAH composition changes gas particle ratio
Some of the differences in the 1996 PAH composition compared to the 1992-93 composition can be related to the physical and chemical processes in the atmosphere, even though the PAH composition in the two sets of samples is very close to each other. The larger PAH (Mw > 250) as mentioned in Section 1.1 is almost exclusively associated with particles (Nielsen and Pilegaard, 1990, Yamasaki et al., 1982)). The particle associated proportion is 70-95% for cyclopenteno(cd)pyrene, benz(a)anthracene, chrysene and triphenylene (Mw 226-228), 50-60% for benzo(b)naptho(2,1-d)thiophene, benzo(ghi)fluoranthene and benzo(c)phenanthrene (Mw = 226-234), 30-40% for pyrene and fluoranthene (Mw = 202) and 3-15% for phenanthrene, anthracene and methylphenanthrenes (Mw = 178-192). The gas phase proportion decreases with decreasing ambient temperature but also with increasing amounts of airborne particulate matter. The higher atmospheric particle concentrations in the 1996 samples ( see Section 3.1) are probably the reason for the significantly (p< 0.05) lower decrease of the lighter PAH (1996 to 1992-93 ratio: 0.73 ± 0.21) in the 1996 samples compared to the heavier PAH (0.54 ± 0.04). This is considered due to the effects of the ambient temperature had not been considered to be the reason, as the average value was almost the same in the two data sets (see Section 2.1).
Atmospheric chemistry
Atmospheric decomposition of the reactive PAH (Nielsen, 1984b and 1988) (cyclopenteno(cd)pyrene, benzo(a)pyrene, perylene and anthanthrene) was significant in the 1996 samples. Thus, the 1996 to 1992-93 ratio of the four PAH (0.42±0.05) was significantly lower than the ratio for the stable PAH, benz(a)anthracene, triphenylene, chrysene, benzo(a)-, benzo(b)-, benzo(j)- and benzo(k)fluoranthene, benzo(e)pyrene, indeno(1,2,3-cd)pyrene, benzo(ghi)perylene and coronene, (0.60±0.08) (t-test, p<0.01). Fig. 3.2.3 shows the 1996 to 1992 ratio for some of the major PAH.
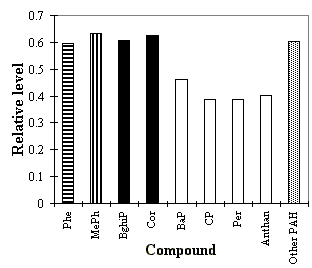
Fig. 3.2.3: PAH composition in 1996 normalised to 1992. Abbreviations: See the legend to Fig. 3.2.1. Phe: phenanthrene (reference component for MePh), MePh (indicator for diesel exhaust), BghiP and Cor (both indicator for traffic emissions, BaP, CP, Per and Anthan (all four reactive PAH) and Other PAH: benzo(b)- + benzo(j)- + benzo(k)fluoranthene + benzo(e)pyrene + indeno(1,2,3-cd)pyrene (reference components).
Emission sources
The changes in the emission sources did not appear to cause any major changes in the atmospheric PAH composition. The reason for this may be that both the emissions from diesel cars as well as the emissions from petrol driven passenger cars are reduced. The ratio between methyl-phenanthrenes and phenanthrene and the presence of benzo(ghi)perylene and coronene were previously applied to estimate the contributions from diesel and petrol engines (Nielsen 1996, Nielsen et al. 1995b and c and 1996). For the 1992-93 results it was estimated that 80% of the PAH originates from traffic sources with the following weekdays distribution: Working days 90% and weekends 40%. Approx. 2/3 of the total traffic contribution originated from the diesel traffic applying benzo(e)pyrene as indicator for PAH (Nielsen, 1996). For 1996 the total traffic contribution appears to be in the magnitude of 80-90% on working days and the ratio between diesel and petrol emissions appears still to be about 2 to 1. The 1996 to 1992 ratios of phenanthrene (0.61) and methylphenanthrenes (0.63) were very close to each other and the 1996 to 1992-93 ratios of benzo(ghi)perylene (0.64) and coronene (0.64) were not significantly different from the ratio of the stable PAH (0.60±0.08). Our estimate of the ratio of emissions from either diesel vehicles or cars running on petrol is based on the ratio of methylphenanthrenes and phenanthrene as the alkylated PAH in our view are the only PAH which can be applied to distinguish between these types of sources. In the literature a number of PAH emission profiles from both types have been presented (see e.g. Li and Kamens, 1993, Miguel et al., 1998, Staehlin et al., 1998, Strandell et al., 1994) including tunnel studies and chassis dynamometer tests both from Europe and USA. None of the five data sets included alkylated PAH. The test of the emission profiles on our data revealed that one should be cautious in the application and interpretation of these kind of studies. The 1992 to 1996 reduction of PAH from diesel vehicles appeared to be twice the reduction from petrol cars, i.e. that the 35% reduction of BbjkF and BeP in 1996 relative to 1992 can be split into a reduction on 22% caused by the decrease from diesel vehicles and 13% by petrol cars. Similar numbers are achieved if one compares the PAH reduction with that of CO as discussed later.
Mutagenicity
The mutagenicity of the extracts of the particles were determined applying the Salmonella
strains TA98 and TA98NR. TA98NR is devoid of the enzyme (nitroreductase) making the
bacteria able to reduce the nitro-group in nitro-PAC
3.3 Comparison of N-PAC and PAH
Background
The background for including determination of the basic N-PAC and testing for mutagenicity in a few samples was as mentioned in Section 2.2. the outstanding observations of Sera et al. (1994). Sera et al. (1994) reported identification and detection of strong mutagenic nitro-N-PAC in atmospheric samples and samples of diesel exhaust. In a historical perspective the presence of particle-associated N-PAC and PAH have been compared previously in samples from roof level in the inner city and in samples from a suburban area both from the period 1976-82 (Nielsen et al. 1986).
N-PAC
The concentrations of N-PAC (Table 3.3.1) are about one order of magnitude lower than
those of PAH (Fig. 3.2.1 and Table 3.3.2). N-PAC may be a more serious problem than the
PAH in other context, e.g. the contamination of soil with tar and creosote as well as
contamination of freshwater and marine sediments (Feilberg and Nielsen, 1998, Osborne et
al., 1997). But in relation to air pollution N-PAC can be considered to be a minor problem
compared to the PAH unless the N-PAC is a source for the formation of very potent
mutagenic and carcinogenic compounds. The carcinogenic and mutagenic potencies of N-PAC
are comparable with those of PAH (Nielsen et al., 1997). The dominant N-PAC associated
with particles have 2-4 rings. A significant fraction of the 2 ring N-PAC will also be
present in gas phase. Therefore, only the N-PAC having Mw > 178 are included in the
comparisons between the 1996 measurements and the previous measurements, i.e. benzoquinolines,
acridine, phenanthridine, benz(c)acridine and other dibenzoquinolines
Table 3.3.1. Comparison of the concentrations (±2s) of particulate azaarenes
(N-PAC)
Table 3.3.2. Comparison of the concentrations (±2s) of particulate PAH*
* From Table 3.1.1. 16 PAH samples.
Composition
The composition of N-PAC varies between the different sets of samples.
5,6-benzoquinoline+phenanthridine and dibenzoquinolines
N-PAC and PAH data set
The discussion above has prejudiced that the N-PAC data set is comparable with the PAH
data set. This assumption appear to be reasonable as the levels of most of the inorganic
components were very close in the two sets. Thus following ratios for the results from the
N-PAC data set to those from the PAH data set was observed: soot 0.87, inorganic gases
(NO, gas
N-PAC Mutagenicity
The mean mutagenicity levels were somewhat lower in the N-PAC sample set (Table 3.3.1) than in the PAH sample set (Table 3.1.1). The ratios between the two sets were as follows: TA98+S9: 0.66, TA98-S9: 0.59 and TA98NR: 0.71. Both PAH and N-PAC need metabolic activation to be active in the mutagenicity test. The results confirm that N-PAC is a minor contributor to the total mutagenic activity, although the contribution appears to be higher than expected provided that the mutagenic activities of the many different compounds can be considered to be additive. However, it has been shown that some of the lighter PAH increase the mutagenic activity while some of the heavier PAH and hydroxy derivatives have been shown to diminish the mutagenic activity of e.g. benzo(a)pyrene, 3-methylcholanthrene, 2-nitrofluorene and 1-nitropyrene (Edenharder and Tang, 1997, Grifoll, 1990, Hermann, 1981). The TA98+S9 results for the basic extract should represent the total mutagenic activity caused by N-PAC. As shown in Table 3.3.1 the mean level of this fraction was 10±7 rev./m3 or 31% of the mutagenicity of the total extract if the mutagenic activities of the different compounds are additive.
Polar neutral water soluble PAC
A significant part of the mutagenicity in the basic extracts is perhaps caused by atmospheric reaction products, perhaps polar neutral water soluble PAC. Thus, the mutagenicity of the basic extract was only about 3% of the total extract, if the ozone levels were below 5 ppb (results not shown). The mutagenicity level of the basic compounds correlated significantly with ozone (r=0.96, p<0.05). The identity of the mutagenic compounds are not known, and the GC-MS analyses of the extracts did not give any hints about their identity. However, it should be mentioned that the correlation only includes five data set.
Nitro-N-PAC
The results of the mutagenicity testing were not unambiguous to prejudice whether
potent nitro-N-PAC is present in ambient particulate matter or not. The nitro-N-PAC should
be direct acting mutagens and should cause high levels of mutagenicity in the TA98-S9 test
on the basic extract. The corresponding results with TA98NR should be strongly reduced for
some nitro compounds. No mutagenicity was detectable in three of the basic extracts
applying the TA98-S9 and TA98NR tests. The fourth showed a low level of mutagenicity (2.4
rev./m3) in TA98-S9 being 3.6% of the mutagenic activity for the total extract.
No mutagenicity was detected for the basic extract in the TA98NR test. The fifth basic
extract (19 Dec. 1996) showed an incredibly high mutagenicity in the TA98-S9 test (540
rev./m3). The TA98NR mutagenicity (91 rev./m3) was significantly
reduced, but still high. Both were much higher than the corresponding mutagenicity results
for the total extract: TA98-S9 13 rev./m3 and TA98NR 6.7 rev./m3.
The TA98+S9 results for the two fractions appeared rather typical. The GC-MS results of
the chemical analysis of the basic fractions were carefully investigated in order to
detect evidence for any nitro-N-PAC. The results were also compared with those achieved by
analysing some nitroquinolines and nitroacridines. No positive evidence was achieved for
the presence of nitro-N-PAC. Considering the 19 Dec. 1996 sample it was characterised by
minor levels of N-PAC (2.0 ng/m3 (Mw > 178), mean 2.9±1.0 ng/m3
(Table 3.3.1)), elevated levels of CO (2.1 ppm, mean 1.6±0.3 ppm) and colder ambient
temperatures
3.4 Correlations with other parameters
Correlations
Table 3.4.1 shows the coefficients for the linear correlations of PAH (benzo(a)pyrene, benzo(e)pyrene, benzo(ghi)perylene, coronene, benzo(b)-+benzo(j)-+benzo(k)fluoranthene and diesel-BeP) and of the oxy-PAH, benzanthrone, with other parameters. Table 3.4.2 shows the linear correlation coefficients of mutagenicity, TA98+S9, TA98-S9 and TA98NR, and of S-PAC, dibenzothiophene and benzo(b)naphtho(2,1-d)thiophene with other parameters. Fig. 3.4.1 shows some of the correlations of TA98+S9.
Diesel-BeP
Diesel-BeP (see Table 3.5.1.) is the proportion of benzo(e)pyrene originating from diesel exhaust emissions. It is calculated from the expression:
diesel-BeP = BeP*((MePh/Ph)-0.7)/(5.5-0.7)
where BeP is the concentration of benzo(e)pyrene, MePh is the sum of the concentrations of methylphenanthrenes including 4,5-methylene-phenanthrene, Ph is the concentration of phenanthrene, 5.5 is the ratio of MePh/Ph typical for diesel exhaust emissions, and 0.7 is the MePh/Ph ratio typical for other sources (Nielsen, 1996). Alkylated PAH including methylphenanthrenes are present in diesel oil in relatively high concentrations causing higher MePh/Ph ratio in diesel exhaust emissions than in emissions from petrol driven passenger cars. The concentrations of particle-associated methylphenanthrenes and phenanthrene in ambient air depend on the ambient temperature and the concentrations of particles as discussed in Section 3.2. However, the MePh/Ph ratio is almost independent of the ambient temperature and the particle concentrations as the vapour pressures of methylphenanthrenes are only slightly lower than that of phenanthrene. Benzo(e)pyrene is applied as an indicator for PAH as it is stable in the atmosphere and its proportion of the emitted heavier PAH is very similar for different sources. The uncertainty for the diesel-BeP values is larger than for the PAH measurements. First it is estimated by means of the concentrations of "three" PAH. Second the MePh/Ph ratio may vary both for different diesel emission sources as well as for other emission sources.
Table 3.4.1. Coefficients (r) of linear correlations of street air PAH (benzo(a)pyrene BaP, benzo(e)pyrene BeP, benzo(ghi)perylene BghiP, coronene Cor, benzo(b)-+benzo(j)-+benzo(k)fluoranthene BbjkF and dieselBeP) and the transformation product benzanthrone (BAO) with different air pollution components and outside city meteorological data.
Table 3.4.2. Coefficients (r) of linear correlations of street air mutagenicity and S-PAC (dibenzothiophene (dBT) and benzo(b)naptho(2,1-d)thiophene (BNT)) with different air pollution components and outside city meteorological data.
Fig. 3.4.1: TA98+S9 correlations with a PAH, BeP, the tracer for long-distance
transport, sulphur dioxide (
PAH correlations
The single PAH correlated with the other PAH (Table 3.4.1). The coefficients were in
the range 0.66-0.97. The best correlation was achieved between benzo(e)pyrene and
benzo(b+j+k)fluoranthene. The lowest coefficient was achieved between coronene and
benzo(e)pyrene. However, the range of the coefficients is probably accidentally affected
by uncertainties for the chemical analyses and perhaps also a complex combination of
changes in emission compositions and atmospheric chemistry. At least, there was no
correlations between the coefficients for the 1996 data set and those for the 1992-93 set
(r=0.22, p>0.05). The PAC are the dominant contributors to the mutagenicity. Most of
the correlations between the PAH and the mutagenicity were significant. PAH has previously
been demonstrated to originate mainly from traffic sources (Nielsen et al., 1995b and c,
Nielsen 1996). Correspondingly, traffic emissions are the major contributor to the levels
of NO, gas
Table 3.4.3. The concentrations (units as Table 3.1.1) of particulate polycyclic aromatic compounds (PAC) and mutagenic activity and other inorganic components during a long-range transport episode on 22 April 1996 and comparison with the 1996 mean levels.
Diesel-BeP
Diesel-BeP correlated with the traffic indicators, NO and gas
Oxy-PAH
The dominant part of benzanthrone is associated with particles while the partitioning
of anthraquinone between gas phase and particle association may be roughly about 1:1
depending on the ambient temperature and the particle concentration (Ligocki and Pankow,
1989). The discussion in the following focus, therefore, on benzanthrone. The oxy-PAH,
benz-anthrone, had significant correlations with most of the PAH, benzo(a)-pyrene,
benzo(e)pyrene, benzo(ghi)perylene and benzo(bjk)fluoranthene (r=0.49-0.83, p<0.05),
soot (r=0.53, p<0.05), the traffic indicators, NO and gas
Stockholm street air (BAO 18 ng/m3 and BeP 8.1 ng/m3) (Strandell et al., 1994) > Copenhagen street air (BAO 3.7±1.2 ng/m3 and BeP 3.1±0.7 ng/m3) > Toronto suburban air (2.5±0.2 and BaP 1.0±0.2) (Pierce and Katz, 1975) > Boston street air (1.18±0.06 and 1.34±0.03) (Allen et al., 1996 and 1997) > Hamilton downtown (0.8±0.3 and 2.3±1.1) (Legzdins et al., 1994) > Los Angeles different sites (0.6±0.3 and 0.8±0.3) (Rogge et al., 1993a) > (Barcelona city background air (0.3±0.5 and 3.0±1.1) (Bayona et al., 1994). Thus our observations and those from Stockholm, Toronto, Boston and Los Angeles indicate that the levels of benzanthrone should be in the same magnitude as the most abundant PAH or even higher, while the observations from Hamilton and Barcelona contradict this. Our observations and those from Barcelona showed higher concentrations of benzanthrone at summertime while no seasonal variations were observed in the measurements from Toronto and Los Angeles. Strandell et al. (1994) found that the ratio between benzanthrone and benzo(e)pyrene was a factor of five higher in the street air than in diesel and petrol exhaust samples. Also the ratio between benzanthrone and other oxy-PAH was higher in street air than in exhaust samples. Although not disclosing the possibility, Kamens et al. (1985 and 1989) did not find any indications for atmospheric formation of benzanthrone in smog chamber experiments. Spitzer and Kuwatsuka (1993) had compared top soil samples with atmospheric particulate matter and Rogge et al. (1993b) and Yang and Baumann (1995) had investigated the composition of road dust. Although some of the results indicate an enrichment of benzanthrone compared to the PAH the enrichment factor is too low to explain that resuspension processes may be an important source for benzanthrone but not for PAH.
S-PAC
S-PAC, dibenzothiophene and benzo(b)naptho(2,1-d)thiophene, have previously been detected at elevated concentrations in long-range transported polluted air from the Continent (Nielsen et al., 1993). In the sample of 22 April both components were increased with a factor of two (see Table 3.4.3. and Fig. 3.4.2.). Both benzo(b)naptho(2,1-d)thiophene and dibenzothiophene correlated with sulphur dioxide (r=0.60-64, p<0.05) (Table 3.4.2) also indicating long-range transport as an additional source of S-PAC. Furthermore, benzo(b)naptho(2,1-d)thiophene correlated with most of the PAH, benzo(e)pyrene, benzo(a)pyrene, benzo(bjk)fluoranthene and benzo(ghi)perylene, (r=0.56-0.82, p<0.05), benzanthrone (r=0.68, p<0.01) and the mutagenicity (r=0.62-0.64, p<0.05). A possible explanation for the correlations between benzo(b)naptho(2,1-d)thiophene and potassium may be that emissions from the application of coal on the Continent may contain both components. The reasons for the correlations between benzo(b)naptho(2,1-d)thiophene and the soil elements, Ti, Si and Ca, (r=0.57-0.67, p<0.05) are not evident. Benzo(b)naptho(2,1-d)thiophene correlated also with Se (r=0.63, p<0.05) but not with As (r=0.37, p>0.05). The concentrations of both Se and As were elevated during the long-range transport episode (Table 3.4.3). The discussion of the correlations of S-PAC has focused on those of benzo(b)naptho(2,1-d)thiophene. The correlations of dibenzothiophene with other elements are more sensitive towards variations in ambient temperature and concentrations of particles in the atmosphere. The analyses of S-PAC in the air include only the particle-associated part. About 95% of dibenzothiophene is present in gas phase, while about 50% of benzo(b)naptho(2,1-d)thiophene is associated with particles.
 (6
Kb)
(6
Kb)
Fig. 3.4.2: The elevation of air pollutants during the long-range transport episode
on 22 April 1996 normalised to the average levels. Abbreviations: see the legend to Fig.
1-3. The atmospheric processes caused a heavy increase in the levels of mutagenic
activity, TA98+S9, TA98-S9 and TA98NR. The long-range transport increased also the levels
of the S-PAC, DBT and BNT, the oxy-PAH, BAO and sulphur dioxide. The long-range transport
contribution of the reference PAH, BbjkF) and BeP was much minor. The reactive PAH, CP and
BaP was depleted during the transport by atmospheric degradation. Local sources were the
dominant ones for the components related to traffic pollution, i.e. the PAH: BghiP and Cor
and the inorganic gases, nitrogen monoxide (NO), gas
Mutagenicity
The mutagenicity, TA98+S9, TA98-S9 and TA98NR, was 5-7 times higher during the long-range transport episode than the mean values (Table 3.4.3.). The chemical processes in the atmosphere changing the PAC composition in the transported polluted air masses causes a significant increase in the amounts of mutagenic species. Fig. 3.4.3 shows that the strong increase in the relative content of mutagenic activity can be related to the chemical age of the air pollution. The ratio between 2-nitrofluoranthene and 1-nitropyrene is used as an indicator for the chemical age. 2-nitrofluoranthene is formed by atmospheric reactions, while 1-nitropyrene is directly emitted to the atmosphere, especially from diesel engines. The relative increase in the direct acting mutagenic activity was larger than that of the indirect acting. The increase in direct acting nitro-PAC and that of the other PAC was almost the same. The increase in the ratio between mutagenic activity and the PAH concentration during long-range transport episodes from the Continent has been observed in previous studies (Fenger et al., 1990, Nielsen and Pilegaard, 1990, Nielsen et al. 1995b and c). Table 3.4.4. compares the different observations. Comparing the incidences of local pollution the relative levels of mutagenicity were lower in the samples from 1986-1987 and 1993. It was characteristic for these samples that the weather generally was colder than for the samples from 1992 and 1996. Whether the relatively lower mutagenicity can be related to the meteorological conditions is not known at present. The 1996 data do not give further evidence for whether the relations between the PAH to mutagenicity ratio and ambient temperature are real or incidental. None of the correlations between the PAH to mutagenicity ratio and the ambient temperature were significant (r=0.32-0.47, p<0.05), but both the ratio (BeP+IP)/TA98-S9 and that of (BeP+IP)/TA98NR showed a decreasing trend with increasing ambient temperature. Nevertheless, in each case the long-range transport data showed relatively higher mutagenic activity than the corresponding local pollution data from the same year. Especially, the relative increase in the mutagenic activity in the long-range transport data from 22 April 1996 is high. For risk assessments purpose and epidemiological studies it may be important if atmospheric reactions is an increasing contributor to mutagenic compounds. However, the available data is are insufficient to determine if such a trend exists.
Mutagenicity correlations
The mutagenic activities correlated with most of the PAH (r=0.63-0.80, p<0.05), but much better correlations were observed assuming a non-linear relationship (see Fig. 3.4.1.). Only the correlations between TA98+S9 and benzo(ghi)perylene and coronene, (r=0.39-0.54, p>0.05) were not significant. Benzo(ghi)perylene and coronene is emitted in relatively high concentrations from traffic sources, and their increase on 22 April was less than most of the other heavy PAH (Table 3.4.3). The most important of the other correlations are those with sulphur dioxide (r=0.61-0.79, p<0.05) also supporting the contribution from long-range transport. Incidents of elevated mutagenic activity may also be caused by local phenomena. Thus the mutagenic activities were elevated with a factor of 2-4 on 5 December compared to the mean values (Fig. 3.4.3 and Table 3.4.5). The reasons for this elevation appears to be chemical processes in the atmosphere as indicated by the correlations in Fig. 3.4.3, although it is not evident from the results of the other different measurements. Thus, the high content of cyclopenteno(cd)pyrene in the sample may indicate that the sample has been affected by a petrol car running in idle for a long time close to the sampler. The Hi-Vol sampler is located a few meters from the house locating the instruments for gas phase components and filter samplers for particles, soot and inorganic elements. The Hi-Vol samples were collected in 1.2 m height, while the other samples were collected in 3 m height. All the samplers are located between the road and a parking area. Thus, it is possible that a car running in idle for a long time close to the Hi-Vol sampler may affect the PAC and mutagenicity samples without affecting the other samplers. Cyclopenteno(cd)pyrene is a reactive PAH (Nielsen, 1988) having petrol vehicles as the main source - but its high atmospheric reactivity implies that it is not a valid atmospheric indicator for petrol emissions. On the other hand the strong enhancement of cyclopenteno(cd)pyrene by a factor of 7.8 may suggests a source very close to the sampler. Benzo(ghi)perylene and coronene were elevated with a factor of 2.0 and 2.6, respectively, while the enhancement of methylphenanthrenes and most of the other PAH was about 1.5. However, as the enhancement of the direct acting mutagens, including nitro-PAC, were stronger (4.4) than the enhancement of indirect acting mutagens, a nearby petrol car running in idle, may not explain the elevation in mutagenic activity.
 (6
Kb)
(6
Kb)
Fig. 3.4.3: Influence of chemical age on the inverse relative mutagenicity. The inverse relative mutagenicity is expressed by the ratio between the sum of the PAH reference components, BbjkF, BeP and IP, and the mutagenic activity. The ratio between the relative levels of 2-nitrofluoranthene and 1-nitropyrene is applied as indicator for the chemical age of the polluted air masses.
Table 3.4.4. Comparison of the ratio between PAH (sum of benzo(e)pyrene (BeP) and indeno-(1,2,3-cd)pyrene (IP)) and mutagenic activity, TA98-S9, TA98+S9) and TA98NR) at H.C. Andersens Boulevard and a suburban area during incidence of local pollution and during incidence of long-range transport episodes.
Indicator correlations
Some of the air pollution components are determined each day in the surveillance programme in order to monitor the air quality in Copenhagen. This is not possible for the PAH and other PAC for economical reasons. The correlations between PAC and NO/soot may be useful as a guideline in order to evaluate the possible development of the situation. However, this approach should be replaced with real measurements in case the situation requires it. Although the soot to PAC correlations were different for the 1996 and 1992-1993 measurements, this has only major implications at very low or very high pollutant concentrations. E.g. assuming the level of soot is 50 mg/m3 the 1996 correlations predict the level of benzo(a)pyrene to be 2.3 ng/m3, while the 1992-1993 correlations predicted 1.9 ng/m3. The higher level predicted by the 1996 correlations reflects, as discussed later, that the decrease in PAH appears to be larger than the decrease in other air pollutants, for example soot. The following correlations between NO/soot and PAC at the busy street have been observed:
Table 3.4.5. The concentrations (units as Table 3.1.1) of particulate polycyclic
aromatic compounds (PAC) and mutagenic activity and other inorganic components during an
local episode on 5 December 1996 with increasing mutagenic activity* and comparison with
the 1996 mean levels.
* (Bep+IP)/TA98-S9: 0.05, (BeP+IP)/TA98+S9: 0.06, (BeP+IP)/TA98NR: 0.011.
Street air 1996:
BaP
r = 0.71, p < 0.01.
BeP
r = 0.63, p < 0.01.
BghiP
r = 0.59, p < 0.05.
Cor
r = 0.45, p > 0.05.
BbjkF
r = 0.62, p < 0.01.
BAO
r = 0.50, p < 0.05.
Street air 1996:
BaP
r = 0.60, p < 0.05.
BeP
r = 0.56, p < 0.05.
BghiP
r = 0.51, p < 0.05.
Cor
r = 0.45, p > 0.05.
BbjkF
r = 0.61, p < 0.01.
BAO
r = 0.53, p < 0.05.
Street air 1992-1993:
BaP
r = 0.76, p < 0.01.
BeP
r = 0.72, p < 0.05.
BghiP
r = 0.72, p < 0.05.
Cor
r = 0.75, p < 0.05.
BbjkF
r = 0.75, p < 0.05.
3.5 Trend analysis
Decreasing content of PAH and other mutagens
Trend analyses of air pollutants require continuous frequent measurements for several
years in order to be able to observe significant trends (Jensen et al., 1993). One of the
reasons is that air pollutant concentrations are highly dependent on the meteorological
conditions. Different meteorological conditions may cause air pollutant variations to be
larger than those caused by changes in the emissions not only on a daily basis but also
from one year to another. In the following the variations of PAH and other mutagens are
related to those of the air pollutants measured on a daily basis each year in order to
limit the influence of the different meteorological conditions. The results are presented
in Table 3.5.1. and 3.5.2. The comparisons indicate that the regulations of traffic
emissions induced by the environmental authorities have had a greater impact on the levels
of PAH and other airborne mutagens than on the levels of nitrogen oxides, CO and soot.
Thus the PAH decreased 19±12% from 1992 to 1993 and 38±8% from 1992 to 1996. The
decrease in mutagenicity was 42±18% from 1996 to 1992. The decrease in the four reference
components, NO, gas
Table 3.5.1. Trend of PAH levels and other coincident parameters measured in street air in the center of Copenhagen.
Trend of particulate elements
Table 3.5.2. compares the 1996 and 1992 levels of PAH, mutagenicity and particle-associated elements. The table only includes the PAH and mutagenicity levels in 1992 from those days where the corresponding inorganic elements were measured. This comparison also shows a relative decrease in the PAH concentrations and mutagenicity levels. Thus the PAH concentrations decreased with 50±9% and the mutagenicity levels with 42±18% from 1992 to 1996. The six reference inorganic elements, S, K, V, Ni, Zn and Cu, increased in the same period with 22±16%. Two inorganic elements, Pb and Br, showed another behaviour than the others. The phase out of lead and lead scavengers in petrol caused Pb and Br to decrease with about 85% from 1992 to 1996.
Table 3.5.2. Comparison of 1996 to 1992 ratios of PAH and mutagens with particulate associated inorganic elements.
3.6 The influence of ambient temperature and global radiation
Seasonal variation
The summer to winter variation of PAC showed different patterns depending on the type of compounds, their source relations and whether the long-range transport episode was included in the data set or not. The oxy-PAH, benzanthrone, had higher atmospheric concentrations in the summer half-year than the winter half-year (See Table 3.6.) confirming that atmospheric processes are a source of benzanthrone. The reactive PAH, cyclopenteno(cd)pyrene and benzo(a)pyrene (Nielsen, 1988), showed the opposite tendency of benzanthrone having the highest concentrations at winter-time. The photolytic degradation of benzo(a)pyrene was also confirmed by the anticorrelation between the ratio of benzo(a)pyrene and benzo(e)pyrene and the global radiation (r=-0.66, p<0.01). The summer to winter ratios for the remaining PAC were close to the range of ratios (0.88-1.48) for the inorganic reference components, traffic gases (0.88-1.05), soot (1.09), particles (1.13), sulphate (0.91) and other particulate elements (0.93-1.48). The summer to winter ratios of mutagens were 1.2-2.1 including all the data and 0.34-0.53 if the data sets of the long-range transport episode and the other chemical age incidence was omitted. Thus, the 1996 data are not in contradiction with the observations in the 1992 data set. In 1992 much lower mutagenicity was observed in March than the colder months January and February (Table 3.6). On the other hand it is not evident from the 1996 data set that the emissions of PAH and other mutagens from vehicles should be much higher at cold weather conditions than at higher ambient temperatures. As a matter of fact the content of the reference PAH, benzo(bjk)fluoranthene, benzo(e)pyrene and indeno(1,2,3-cd)pyrene, was almost the same in the winter and summer samples. Furthermore, Ladefoged and Schramm (1998) were not able to observe a winter effect on the PAH emissions from a diesel engine (Ladefoged and Schramm, 1998).
Table 3.6. The influence of the weather conditions (temperature) on the air pollution levels of PAC, mutagens and inorganic components at the street site in 1992 and 1996.
[Front page] [Contents] [Previous] [Next] [Top] |