[Front page] [Contents] [Previous] [Next] |
Effects of the increase in the danish waste tax
2. Development in taxable waste amounts 1997-1998
2.1. Introduction
2.2. Amendments in taxable waste amounts in 1997 and 1998
2.3. Development from 1996 to 1998
2.4. Waste amounts compared to a baseline
2.1. Introduction
In this chapter, the development in total taxable waste amounts is outlined. In section 2.2, amendments in taxable waste in 1997 and 1998 are stated, and in section 2.3 the development in waste amounts is described. Section 2.4 relates the development in waste amounts from 1996 to 1998 to the corresponding economic development in production and consumption.
2.2. Amendments in taxable waste amounts in 1997 and 1998
Extension of waste taxation base
In 1997 and 1998 some important amendments in the definition of taxable waste were introduced:
| Sludge incinerated at incinerators located at wastewater treatment plants became taxable as from 1st January 1997 (Act No. 1224 of 27th December 1996). In this context, taxable amounts are stated as four times the weight of the dry matter. |
| Lime for flue gas cleaning in waste incineration became taxable as from 1st January 1997 (Act No. 1224 of 27th December 1996). |
| The landfill of residues from power plants based on fossil fuel or biomass became taxable as from 1st January 1998 (Act No. 1107 of 29th December 1997 on amendments of certain Acts on excise duties (including the abolition of tax exemption for slag)). |
Decisive amendments
In the study of the development in taxable waste amounts in 1998, it is very important to pay attention to these amendments in the taxation base for the waste tax. Amendments are consolidated in Statutory Order No. 570 of 3rd August 1998.
No implications of abolition of refund scheme
In addition, the refund scheme for recycling enterprises was abolished as from 1st January 1998 (Act No. 1099 of 29th December 1997 on change of tax on waste and raw materials (abolition of possibility for recycling enterprises to receive a refund for the waste tax etc.)), but this abolition has no implications for statistics on taxable waste amounts.
2.3. Development from 1996 to 1998
Reporting to the Customs and Tax Regions
On the basis of reports from taxable waste treatment plants to the Customs and Tax Regions concerning waste amounts received and waste amounts subsequently removed from the different plants, it is possible to describe the development in waste amounts. A more detailed description of the method and principles for the statement is given in Working Report No. XX 1997 from the Danish Environmental Protection Agency. In the statement, a distinction is made between municipal plants receiving waste from collection schemes, and inert waste landfills receiving primarily construction and demolition waste as well as a few fractions of assigned waste. In addition, waste fractions such as slag and sludge etc. which became subject to the tax as from 1997, are compiled under the category "other" (for a precise definition of types of waste treatment plants, reference is made to the above-mentioned report). In the statement, it has not been possible to control for the fact that lime etc. for flue gas cleaning at waste incineration plants has become taxable, but on the basis of data in Affald & Milj� (Rendan, 1998) it is assessed that this change has led to an increase of around 16,000 tonnes in gross delivered amounts to municipal plants.
Distinction between gross and net
A distinction is made between gross and net delivered waste amounts. Net waste amounts are calculated as gross waste amounts delivered to registered plants, with a deduction of waste subsequently removed from the plant. Data are rounded to the nearest thousand.
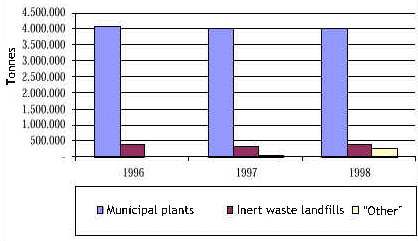
Figure 2.1. Gross waste amounts delivered to registered plants 1996-1998. (Source: Reports from the Customs and Tax Regions)
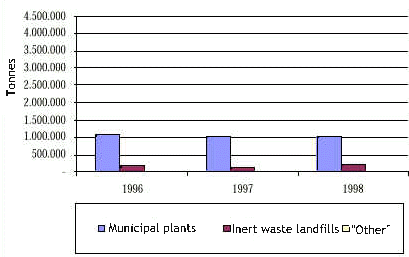
Figure 2.2. Amounts of waste removed from registered plants 1996-1998 (Source: Reports from the Customs and Tax Regions).
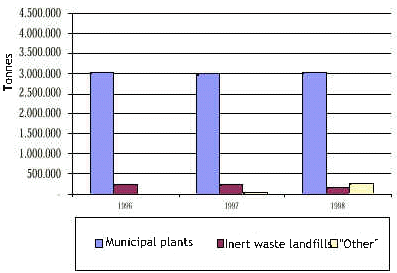
Figure 2.3. Net delivered waste amounts (delivered minus removed) at registered plants 1996-1998 (Source: Reports from the Customs and Tax Regions)
Gross
Figure 2.1 shows the development in gross delivered waste amounts for 1996-1998. The development at municipal plants from 1996 to 1998 shows a reduction in gross delivered amounts from 4.086 million tonnes to 4.034 million tonnes, corresponding to a total of 52,500 tonnes or a reduction of 1.3 per cent. The development at inert waste landfills etc. from 1996-98 shows that delivered amounts decrease from 0.416 million tonnes to 0.395 million tonnes, i.e. by around 21,000 tonnes or 5.1 per cent. In the category "other", 49,903 tonnes were delivered in 1997, a figure that increased in 1998 to 293,847 tonnes. This increase is due to the fact that residues etc. from power plants became subject to the tax in 1998.
Removed waste
Figure 2.2 shows the development in waste amounts removed from plants. Amounts removed decrease at municipal plants, whereas they increase at inert waste landfills etc. At municipal plants a decrease in amounts removed is seen from 1996 to 1998, from 1.067 million tonnes to 1.028 million tonnes, corresponding to 39,000 tonnes or 3.6 per cent. At inert waste landfills there is an increase in amounts removed, from 178,000 tonnes to 213,000 tonnes, corresponding to around 35,000 tonnes or 20 per cent.
Net - a reduction of 0.5 per cent
Figure 2.3 shows the development in net delivered waste amounts (gross minus removed). At municipal plants a modest decrease in net delivered amounts is seen from 1996 to 1998, from 3.020 million tonnes to 3,006 million tonnes, corresponding to 14,000 tonnes or a decrease of 0.5 per cent2. At inert waste landfills there is a more remarkable decrease from 238,000 tonnes to 182,000 tonnes, corresponding to 56,000 tonnes or 23.5 per cent. In the category "other" it is seen that the extension of the taxation base, also for net amounts, leads to a significant increase in the amounts in this category, from 47,000 tonnes in 1997 to 281,000 tonnes in 1998. Of new taxable waste, residues from power plants based on fossil fuel or biomass accounted for 215,635 tonnes.
Continued stagnation
The major part of waste is led to municipal plants, and hence the key result seems to be that the stagnation in the development in waste amounts, which came in 1993 after a remarkable decrease in the period 1987-1993, has continued in 1997 and 1998.
No checking of data
It has not been possible to check off the present quantitative statement with the monetary statement made by the Central Customs and Tax Administration as it was done for the period 1987-96. This is due to lack of data on deferred payment cases that have implications for revenue statements from the waste tax. As deferred payment cases primarily concern few enterprises and special waste types it is assessed that these cases do not influence the result for municipal waste treatment plants. However, it would be expedient to ensure a consolidated documentation on deferred payment cases for future statements.
ISAG
According to the Danish Information System for Waste and Recycling, the ISAG, taxable waste amounts for landfill and incineration decreased from 1996 to 1997 by 2 per cent, when slag/sludge are excluded from statistics, and by 4 per cent by including these fractions. This gives a reasonable accordance between the ISAG and the statement made on the basis of data from the Customs and Tax Regions. However, the ISAG assesses the decrease in taxable waste amounts to be somewhat larger. Data from the Customs and Tax Regions are based on waste that has actually been on the weigh-bridge, whereas the ISAG to some extent uses estimated amounts, so it is believed that data from the Customs and Tax Regions are the most authoritative. (It would be expedient if the ISAG asked the registered plants to use the same figures for waste statistics as those reported to the Customs and Tax Regions).
New trend for industrial and commercial waste
The division into waste types in the ISAG shows that from 1996 to 1997 there was a decrease in both domestic waste and industrial and commercial waste when it comes to taxable amounts. If this trend continues in 1998, this indicates a new development in industrial and commercial waste that so far has shown a steep increase.
Diversion from landfill to incineration
Due to the differentiation of the waste tax some waste has been diverted from landfill to incineration. However, in this context the ban on the landfill of waste suitable for incineration also plays a role, so it is impossible to determine separately the effect of the tax without special studies. However, the study of enterprises reported in the following has given the impression that many enterprises have been aware of savings to be gained by diverting waste from landfill to incineration. Data from the ISAG show that from 1996 to 1997 there was a decrease in the rate of waste to landfill from 50 per cent to 46 per cent of taxable waste. If sludge and slag are excluded, the landfill rate for taxable waste drops to 38 per cent in 1997. Both for household waste and industrial and commercial waste, the landfill rate decreases by some 4 per cent; however, whereas only 6 per cent of household waste is landfilled, the rate for industrial and commercial waste still amounts to 58 per cent.
2.4. Waste amounts compared to a baseline
Baseline index
In figure 2.4, the development in waste amounts from 1996 to 1998 is related to the development in the net production index and private consumption index from Statistics Denmark.
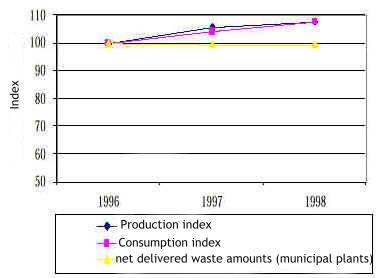
Figure 2.4. Index for net delivered waste amounts to municipal plants and inert waste landfills, and net production index and private consumption index (Source: Statistics Denmark).
De-coupling of waste generation and economy
From 1996 to 1998, both the net production index and the consumption index showed a significant increase, both of around 7 per cent. It is most relevant to compare these two indices with the development in net delivered waste to municipal waste treatment plants. Here, the net development from 1996-98, as mentioned above, was a decrease of 0.5 per cent. Therefore it is natural to interpret the development to the effect that, in this period, a certain de-coupling of taxable waste generation and economic development has been maintained. It is estimated that the high costs of traditional waste disposal, including the tax burden, have contributed to this result, but is difficult in more precise terms to estimate the role of the increase in the waste tax.
_________________________
if a correction is made for the increase in quantities as a consequence of lime for flue gas cleaning in waste incineration becoming subject to the tax, the reduction amounts to 1 per cent.[Front page] [Contents] [Previous] [Next] [Top] |