[Front page] [Contents] [Previous] [Next] |
Waste Statistics 1997
2. Waste generation, general
2.1 Generation
2.2 Treatment of waste in 1997
2.2.1 Total waste amounts
2.2.2 Treatment of ordinary waste
2.2.3 Treatment by sources and waste types
Table 1 and Figure 1 show waste generation within various sectors. These figures are compared to corresponding figures for 1995 and 1996.
| Table 1. Total waste generation in Denmark in 1995, 1996 and 1997. | '000 tonnes |
Change in % |
||
| Source | 1995 |
1996 |
1997 |
1996-97 |
| Households | 2,610 |
2,767 |
2,776 |
0 |
| Domestic waste | 1,628 |
1,655 |
1,621 |
-2 |
| Bulky waste | 618 |
639 |
588 |
-8 |
| Garden waste | 326 |
401 |
443 |
10 |
| Other | 38 |
72 |
124 |
73 |
| Institutions, trade and offices | 834 |
851 |
861 |
1 |
| Manufacturing etc. | 2,563 |
2,632 |
2,736 |
4 |
| Building and construction | 2,559 |
3,088 |
3,427 |
11 |
| Wastewater treatment plants | 1,195 |
1,212 |
1,248 |
3 |
| Slag, fly ash etc. (coal-fired power plants) | 1,699 |
2,332 |
1,775 |
-24 |
| Other | 6 |
30 |
34 |
14 |
| Total | 11,466 |
12,912 |
12,857 |
0 |
Sources: ISAG-reports for 1995, 1996 and 1997, Danisco, Association of Danish Recycling Industries and other large scrap dealers, Elsam, Elkraft, and reports to the Danish Environmental Protection Agency on sludge from municipal wastewater treatment plants applied to farmland, and incineration in sludge incineration plants (for 1997, figures from 1996 are used). Figures for sludge are stated in wet weight. A dry matter rate of 13.7 per cent has been used. Figures have been adjusted for imports of waste. The generation of waste in relation to the ISAG reports has been found by stating the quantity of waste delivered to waste treatment plants from primary sources. For this purpose, "primary sources" means waste generators that are not waste treatment plants (reprocessing facilities, incineration plants, composting and biogas plants, and landfills). Waste such as slag, fly ash, and flue gas cleaning products from waste incineration plants is therefore not included in the statement as it would otherwise be counted twice. Furthermore, waste from the source "recycling centres/transfer stations" is distributed on the original source. The principles for distribution are given in Annex 2.
Table 1 and Figure 1 show the following changes in total waste generation from 1996 to 1997:
| Total waste generation in 1997 remained relatively stable compared to 1996. A small decrease of 55,000 tonnes or 0.5 per cent was registered. | |
| Total waste generation in households was almost identical to 1996: 2,776,000 tonnes in 1997 against 2,767,000 tonnes in 1996. Of this, domestic waste amounts decreased by 2 per cent from 1,654,500 tonnes in 1996 to 1,620,800 tonnes in 1997. Bulky waste amounts decreased by 8 per cent from 639,100 tonnes in 1996 to 587,700 tonnes in 1997, whereas garden waste amounts increased by 10 per cent to 442,700 tonnes in 1997. |

![]()
Source: See Table 1 above.
| Waste generation in institutions, trade and offices increased by 1 per cent, or 10,000 tonnes. | |
| Waste generation in manufacturing industries etc. increased by 4 per cent corresponding to 104,000 tonnes. | |
| Waste generation in the building and construction sector increased by 11 per cent, or 339,000 tonnes. | |
| Waste generation at wastewater treatment plants increased by 3 per cent to 1,248,000 tonnes. | |
| Waste generation at coal-fired power plants decreased by 24 per cent, corresponding to a decrease from 2,332,000 tonnes to 1,775,000 tonnes. |
The slight decrease in overall waste generation can be attributed to waste generation at coal-fired power plants, which was reduced by around one quarter compared to the previous year. If residues from power plants are kept apart from overall waste amounts, an increase in waste amounts of 502,000 tonnes or around 5 per cent has been registered.
70 per cent of this increase can be attributed to the building and construction sector, where waste amounts increased by 11 per cent from 1996 to 1997. Waste amounts in other sectors such as households, institutions, trade and offices, and the manufacturing industry only increased by between 0 and 4 per cent.
If also waste amounts from building and construction activities are kept apart from total waste amounts, an increase of 2 per cent in waste amounts from 1996 to 1997 has been registered.
In the Government's Plan of Action for waste and recycling 1993-97 it was expected that waste amounts would increase up to 9.8 million tonnes in 1997 and then remain stable up to year 2000. This has not been the case. With a waste generation in 1997 of 12.8 million tonnes, amounts projected in the Plan of Action were exceeded by 3 million tonnes.
Projections and objectives for waste amount developments stated in the Plan of Action were based on a survey of waste amounts in 1985, carried out by the Danish Environmental Protection Agency and regional councils. This was the first survey of waste amounts, and data were mostly based on estimates and theoretic calculations. Therefore, 1985-figures, and consequently also projections for developments up to year 2000, are subject to uncertainty.
With the implementation of the ISAG in 1993, which is based on reports of actual waste amounts delivered to treatment plants, data on waste generation have become considerably more reliable.
2.2 Treatment of waste in 1997.
Developments in waste amounts are shown below and related to objectives laid down in the Government's Plan of Action for waste and recycling 1993-97 for waste treatment in year 2000 (in the following called Target 2000).
2.2.1 Total waste amounts.
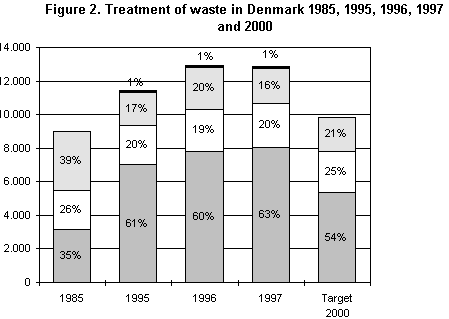
It can be seen from Table 2 that 63 per cent of total waste amounts was recycled in 1997, whereas 20 per cent was incinerated and 16 per cent landfilled. This means that the Plan of Action's overall objectives for recycling for year 2000 (54 per cent), incineration (maximum 25 per cent) and landfilling (maximum 21 per cent) have been attained.
| Table 2. Waste generation in 1995, 1996, 1997, and year 2000 by treatment option. | '000 tonnes |
||||||||
| Treat- ment |
1995 | 1996 | 1997 | Target 2000 | |||||
tonnes |
% |
tonnes |
% |
tonnes |
% |
tonnes |
% |
||
| Recycling | 7,046 |
62 |
7,787 |
60 |
8,046 |
63 |
5,300 |
54 |
|
| Incineration, of which | 2,306 |
20 |
2,507 |
19 |
2,622 |
20 |
2,500 |
25 |
|
| Sludge incineration plants | 170 |
170 |
177 |
||||||
| Incineration plants with energy recovery | 2,136 |
2,337 |
2,445 |
||||||
| Landfilling | 1,969 |
17 |
2,524 |
20 |
2,103 |
16 |
2,000 |
21 |
|
| Special treatment | 145 |
1 |
95 |
1 |
86 |
1 |
|||
| Total | 11,466 |
12,912 |
12,857 |
9,800 |
|||||
Sources: ISAG reports 1995, 1996 and 1997, the Government’s Plan of Action for waste and recycling 1993-97, Danisco, Association of Danish Recycling Industries and other large scrap dealers, Elsam, Elkraft and reports to the Danish Environmental Protection Agency on sludge from municipal wastewater treatment plants applied to farmland, and incineration in sludge incineration plants (for 1997, figures from 1996 are used).
Table 2 and Figure 2 show that 8,046,000 tonnes, or 63 per cent of total amounts of waste, were recycled in 1997. This corresponds to an increase of 259,000 tonnes or 3 per cent compared to 1996. Waste incinerated in 1997 amounted to 2,622,000 tonnes, which corresponds to 5 per cent more than in 1996, whereas amounts of waste landfilled decreased by 17 per cent to 2,103,000 tonnes.
The significant decrease in landfilled waste amounts may be attributed to several different factors: Firstly, a steep drop in amounts of residues from coal-fired power plants was registered in 1997. Secondly, on 1st January 1997 the ban on landfilling of waste suitable for incineration as well as an increase in the tax rate for landfilling took effect. Much waste suitable for incineration that used to be landfilled is now incinerated.
 |

Sources: ISAG reports 1995, 1996 and 1997, the Government’s Plan of Action for waste and recycling 1993-97, Danisco, Association of Danish Recycling Industries and other large scrap dealers, Elsam, Elkraft, and reports to the Danish Environmental Protection Agency on sludge from municipal wastewater treatment plants applied to farmland, and incineration in sludge incineration plants (for 1997, figures from 1996 are used). Special treatment means, for example, incineration with energy recovery (Kommunekemi), or pre-treatment for incineration or landfilling of, among others, health-care waste, oil and chemical waste, and other types of hazardous waste.
2.2.2 Treatment of ordinary waste.
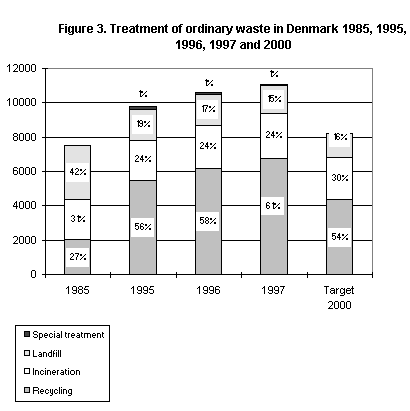
As mentioned, the decrease in amounts of residues from coal-fired power plants has had a significant impact on the decrease in total waste amounts. It is therefore interesting to keep residues from power plants apart from statistics and take a closer look at general developments in the treatment of ordinary waste.
In Figure 3, slag and fly ash amounts are not included, and it is seen that 61 per cent of ordinary waste was recycled in 1997. This is somewhat more than projected in the Plan of Action. Objectives for maximum incineration and landfilling have also been attained, as 24 per cent of ordinary waste was incinerated and 15 per cent landfilled in 1997.
Sources: ISAG reports 1995, 1996 and 1997, the Government’s Plan of Action for waste and recycling 1993-97, Danisco, Association of Danish Recycling Industries and other large scrap dealers, Elsam, Elkraft, and reports to the Danish Environmental Protection Agency on sludge from municipal wastewater treatment plants applied to farmland, and incineration in sludge incineration plants (for 1997, figures from 1996 are used).
In absolute figures, this means that 11,082,000 tonnes of ordinary waste were generated in 1997. Of this amount, 6,746,000 tonnes were recycled, 2,622,000 tonnes were incinerated, and 1,628,000 tonnes landfilled. 86,000 tonnes were subjected to special treatment.
Due to the high activity in the building and construction sector, it may also be of interest to keep construction and demolition waste apart from statistics.
If both slag and fly ash, and construction and demolition waste are kept apart, it is seen that 47 per cent of waste was recycled in 1997, whereas 34 per cent was incinerated, and 18 per cent landfilled. Because of the large amounts and the high rate of recycling (92 per cent), construction and demolition waste has a significant impact on the achievement of objectives for year 2000 in the Plan of Action for waste and recycling.
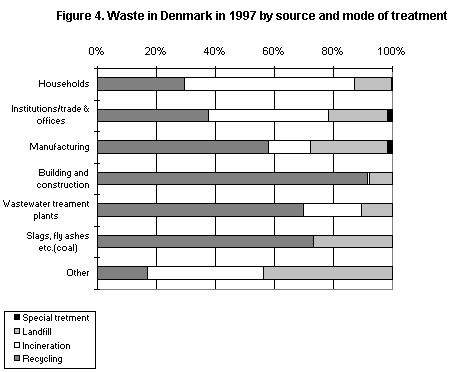
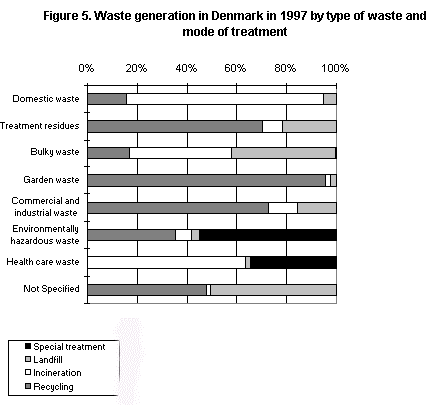
2.2.3 Treatment by sources and waste types.
Figure 4 shows total waste generation in Denmark, distributed on sources and treatment option. Figure 5 shows waste generation distributed on waste type and treatment option. Tables with detailed figures are given in Annex 1.
It is seen from Figure 4 that the rate of recycling of waste from manufacturing industries, the building and construction sector, wastewater treatment plants, and coal-fired power plants is high. Objectives for year 2000 in the Plan of Action for waste and recycling for recycling of waste from these sources are attained by a good margin. By contrast, objectives for recycling of waste from households and institutions, trade and offices are far from being attained.
Sources: ISAG reports 1995, 1996 and 1997, the Government’s Plan of Action for waste and recycling 1993-97, Danisco, Association of Danish Recycling Industries and other large scrap dealers, Elsam, Elkraft, and reports to the Danish Environmental Protection Agency on sludge from municipal wastewater treatment plants applied to farmland, and incineration in sludge incineration plants (for 1997, figures from 1996 are used).
As Figure 5 shows, treatment options also vary much from one waste type to another. 97 per cent of garden waste is recycled, in comparison to a recycling rate of only 15 per cent for domestic waste.
Sources: ISAG reports 1995, 1996 and 1997, the Government’s Plan of Action for waste and recycling 1993-97, Danisco, Association of Danish Recycling Industries and other large scrap dealers, Elsam, Elkraft, and reports to the Danish Environmental Protection Agency on sludge from municipal wastewater treatment plants applied to farmland, and incineration in sludge incineration plants (for 1997, figures from 1996 are used).
[Front page] [Contents] [Previous] [Next] [Top] |