[Front page] [Contents] [Previous] [Next] |
Waste Statistics 1997
3. Recycling
3.1 Recycling distributed on fractions
3.2 Paper and cardboard
3.3 Glass
3.4 Ferrous metals
3.5 Organic waste for composting, wood chipping, and biogasification
3.6 Tyres
3.1 Recycling distributed on fractions
Table 3 shows waste fractions that are recycled, either by reprocessing, composting, or biogasification. The table expresses quantities sent for reprocessing, composting or biogasification, and is thereby not an outline of actual output of these fractions.
| Table 3. Recycling in Denmark in 1995, 1996 and 1997 of waste from primary sources, distributed on waste fractions. In '000 tonnes. | |||
1995 |
1996 |
1997 |
|
| Oil and chemical waste | 28 |
53 |
72 |
| Paper and cardboard | 557 |
548 |
583 |
| Bottles and glass | 92 |
99 |
89 |
| Plastic | 26 |
29 |
28 |
| Food waste / other organic waste | 198 |
193 |
230 |
| Branches, leaves, grass cuttings etc. | 376 |
452 |
528 |
| Ferrous metals 1 and 4 | 983 |
899 |
1,004 |
| Automobile tyres | 9 |
8 |
20 |
| Concrete | 485 |
942 |
1,167 |
| Tiles | 75 |
93 |
125 |
| Other construction and demolition waste | 526 |
532 |
520 |
| Asphalt | 694 |
737 |
853 |
| Wood | 10 |
15 |
21 |
| Soil and stone | 344 |
391 |
353 |
| Other recyclables | 108 |
166 |
240 |
| Fly ash and slag from coal-fired power plants2 | 1,276 |
1,213 |
911 |
| Fly ash and slag from other sources except waste incineration plants | 3 |
2 |
2 |
| Flue-gas cleaning products (gypsum, TASP, sulphuric acid) from coal-fired power plants2 | 288 |
416 |
394 |
| Sludge from municipal wastewater treatment plants for recovery on farmland, composting and biogasification3 | 918 |
918 |
870 |
| Sludge from other sources | 50 |
81 |
40 |
| Total | 7,046 |
7,787 |
8,050 |
Sources: ISAG reports for 1995, 1996 and 1997, (1) Association of Danish Recycling Industries and other large scrap dealers, (2) Elsam, Elkraft, (3) reports to the Environmental Protection Agency on sludge applied to farmland (for 1997, figures from 1996 have been used). (4) Correction for ferrous metals removed from waste incineration plants (15,100 tonnes) has been made to avoid double counting. Some of the collective terms such as "Other recyclable waste, "Other construction and demolition waste" and "Soil and stone" may contribute - after sorting has been completed - to additional quantities of items such as tiles, wood, etc.
The most significant amounts are found for waste fractions relating to industry (ferrous metals), building and construction activities (for example concrete and asphalt), coal-fired power plants (fly ash, gypsum, and slag), and wastewater treatment plants (sludge). However, waste fractions such as glass, paper and cardboard, branches and leaves etc. also account for large amounts. A large proportion of this waste is generated in households.
Amounts of recycled fly ash, slag, and flue gas cleaning products from coal-fired power plants decreased considerably from 1996 to 1997. This is attributable to the decrease in waste amounts from coal-fired power plants as a consequence of reduced exports of power to Norway and Sweden.
Amounts of recycled sludge from municipal wastewater plants also decreased. In 1997, amounts of sludge were 34,000 tonnes larger than in 1996, and incineration and landfilling of sludge increased by 5 and 1 per cent respectively. It seems that sludge recovery by application to farmland has decreased compared to previous years.
3.2 Paper and cardboard.
Consumption of virgin paper, paper collected for recycling, and exports of waste paper are shown in Table 4.
| Table 4. Consumption and recycling of paper and cardboard in 1995, 1996 and 1997. In '000 tonnes. | |||
1995 |
1996 |
1997 |
|
| Consumption of virgin paper1 | 1,208 |
1,181 |
1,349 |
| Waste paper collected2 | 557 |
548 |
583 |
| Waste paper collected as a percentage of virgin paper consumption | 46 |
46 |
43 |
| Danish waste paper sent to Danish paper mills2 | 332 |
318 |
335 |
| Net exports of waste paper3 | 150 |
220 |
204 |
Sources: (1) Rendan’s material stream analysis of waste paper and Statistics Denmark, (2) ISAG reports 1995, 1996, and 1997, (3) Statistics Denmark. The discrepancy between waste paper collected, and Danish waste paper sent to Danish paper mills + net export, may be due to stock enlargement, and it may be a consequence of the use of different statistical sources.
From 1996 to 1997, a significant increase took place in the consumption of virgin paper. In 1997, paper consumption amounted to 259 kg/capita, whereas 112 kg/capita were collected separately. In 1996, corresponding figures were a paper consumption of 224 kg/capita and average collection of 104 kg/capita.
As amounts of waste paper collected did not increase by a similar rate as paper consumption, this means that the rate of collection of waste paper decreased from 46 per cent in 1996 to 43 per cent in 1997.
In 1997, Denmark had a net export of 204,000 tonnes of waste paper, which covers imports of waste paper of 106,000 tonnes and exports of 310,000 tonnes.
Sources of waste paper collected are stated in Table 5. Almost identical amounts of waste paper are collected from the three sources: manufacturing industry, households, and institutions, trade and offices. After a decrease from 1995 to 1996 of 7 per cent, amounts of waste paper from households increased by 14 per cent from 1996 to 1997. Amounts of waste paper from institutions, trade and offices increased by 3 per cent from 1996 to 1997. However, total amounts collected decreased by 1.5 per cent from 1995 to 1997. Amounts of paper collected for recycling from manufacturing enterprises increased by 3 per cent from 1996 to 1997.
| Table 5. Recycling of paper and cardboard by source in 1995, 1996 and 1997. Stated in tonnes. | |||
1995 |
1996 |
1997 |
|
| Households | 173,333 |
160,469 |
183,116 |
| Institutions, trade and offices | 180,647 |
173,289 |
178,158 |
| Manufacturing industry | 203,054 |
214,015 |
220,935 |
| Building and construction | 172 |
163 |
234 |
| Wastewater treatment plants | 2 |
1 |
|
| Not reported | 213 |
731 |
|
| Total | 557,205 |
548,151 |
583,174 |
Source: ISAG reports 1995, 1996 and 1997.
3.3 Glass
According to ISAG reports, recycling of bottles and glass from primary sources amounted to 89,000 tonnes in 1997. This is a decrease of 10,000 tonnes compared to 1996. By only including waste from primary sources, however, a complete picture of total material streams is not obtained.
As a consequence, the following description of total recycling of bottles and glass is based on the Rendan material stream analyses for glass, which are more detailed than the ISAG statement of glass recycling.
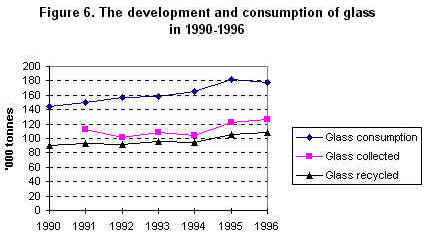
Consumption of glass packaging has been increasing throughout the 1990s, cf. Figure 6, though with a slight decrease in consumption in 1996 compared to 1995 (1996: 178,348 tonnes and 1995: 181,265 tonnes). The decrease covers a decrease in the consumption of jars of a good 8,000 tonnes, and an increase in the consumption of bottles for wine and spirits of 3,600 tonnes.
Collection and recycling of glass have also been increasing throughout the 1990s. In 1996, 126,109 tonnes of glass were collected, corresponding to 71 per cent of total consumption. Correspondingly, the rate of recycling increased by 3 percentage points from 61 per cent in 1995 to 64 per cent in 1996.
Bottles for beer and soft drinks manufactured for reuse are not included in this statement. Refillable glass bottles, on average, make 35 trips. If these bottles were manufactured as single-use bottles, it would give an increase in waste glass of around 350,000 tonnes.
Source: Rendan material stream analysis for glass, bottles, and cullets, 1996.
3.4 Ferrous metals
Table 6 shows amounts of collected ferrous scrap, distributed on receivers. Total potential of ferrous scrap is not known precisely. Recycling industries normally estimate a recycling rate in excess of 90 per cent for ferrous scrap.
According to ISAG reports, Danish foundries and the Danish Steel Works imported 210,000 tonnes in 1997, whereas scrap dealers imported 78,000 tonnes. This adds up to total imports of 288,000 tonnes in 1997, or 10,000 tonnes less than in 1996.
| Table 6. Recycling of ferrous scrap in 1996 and 1997. In '000 tonnes. | ||
1996 |
1997 |
|
I Danish ferrous scrap sent to foundries and the Danish Steel Works1 |
356 |
406 |
| II Ferrous scrap exported by scrap dealers2 | 612 |
684 |
| III Ferrous scrap imported by scrap dealers 2 | 35 |
78 |
| Total recycling of Danish ferrous scrap (I+II-III) | 933 |
1012 |
| Ferrous scrap imported by foundries and the Danish Steel Works1 | 263 |
210 |
Sources: (1) ISAG reports 1996 and 1997, (2) Information from the Association of Danish Recycling Industries and other large scrap dealers. The statement used in table 5 for recycling of ferrous scrap is slightly different from the one used in Table 3. For example, the correction for ferrous scrap removed from waste incineration plants (1996: 15,100, 1997: 19,774) has not been made in Table 5, as this table shows the total balance for ferrous metals.
3.5 Organic waste for composting, wood chipping, and biogasification.
Organic waste amounts delivered to composting, wood chipping, and biogasification are shown in Table 7.
The table shows, similar to developments from 1995 to 1996, that there was a significant increase from 1996 to 1997 in garden waste amounts (branches, leaves etc.) for composting. This indicates that municipal collection and bring schemes for garden waste are becoming more widespread and extensively used.
| Table 7. Amounts of organic waste 1995-97 delivered to composting, wood chipping, and biogasification, and removal from the plants of compost, wood chips, and screenings. Stated in '000 tonnes | |||
| Material | 1995 |
1996 |
1997 |
| Branches, leaves etc. for composting/wood chipping | 376 |
452 |
528 |
| Organic domestic waste for composting | 34 |
36 |
46 |
| Organic domestic waste for biogasification | 5 |
10 |
1 |
| Other organic waste for composting | 6 |
2 |
1 |
| Other organic waste for biogasificaiton | 120 |
111 |
139 |
| Other organic waste for fodder production | 32 |
34 |
42 |
| Sludge for composting | 7 |
6 |
7 |
| Sludge for biogasification | 59 |
92 |
52 |
| Total | 639 |
743 |
817 |
| Removal from plants of bark/wood chips | 49 |
34 |
44 |
| Removal from plants of compost | 102 |
162 |
214 |
| Removal from plants of screenings | 5 |
19 |
13 |
Source: Calculations and estimates based on ISAG reports 1995, 1996 and 1997. ISAG reports do not include information on the quantity of biogas generated.
Amounts of organic domestic waste for composting, and other organic waste for biogasification also increased from 1996 to 1997. By contrast, there was a drop in amounts of organic domestic waste treated by biogasification. This is mainly attributable to the closing-down of the biogas plant Nordsj�llands Biogasanl�g located in Elsinore.
Quantities of bark/wood chips and compost removed from the plants do not reflect the quantities generated. However, this quantity should be considered as reflecting the quantity sold or delivered free.
Amounts of compost removed from the plant increased significantly: from 162,000 tonnes in 1996 to 214,000 tonnes in 1997.
3.6 Tyres
In 1995, the Minister for Environment and Energy entered an agreement with a number of organisations, on a take-back scheme for used tyres from cars, vans, and motorcycles. The purpose of the agreement is to ensure collection and recovery of used tyres in Denmark. Landfilling is avoided and resource recovery ensured, whereby material recovery is prioritised to energy recovery.
The scheme started 1st April 1995 and is financed by a fee on tyres comprised by the agreement and marketed in Denmark. The fee amounts to DKK 8 per tyre.
According to the agreement, the objective was a take-back rate of 60 per cent in 1995. The objective for 1997 onwards is 80 per cent. Objectives have been more than attained in 1997.
| Table 8. Take-back of car, van, and motorcycle tyres in 2nd half of 1995, and in 1996 and 1997 | 2nd half 1995 |
1996 |
1997 |
Tonnes |
Tonnes |
Tonnes |
|
| Used tyres covered by the take-back scheme | 8,725 |
16,705 |
18,405 |
| Collected tyres | 7,600 |
12,670 |
17,229 |
Of which for |
|||
| Retreading or continued use | 3,300 |
5,477 |
4,581 |
| Temporary storage | 955 |
1.133 |
0 |
| Rubber powder production | 3,345 |
6,060 |
12,648 |
| Collection in % of tyres covered by the scheme | 87.1 |
75.8 |
93.6 |
Source: Reports from the Danish Tyre Trade Environmental Foundation for 1995, 1996, and 1997. 2nd half of 1995 includes 1,000 tonnes collected in the first half of 1995, thereby increasing the collection rate.
[Front page] [Contents] [Previous] [Next] [Top] |