| Front page | | Contents | | Previous | | Next |
Systems Analysis of Organic Waste Management in Denmark
Appendix A
Environmental impact assessment
Global Warming Potential
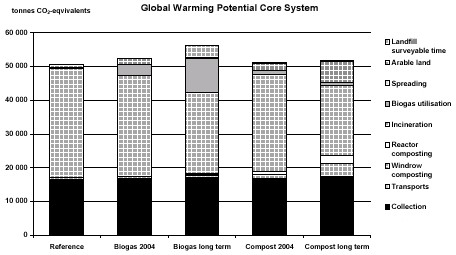
Figure A1.
Acidification potentials (AP) for core system.
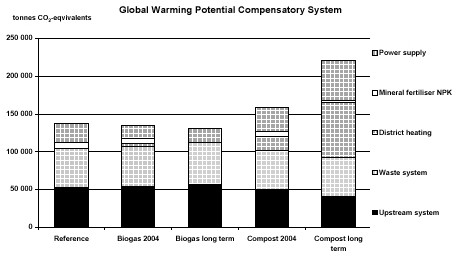
Figure A2.
Global warming potentials (GWP) for compensatory system.
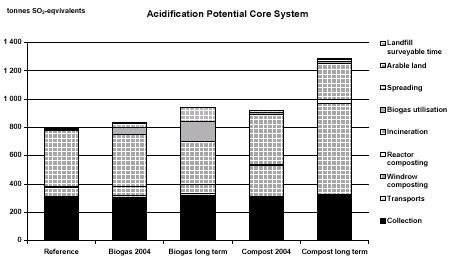
Figure A3.
Acidification potentials (AP) for core system.
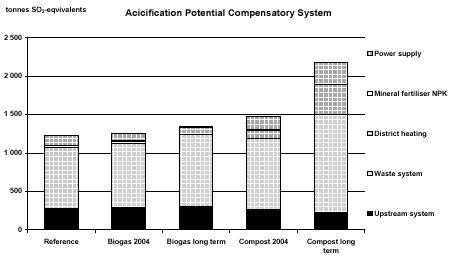
Figure A4.
Acidification potentials (AP) for compensatory system.
Eutrophication Potential
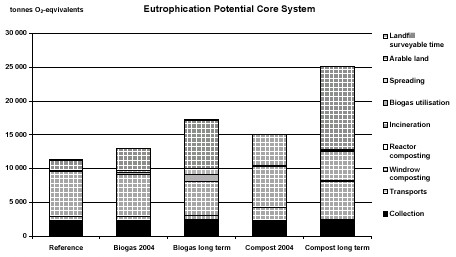
Figure A5.
Eutrophication potentials (EP) for core system.
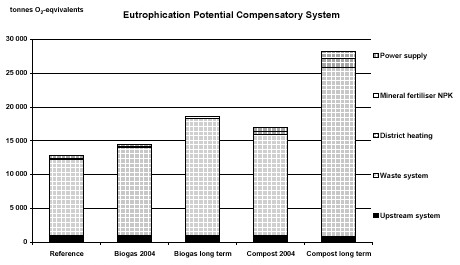
Figure A6.
Eutrophication potentials (EP) for compensatory system.
Formation of Photochemical Oxidants
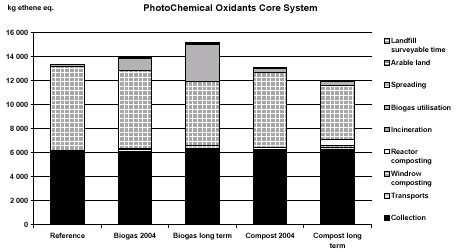
Figure A7.
Photochemical oxidants (VOC-NOx) for core and compensatory system.
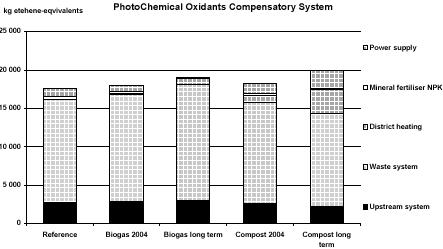
Figure A8.
Photochemical oxidants (VOC-NOx) for core and compensatory system.
Consumption of primary energy carriers
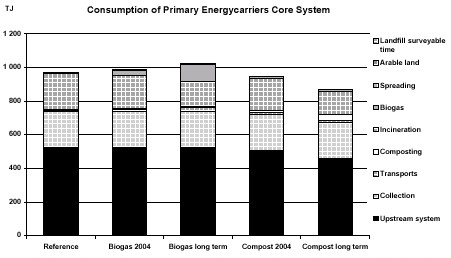
Figure A9.
Consumption of primary energy carriers in the waste system, distributed to different processes.
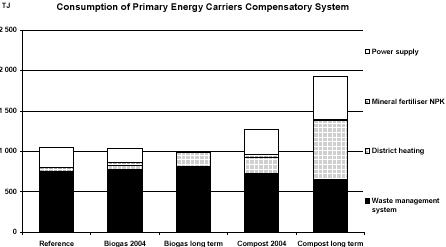
Figure A10.
Consumption of primary energy carriers in the total system, distributed amongst processes.
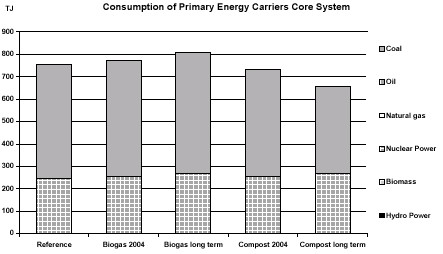
Figure A11.
Use of primary energy carriers in the core system.
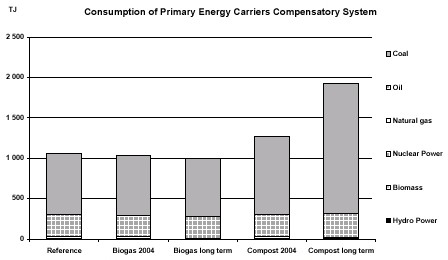
Figure A12.
Use of primary energy carriers in the compensatory system.
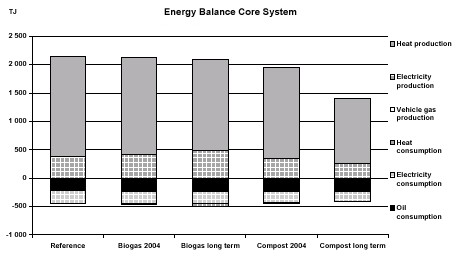
Figure A13.
Energy balance for the waste system.
| Front page | | Contents | | Previous | | Next | | Top |
|