Consumers Opportunities of and Interest in Purchasing Green Electronic Products
2 Results of questionnaire2.1 Objective of questionnaire2.2 Main conclusions of questionnaire 2.3 Who responded to the questionnaire? 2.4 Purchase of mobile phones 2.4.1 Information sources for purchase of mobile phones 2.4.2 What is important when consumers buy mobile phones? 2.4.3 The environment and mobile phones - consumer knowledge and motivation 2.5 Purchase of stereo/television and computer equipment 2.5.1 Information sources for purchase of stereo/television and computer equipment 2.5.2 What matters to consumer when they buy stereo/television and computer equipment? 2.5.3 Environmental aspects of stereo/television and computer equipment - consumer awareness and motivation 2.6 General consumer behaviour 2.6.1 Attitudes to “green” consumption 2.7 Awareness of eco-labels 2.8 Consumer wishes for environmental information on electronic products 2.1 Objective of questionnaireThe questionnaire aimed at
The consumer questionnaire was divided into two parts. One part concerned consumer experience in purchasing mobile phones. Another part dealt with the purchase of stereo/television equipment and computer equipment. Finally, the questionnaire contained a range of questions on consumer attitudes to green consumption in general, on consumers’ purchasing behaviour in relation to eco-labelled/organic products and on their motivation for making an extra effort to obtain green products. The questionnaire was forwarded to 1,000 consumers that Gallup was already in contact with via its omnibus surveys. The consumers receiving the questionnaire had defined themselves as the person in the household responsible for purchasing electronic products. After three weeks the consumers who had not submitted the questionnaire received a reminder. The response rate ended up at 70%. 2.2 Main conclusions of questionnaireThe questionnaire respondents are the environment-positive consumers. Compared to other surveys, the respondents know a great deal about eco-labels and are keen to make environmental considerations. The questionnaire analysis must be interpreted in this light. Based on the consumer survey, we conclude that a consumer potential exists for green demand of electronic products, but the demand will not arise on its own. It requires activities targeted at consumers, retailers and producers alike. The survey proves that consumers are very willing to take environmental considerations in electronic products purchasing, but lack knowledge on the environmental impact of electronic products. Fifty percent of consumers are unaware of whether PCs or stereo/television equipment cause environmental problems. About 33% reply no to the question of whether environmental problems arise in connection with production, use or disposal of electronic products. Only every fifth consumer believes that production, use or disposal of mobile phones is associated with environmental problems. Expressed in percentage, a good number of consumers (about 25-40%) put weight on environmental aspects in electronic products purchasing. Greatest importance is attached to energy consumption, followed by the content of lead and other heavy metals. As to heavy metals, the result is probably more an expression of consumers’ wish to pay attention to such conditions rather than an expression of an articulated demand in the purchasing situation. Experience from other consumer surveys shows that consumers often reply more positively than they actually act. In this context, the positive aspect is that consumers feel they would like to avoid heavy metals. Translating this feeling into active action presupposes various conditions and measures. Another explanation could be that the retailer representatives interviewed are too removed from customers and shop assistants. In their position, they probably fail to pick up on consumers’ questions on environmental and energy-related subjects. When environmental considerations cost In addition to making environmental allowances, 33% of consumers are also willing to pay extra for a product taking environmental considerations. However, the answer is free of charge in the questionnaire, but evidences an attitude of being prepared to support the less polluting products. One-third of consumers will not pay more for environmental considerations. However, they would probably be interested in information on energy consumption, as that aspect would not necessarily cost more. Actually, it could make the product cheaper than more energy-consuming products. Requirements to environmental information Consumers want environmental information on products to be simple and clear, comparable from product to product and verified by the authorities. The questionnaire did not ask directly about various labelling schemes; in terms of methodology this proved impossible to do properly through a questionnaire. The focus group interviews with consumers elaborated on the subject. Previous discussions have focused on the time Ecolabelling Denmark spends on granting an eco-label and the special problem in the electronic products sector of rapid product development. In that context, it is interesting to note how consumers weight the importance of obtaining the latest model. Figures show that about one-third of consumers attach great or very great importance to obtaining the latest model. The criterion “latest model” is not a low-ranking parameter compared to the other purchasing criteria listed. Consumers’ search for information Consumers’ primary information sources are adverts, shops, family and friends and newspapers. If we want environmental information on electronic products to reach consumers, it would be obvious to use shops and newspapers. How consumers seek information in shops and from shop assistants is especially interesting. Purchase of electronic products often necessitates service from a shop assistant, and this represents a key point of information exchange. If shop assistants’ qualifications are enhanced and they have the correct information and tools at their disposal, they are an obvious channel for communicating environmental matters to consumers. About 10-15% of consumers use consumer magazines, e.g. “Tænk og Test”, which opens a channel for communicating results on product environmental qualities. A similar number uses the Internet to find information, but young people are underrepresented in the survey, which may impact on this figure. Survey consumer perception The questionnaire puts rational questions to the consumers on their behaviour in buying electronic products. The questionnaire aims to determine consumer behaviour through various concrete questions on their behaviour relating to their latest purchases of electronic products. Likewise, the questionnaire seeks to ascertain consumers’ environmental awareness through a range of questions on their attitudes. Despite these aspects, the contours of a very aware consumer emerge from this study. This contrasts with the fact that consumer choice is often characterised by irrational and arbitrary behaviour. More factors than the questionnaire could reveal determine consumer behaviour, and we are aware that this should figure in the interpretation of consumer behaviour. As this is often a basic problem in a questionnaire survey, the survey design included two consumer focus groups, one in Copenhagen and one in Herning. Experience showed that discussions in the focus group challenged the rational consumer picture, replacing it with a much less politically correct and rational consumer behaviour. The conflict areas of green consumption were the subjects covered, and the groups discussed motives for an environmentally aware consumption pattern. 2.3 Who responded to the questionnaire?Of the 1,000 questionnaires forwarded, we received 701 replies. 427 of these were filled in by men (61%) and 274 by women (39%). The person responsible for the household purchase of electronic products was asked to complete the questionnaire. The figures reflect the gender difference related to purchase of electronic products. Other surveys show that purchase of electronic products is a male-dominated area but also that recent years have seen women making headway in the area3. Distribution on age and sex appears from the table below. Unfortunately, only 5 of the very young consumers aged 15-24 completed the questionnaire. This is probably because we asked the person responsible for the household purchase of electronic products to fill in the questionnaire. This means that only the young people having left home replied. In the subsequent analysis, readers need to keep in mind that it primarily covers consumers over 24. 2.4 Purchase of mobile phonesHave you purchased a mobile phone within the last 3-4 years? Almost three out of four consumers have purchased a mobile phone in the last 3-4 years - most of them men, 321 against 190 women (this ratio is not included in the table). 2.4.1 Information sources for purchase of mobile phonesThe respondents replying affirmatively to having purchased a mobile phone within the last 3-4 years subsequently answered a range of more detailed questions on the purchase. The results are based on 472 answers. Where did you find information on the mobile phone before you bought it? Consumers’ primary information sources for mobile phone purchase are:
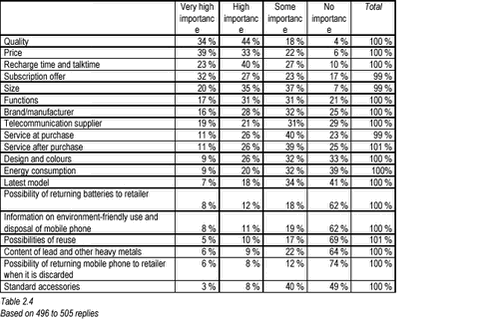
A large share does not seek information on mobile phones before making the purchase. When the figures are cross-analysed with gender difference, no major difference emerges. To some extent, women use shops, friends and family slightly more as information sources, while men primarily account for the use of the Internet and magazines. 2.4.2 What is important when consumers buy mobile phones?The project aimed to determine the status of the environment when consumers purchase mobile phones. The environment is up against several competing parameters in purchasing situations, and we therefore asked about a wide range of purchasing criteria, including the environment. The criteria are listed in order of their importance to consumers. The greatest importance appears by totalling “very high importance” and “high importance”. How much importance did you attach to the following when you chose mobile phone? In interpreting the significance consumers attach to the various parameters, it is more important to compare them than to consider the actual percentages for each parameter. Price and quality are the two top priorities for purchase decisions. Energy is the environmental criterion carrying greatest importance to consumers. Perhaps this ties in with the very high priority recharge time and talktime take on consumers’ lists (range third), and energy consumption is seen as related to those conditions. The question on energy consumption may be difficult to answer in relation to mobile phones, as they do not directly consume energy, but rather via battery recharge. Consumers give environment-related issues the lowest priority of all criteria (except for “standard accessories”). Expressed in percentage, a good number of consumers (about 25-40%) give weight to environmental aspects in electronic products purchasing. The result is probably more an expression of consumers’ wish to pay attention to such conditions rather than an expression of an articulated demand in the purchasing situation. Experience from other consumer surveys shows that consumers often reply more positively than they actually act. In this context, the positive aspect is that consumers feel they would like to avoid heavy metals. Translating this feeling into active action presupposes various conditions and measures.2.4.3 The environment and mobile phones - consumer knowledge and motivationAre you aware of environmental problems in relation to production, use or disposal of mobile phones? More than 50% of consumers answer “don’t know” to the general question on environmental problems and mobile phones. The reply indicates a great need for information on the environmental impact of electronic products. More women than men answer “don’t know”, and more men than women do not associate mobile phones with environmental problems. Overall, the numbers of consumers associating no environmental problems with mobile phones equal the numbers of consumers associating environmental problems with mobile phones. In the group of women, twice as many tie environmental problems to mobile phones as those that do not. If information on the environmental load of mobile phones were available, would you include it in your considerations when you buy mobile phones in the future? This question divides the consumers into three almost equal groups.
Women are more inclined to pay for environmental considerations than men. More men than women answer that it would depend on the price difference. Chapter 4 elaborates on the question of consumers’ willingness to pay more. 2.5 Purchase of stereo/television and computer equipmentWhich of the following types of stereo/television equipment did you buy within the last 3-4 years?
Many consumers purchased more than one of the products within the last 3-4 years. On average, each consumer purchased 2.2. of the above products. Thirteen percent did not buy one of the above products in the relevant period. Consequently, they did not answer the following questions on purchase and environmental considerations. Nothing definite can be said about the age composition of this group. It consists of very young, middle-aged and older consumers, but with a slight overrepresentation of the very young and the old. Which of the following types of IT equipment did you buy within the last 3-4 years? More than 50% of consumers purchased a PC within the last 3-4 years. On average, the consumers bought 1.7 of the above products in the period. The following text describes the stereo/television and computer results collectively, as they share a range of common characteristics. Generally, the environmental problems are the same, and the products are sold in the same places. Thus, the following answers cover both stereo/television and computer equipment. Consumers were asked to state which product they bought most recently and then on the basis of this experience answer the questions. The most recent purchase distributes as follows: 2.5.1 Information sources for purchase of stereo/television and computer equipmentWhere did you find information on the product before you bought it? The question has a low response rate, probably because the consumers who did not seek information before the purchase skipped the question rather than respond negatively to all the options. On that assumption, about 20% of the consumers do not seek information about the product before purchasing. Consumers’ primary information sources in purchase of stereo/television and computer equipment are:
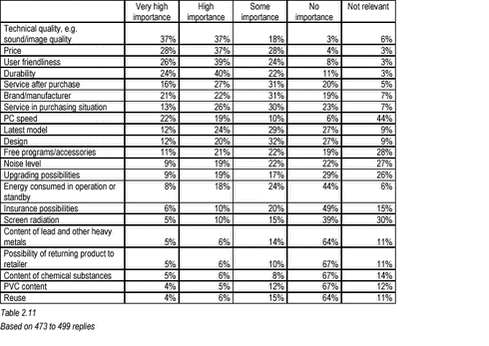
The consumers do not use the Internet to any great extent to seek information on prices and products. The figures might look different, if more young people had completed the questionnaire. 2.5.2 What matters to consumer when they buy stereo/television and computer equipment?How much importance did you attach to the following when you bought stereo/television or computer equipment? The criteria are listed in order of their importance to consumers. The highest importance was established by totalling “very high importance” and “high importance”. As mentioned in the section on mobile phones, the survey was designed to list a wide range of purchasing criteria, so that the consumers could visualise the many other considerations with which requirements have to interact in a purchasing situation. The result shows that consumers give heavy weight to technical and functional requirements for products. The consumers attach lowest importance to environmental and energy aspects. As to the environment and energy, consumers are most interested in energy. Half the respondents (50%) reply that energy consumption is important in purchasing situations. The survey was made just before the launch of the second round of an intensive campaign for the Energy Arrow in Denmark. In contrast, 44% reply that energy has no importance. The figures could be seen as an expression of insufficient product information on energy consumption, which would make it difficult for consumers to make energy consumption part of their decision basis when they purchase new electronic products. As mentioned for mobile phones, the list should be interpreted in a relative context and not on the basis of the exact percentages. The differing weights consumers give requirements should be seen as an expression of the options available to consider in a purchasing situation. If neither the manufacturer nor the retailer provides information on chemical substances, consumers will have a hard time giving such aspects weight. Thus, the list of consumer-weighted requirements is largely identical to the aspects on which retailers compete and communicate. Consumers give relatively high weight to the possibilities of upgrading. Seen from an environmental angle, this is positive, as it prolongs the PC lifetime. 2.5.3 Environmental aspects of stereo/television and computer equipment - consumer awareness and motivationAre you aware of environmental problems in relation to production, use or disposal of stereo/television or computer equipment? About 50% of consumers are unaware of whether environmental problems exist in relation to the production, use and disposal of stereo/television or computer equipment. In round figures, the remaining 50% distribute between respondents believing problems exist and respondents believing no problems exist. More women than men believe that environmental problems exist (based on percentages). Compared with mobile phones, a few more consumers are aware that stereo/television and computer equipment occasion environmental problems. If information on the environmental load of stereo/television and computer equipment were available, would you include it in your considerations when you buy equipment in the future?
What characterised consumers prepared to pay extra for environmental considerations? Age As the survey only includes three replies to this question from the age group 15-24 years, the results are too insubstantial for conclusions. The other age groups show an even distribution in willingness to pay more, although slightly more older people tend to be willing to pay for environmental considerations. Tabel 2.14 Age distribution of consumers willing to pay more for environmental considerations.
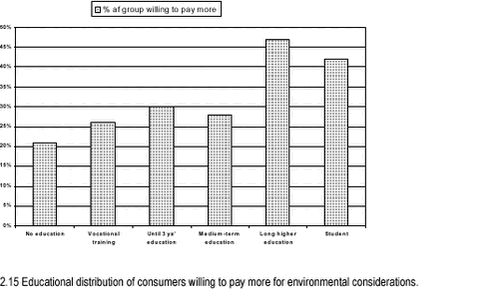
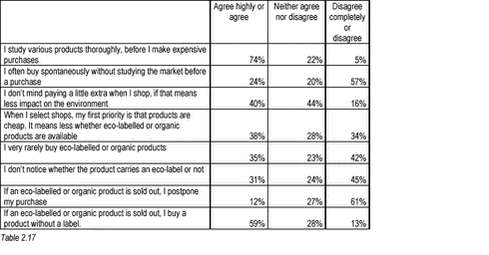
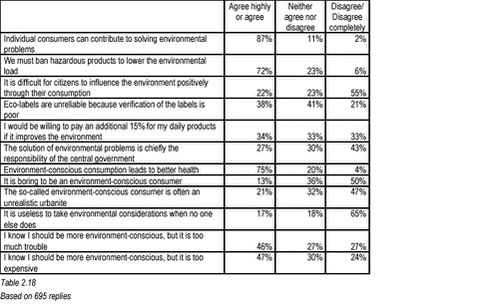
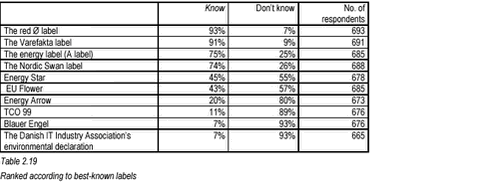
Education Income The segmentation analysis in chapter 4 discusses the relation between financial latitude and consumers’ general environmental awareness more closely. The result shows that the greener consumers are, the more financial latitude exists in the household. 2.6 General consumer behaviourTo characterise consumers in the context of their general consumer behaviour, the questionnaire contains a few general consumer questions. In addition to being used to segmenting consumers, the most interesting questions will be summarised here. The questions relate not only to electronic products, but also to purchase of expensive products priced above DKK 1,000. What is the importance of these aspects, when you purchase expensive products? Click to see html-version of: Tabel 2.16 All five statements relate to an environmental, energy or health dimension that may impact on the purchase of electronic products. The answers also reveal that consumers generally believe that they are very environmentally aware when they purchase expensive products. The answers further reveal that finances, health and energy mean more to consumers than the environment does. How much do you agree with the following statement about your behaviour as consumer? The questions are included in the questionnaire to draw a general picture of consumer behaviour and to obtain an impression of how much environmental considerations mean to them. The emergent picture of consumer behaviour shows that 75% of the consumers see themselves as thorough in seeking information before they buy expensive products. Since the questionnaire does not define the contents of “thorough”, the figure is an expression of the consumers’ view of their own thoroughness. It may cover use of test results as well as browsing in shops immediately prior to the purchase. Whatever it covers, the consumers’ perception of their own thoroughness paves the way for information communication on the environment and electronic products. In general, 40% are willing to pay a little extra for environmental considerations. This figure is slightly higher than the figure for those answering affirmatively to the same question in the specific context of electronic products, i.e. 32%. About one-third of consumers primarily choose shops on the basis of product price. One-third does not know, and one-third wants the shop to offer eco-labelled products. About one-third of consumers rarely or never buy eco-labelled or organic products. Between 33% and 50% of consumers often buy eco-labelled or organic products. Twelve percent of consumers are prepared to wait for a product to obtain a green variant. Thirteen percent of the respondents are also willing to go a little further to obtain an eco-labelled product. They represent the hard core of green consumers who are prepared to find green products in another shop if they are sold out. The overall perception of respondents’ behaviour is that many of them are conscious or green consumers. There is widespread willingness to pay more for products and many have experience in purchasing eco-labelled or organic products. Either the greenest consumers returned the questionnaire or many of the respondents gave “free” answers. 2.6.1 Attitudes to “green” consumptionThe following questions are to establish general consumer attitudes to environment-conscious consumption and consumers’ views on their influence. A number of the questions spring from statements on consumption and the environment encountered by consumer researchers or others in consumer interviews. Several statements are directly derived from Bente Halkier’s typologisation of young consumers and their statements on the environment in everyday life4. How much do you agree with the following statements on the environment and consumption? Belief in consumer influence Regulatory measures such as bans of environmentally hazardous products also garner major support, even though the question is actually a counter-question to consumer-based efforts (72% are in favour of banning hazardous products). Forty-three percent do not believe that environmental problems are primarily a central government responsibility, and 65% disagree on the statement that it is no use, unless others join in. Eco-labels The next sections take a closer look at attitudes on eco-labels. Health The will to do more In general, about 33% of consumers ticked off neither agree or disagree in answer to many of the questions. This is understandable, as the questions are complex and difficult to answer with a single tick. However, it falls outside the scope of this project to go into more detail on the questions. Due to their complexity, the results should be interpreted with care. The questions behind the consumers’ replies can be seen from many different angles. 2.7 Awareness of eco-labelsWhich of the following labelling schemes are you familiar with? Next to each question, the energy or eco-label was shown (in black/white graphics) For several labels, awareness registers higher than in other similar surveys. Other awareness surveys show that 41% of consumers know the Swan, and 16% the Flower6. The surveys are not directly comparable, as Ecolabelling Denmark/the Danish EPA test for qualified awareness, i.e. consumers must identify the label as an eco-label without aid. Thus, there is a significant difference in knowing a label and recognising it (aided recall). This study did not test for qualified awareness, but only consumers’ recognition of labels, aided recall. The red organic label for foods and the Varefakta label are the two labels consumers are most familiar with (93% and 91%). In third place lies the A label for household appliances, etc. The high awareness can be explained by the scheme being mandatory, so that all appliances, etc., carry a label. Consumers largely become familiar with the labels by seeing them in purchasing situations. Thus, there is a wide disparity between consumer awareness of the Swan (74%) and the Flower (43%) even though both labels have been promoted in various information campaigns. Every fifth consumer in this study recognises the Energy Arrow Consumers are relatively familiar with the Energy Star. This is probably because the label is widely used on PC displays, both externally and in the start phase of the PC, and because the label has been on the market in Denmark for almost 10 years. In contrast, far fewer are familiar with the TCO label, even though it is on almost all displays. This is probably because it has not been communicated to the Danish market. 2.8 Consumer wishes for environmental information on electronic products
Consumers generally want a labelling scheme to meet many different and sometimes contradictory requirements. Environmental information should both be simple and easy to understand, as well as describe all environmental aspects. However, the requirement that all environmental aspects should be described gets the lowest rating. There is very unequivocal support for having the labels verified by authorities. It is difficult to add nuances and perspectives to questions on consumer requirements for environmental information, as all requirements entail consequences that do not appear from the questionnaire. A disadvantage of an eco-labelled IT product may be that the latest product on the market does not carry the label, because the labelling procedure takes time. To add details to consumers’ requirements for eco-labels, two focus group meetings with consumers were held to discuss various experience with and requirements for labelling schemes. The results of the focus group meetings appear in chapter 4. ____________________________________________________________ |


