Consumers Opportunities of and Interest in Purchasing Green Electronic Products
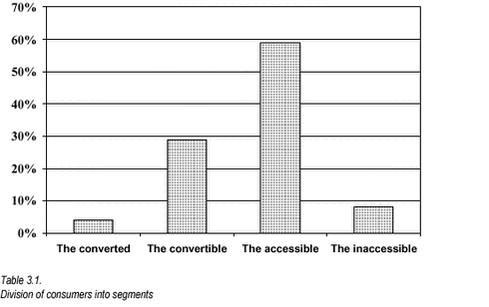
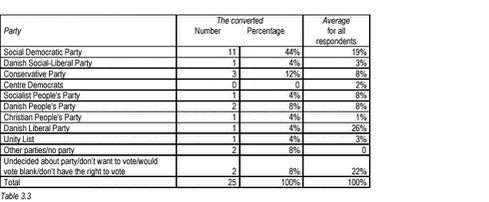
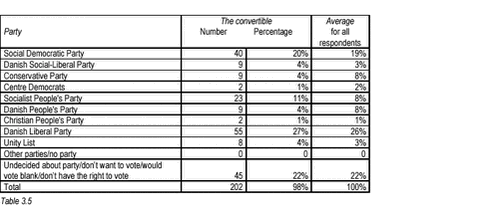
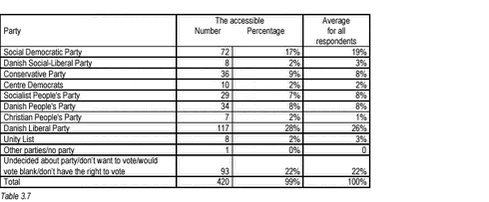
3 Four consumer types3.1 Segmenting consumers3.2 Strategic use of segmenting analysis 3.2.1 Possible follow-up on this study 3.3 What characterises the segments? 3.3.1 The converted 3.3.2 The convertible 3.3.3 The accessible 3.3.4 The inaccessible 3.1 Segmenting consumersThe following consumer segmenting is inspired by Gallup’s experience with the Conversion Model, which is able to form a picture of consumers’ brand loyalty. The model operates with customers and non-customers of a certain brand or retailer. In the group of customers or “users”, consumers are classified according to commitment - i.e. their degrees of allegiance to a given brand. In this study, the challenge lay in translating the model into a description of consumer loyalty to the environment instead of to a given brand. In an attempt to divide consumers according to environmental loyalty, they were separated into four groups. The converted - the consumers who are already positive to the environment, both in terms of electronic products and other consumer areas. The convertible - the consumers who are, just under the surface, positive to the environmental aspect of electronic products. The accessible - the consumers who are less environmentally positive than the convertibles, but who may with some persuasion become green consumers of electronic products. The inaccessible - the consumers who are less positive to the environment and where nothing indicates that this will change, neither for electronic products nor for other consumer areas. The respondents distribute on the segments as follows: 3.2 Strategic use of segmenting analysisThe segments are interesting for an information strategy. If we want to launch a positive spiral of sale and development of green products, consumers have to demand green electronic products. The survey shows that consumers lack knowledge on the environmental impacts of electronic products. Information to consumers could be targeted at the segments. The two middle segments, especially, can be shifted in a more environmentally positive direction. The converted are already convinced green consumers. Most of all, they need producers to use already available eco-labels and make green products visible. They are then ready to buy the products and already do so as far as possible. The small number of converted consumers (4%) should be interpreted in the light of the opportunities producers and retailers offer consumers to be environmentally conscious. The convertible form an obvious group to stimulate in demanding green electronic products. They already buy green in other product areas and do not mind paying a little extra for the products. They are also prepared to become green electronic products consumers. As potential consumers of green electronic products, they need information on the environmental impact of electronic products and on the environmental requirements that are most relevant for the consumer to pose. After the converted, this group is the most aware of energy and eco-labels. Eighty-five percent of the convertible are familiar with the Swan label, and 22% with the Energy Arrow. Overall, they trust the eco-labels. Almost half (48%) are prepared to take environmental considerations, even though the product becomes more expensive. Another 32% are willing to make environmental considerations if the product costs the same. Likewise, the accessible are a key target for information. The members of this group can be influenced to become greener in their product choices, but they may also become less green and thus inaccessible if they are not positively influenced. Their attitudes are predominantly positive to environmental considerations, but they are not as willing to pay for it as the two previous groups. Even so, 26% of the group are prepared to pay more for environmental considerations, and 34% will take environmental considerations if the price is the same. Energy-related environmental requirements entailing financial benefits to consumers would probably appeal to this group. This group believes less in consumers’ possibilities of making a difference, and perceives the central government to be primarily responsible for reducing environmental problems. The accessible group’s inferior awareness of the environment and eco-labels is poorer than the convertible’s, but even so 71% of the segment know the Swan label. The Energy Arrow is familiar to only half as many as the converted (19%). The group has less confidence in eco-labels than the two previous segments; 42% of the group rate the eco-labels as unreliable. The inaccessible do not give weight to green purchasing, neither in purchasing electronic products nor other products. They are unwilling to pay more for less polluting products, and everyone in this group sees the solution of environmental problems as the central government’s responsibility. Only 10% trust the eco-labels, and this group’s awareness of eco-labels is the lowest of the four segments. They are a group of consumers needing more than information to change their behaviour. 3.2.1 Possible follow-up on this studyFollowing an environmental initiative or campaign focusing on electronic products, it would be interesting to see if the segments have shifted, for instance, whether consumers’ brand awareness has grown or whether their perception of environmental problems relating to electronic products has changed. A few central questions could be picked out and repeated, thus providing an indication of whether consumers have shifted. 3.3 What characterises the segments?Generally, the four segments show that the longer the education the respondents in the segments have, the more positive their attitudes to environmental aspects are. This also applies to household incomes. The higher the income, the more environmentally positive. A certain difference can be traced in the segments’ political affiliations. On the other hand, the types of dwelling are largely the same in the four segments. Nor do the segments’ distribution between town and country differ significantly. The following describes the segment characteristics. 3.3.1 The convertedGender and age The converted segment contains an almost equal number of men and women, 52% and 48%. Thus, the women are overrepresented compared to the total number of replies, where 39% are women. A large share of the converted are aged between 40 and 59 years. Education and income The converted is also the segment with the largest household incomes and the largest disposable incomes for daily consumption when all regular expenses are paid. Political position Dwelling 3.3.2 The convertibleGender and age The convertible distribute on age as follows: which is very close to the age distribution of the total group. Education and income Political position Dwelling 3.3.3 The accessibleGender and age In terms of age, the group breaks down as follows: Education and income The accessible are closest to the total group in terms of disposable household income surplus for daily use. In terms of household income, the group comes third of the four segments. Political position Dwelling 3.3.4 The inaccessibleGender and age Compared to the average, the group has fewer in the age group 40-59 years, with more of them in the group +60 years. In terms of age, the group breaks down as follows: Education and income The inaccessible are the group among the four segments with the lowest household incomes. Political position Dwelling |


