Dry deposition and spray drift of pesticides to nearby water bodies

Appendix D. Experimental values of aqueous phase mass transfer coefficients

Rockland Lake
Lake 302 N
Pyramid Lake
Crowley Lake
Mono Lake
Siblyback Lake
Dozmary Pool
Relations between u(10) and k(600) for sea areas
Estuaries
Wind tank
References

In the following information is given on all data on the measurements of the aqueous phase mass transfer coefficient of CO2 at 20° C in freshwater k(600) as a function of the wind speed at 10 m height (u(10)) used in this report. The values were either found in tables in the publications, derived from figures and sometimes aqueous phase mass transfer coefficients for other gases and conditions were converted to k(600) values.

Rockland Lake

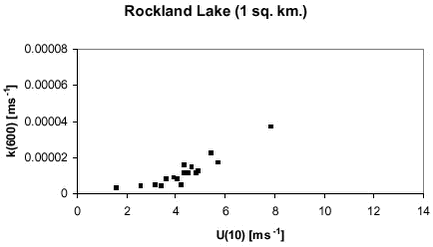
Figure D-1. Relation between k(600) and u(10) for Rockland Lake (1 km2)(Wanninkhof et al., 1995).

Figure D-1. Relation between k(600) and u(10) for Rockland Lake (1 km2)(Wanninkhof et al., 1995).
Figur D-1. Forhold mellem k(600) og u(10) for Rockland Lake (1 km2)(Wanninkhof et al., 1995).


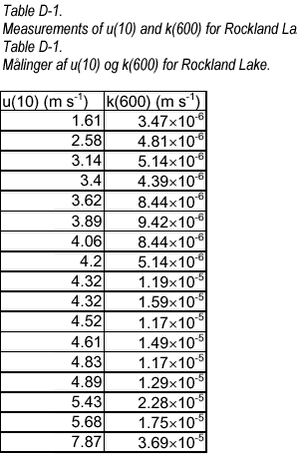
Click on the picture to see the html-version of: ‘‘Table D-1‘‘

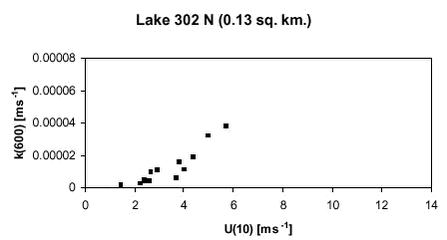
Figure D-2. Relation between k(600) and u(10) for Lake 302 N (0.13 km2) (Crucius and Wanninkhof, 1990).

Figure D-2. Relation between k(600) and u(10) for Lake 302 N (0.13 km2) (Crucius and Wanninkhof, 1990).
Figur D-2. Forhold mellem k(600) og u(10) for Lake 302 N (0.13 km2) (Crucius and Wanninkhof, 1990).

Lake 302 N

Table D-2.

Measurements of u(10) and k(600) for Lake 302 N. Tabel D-2.

Målinger af u(10) og k(600) for Lake 302 N.

u(10) (m s-1) k(600) (m s-1)
1.43 1.97× 10⁻⁶
2.25 2.97× 10⁻⁶
2.38 5.28× 10⁻⁶
2.44 4.47× 10⁻⁶
2.54 4.14× 10⁻⁶
2.60 4.47× 10⁻⁶
2.67 9.75× 10⁻⁶
2.92 1.13× 10⁻⁵
3.68 6.28× 10⁻⁶
3.81 1.64× 10⁻⁵
4.03 1.18× 10⁻⁵
4.38 1.92× 10⁻⁵
4.98 3.22× 10⁻⁵
5.68 3.83× 10⁻⁵

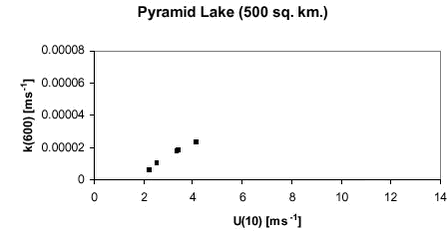
Pyramid Lake

Figure D-3. Relation between k(600) and u(10) for Pyramid Lake (500 km2) (Peng and Broecker, 1990).


Figure D-3. Relation between k(600) and u(10) for Pyramid Lake (500 km2) (Peng and Broecker, 1990).
Figur D-3. Forhold mellem k(600) og u(10) for Pyramid Lake (500 km2) (Peng og Broecker, 1990).

Table D-3. Measurements of u(10) and k(600) for Pyramid Lake.
Tabel D-3. Målinger af u(10) og k(600) for Pyramid Lake.

u(10) (m s-1) k(600) (m s-1)
2.22 6.44× 10⁻⁶
2.54 1.04× 10⁻⁵
3.33 1.77× 10⁻⁵
3.43 1.84× 10⁻⁵
4.13 2.38× 10⁻⁵

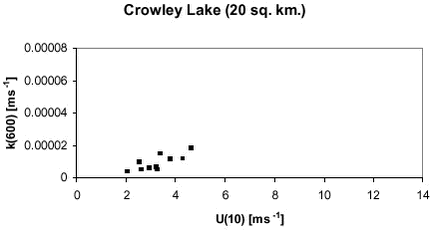
Figure D-4. Relation between k(600) and u(10) for Crowley Lake (20 km2) (Wanninkhof et al., 1991a).

Crowley Lake

Figure D-4. Relation between k(600) and u(10) for Crowley Lake (20 km2) (Wanninkhof et al., 1991a).
Figur D-4. Forhold mellem k(600) og u(10) for Crowley Lake (20 km2) (Wanninkhof et al., 1991a).

Table D-4.
Measurements of u(10) and k(600) for Crowley Lake.
Tabel D-4.
Målinger af u(10) og k(600) for Crowley Lake.

u(10) (m s-1) k(600) (m s-1)
2.06 4.31× 10⁻⁶
2.54 9.58× 10⁻⁶
2.63 5.28× 10⁻⁶
2.92 6.11× 10⁻⁶
3.23 6.78× 10⁻⁶
3.27 5.44× 10⁻⁶
3.37 1.52× 10⁻⁵
3.81 1.14× 10⁻⁵
4.29 1.21× 10⁻⁵
4.62 1.83× 10⁻⁵

Mono Lake

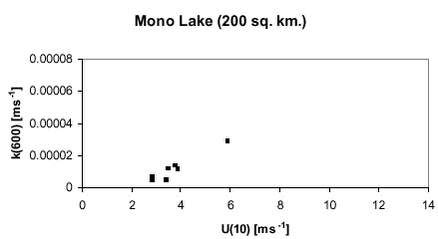
Figure D-5. Relation between k(600) and u(10) for Mono Lake (200 km2) (Wanninkhof et al., 1991a).

Figure D-5. Relation between k(600) and u(10) for Mono Lake (200 km2) (Wanninkhof et al., 1991a).
Figur D-5. Forhold mellem k(600) og u(10) for Mono Lake (200 km2) (Wanninkhof et al., 1991a).

Table D-5. Measurements of u(10) and k(600) for Mono Lake.
Tabel D-5.
Målinger af u(10) og k(600) for Mono Lake.

u(10) (m s-1) k(600) (m s-1)
2.83 4.97× 10⁻⁶
2.86 7.28× 10⁻⁶
3.43 4.97× 10⁻⁶
3.49 1.20× 10⁻⁵
3.75 1.39× 10⁻⁵
3.87 1.19× 10⁻⁵
5.87 2.94× 10⁻⁵

Siblyback Lake

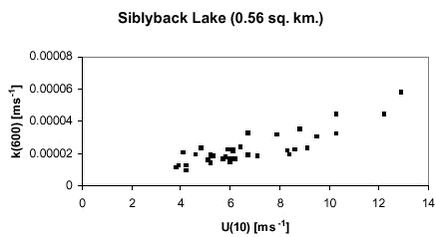
Figure D-6. Relation between u(10) and k(600) for Siblyback Lake (0.56 km2) (Upstill- Goddard et al., 1990).

Figure D-6. Relation between u(10) and k(600) for Siblyback Lake (0.56 km2) (Upstill-Goddard et al., 1990).
Figur D-7. Forhold mellem u(10) og k(600) for Siblyback Lake (0.56 km2) (Upstill-Goddard et al., 1990).

Table D-6.
Measurements of u(10) and k(600) for Siblyback Lake.
Tabel D-6.

Målinger af u(10) og k(600) for Siblyback Lake.


u(10) (m s-1) k(600) (m s-1)
3.8 1.17× 10⁻⁵
3.9 1.25× 10⁻⁵
4.1 2.11× 10⁻⁵
4.2 1.00× 10⁻⁵
4.2 1.25× 10⁻⁵
4.6 1.97 × 10⁻⁵
4.8 2.39 × 10⁻⁵
5.1 1.61× 10⁻⁵
5.2 1.44× 10⁻⁵
5.2 1.89× 10⁻⁵
5.3 1.83× 10⁻⁵
5.7 1.69× 10⁻⁵
5.8 1.78× 10⁻⁵
5.9 2.25× 10⁻⁵
6.0 1.53× 10⁻⁵
6.0 1.67× 10⁻⁵
6.1 2.17× 10⁻⁵
6.1 2.25× 10⁻⁵
6.2 1.69× 10⁻⁵
6.4 2.44× 10⁻⁵
6.7 1.92× 10⁻⁵
6.7 3.28× 10⁻⁵
7.1 1.83× 10⁻⁵
7.9 3.17× 10⁻⁵
8.3 2.19× 10⁻⁵
8.4 1.97× 10⁻⁵
8.6 2.25× 10⁻⁵
8.8 3.56× 10⁻⁵
9.1 2.36× 10⁻⁵
9.5 3.08× 10⁻⁵
10.3 3.25× 10⁻⁵
10.3 4.47× 10⁻⁵
12.2 4.47× 10⁻⁵
12.9 5.81× 10⁻⁵

Dozmary Pool

Table D-7.   Measurements of u(10) and k(600) for Dozmary Pool.

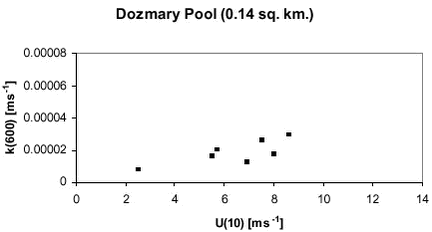
Figure D-7. Relation between k(600) and u(10) for Dozmary Pool (0.14 km2) (Upstill-Goddard et al., 1990).
Figur D-7. Forhold mellem k(600) og u(10) for Dozmary Pool (0.14 km2) (Upstill-Goddard et al., 1990).

Table D-7.
Measurements of u(10) and k(600) for Dozmary Pool.
Tabel D-7.
Målinger af u(10) og k(600) for Dozmary Pool.


u(10) (m s-1) k(600) (m s-1)
2.5 8.06× 10⁻⁶
5.5 1.61× 10⁻⁵
5.7 2.06× 10⁻⁵
6.9 1.28× 10⁻⁵
7.5 2.61× 10⁻⁵
8.0 1.75× 10⁻⁵
8.6 2.97× 10⁻⁵

Figure 10 in the main part of this report gives the relation between k(600) and u(10) for all lakes.

Relations between u(10) and k(600) for sea areas

In the following tables information is shown on the experimentally determined relations between u(10) and k(600) for sea areas. Table D-8.

Measurements of u(10) and k(600) for the North Sea (Watson et al., 1991). Table D-8.

Målinger af u(10) og k(600) for Nordsøen (Watson et al, 1991).

u(10) (m s-1) k(600) (m s-1)
11.7 4.72× 10⁻⁵
11.9 4.94× 10⁻⁵
12.1 6.03× 10⁻⁵
17.5 1.51× 10⁻⁴

Table D-9.
Average values of u(10) and k(600) for the Atlantic and Pacific Ocean (Peng et al., 1979; published in Hartman and Hammond (1985).
Tabel D-9.
Gennemsnitlige værdier af u(10) og k(600) for Atlanterhavet og Stillehavet (Peng et al, 1979; offentligtgjort i Hartman og Hammond (1985).

u(10) (m s-1) k(600) (m s-1)
8 4.14× 10⁻⁵

Table D-10. Measurements of u(10) and k(600) for the North Pacific (Peng et al., 1979) published in Hartman and Hammond (1985).
Tabel D-10. Målinger af u(10) og k(600) for den nordlige del af Stillehavet (Peng et al, 1979; offentligtgjort i Hartman og Hammond (1985).

u(10) (m s-1) k(600) (m s-1)
12 8.44× 10⁻⁵

Table D-11. Measurements of u(10) and k(600) for the Atlantic Ocean (Broecker and Peng, 1971) published in Hartman and Hammond (1985).
Tabel D-11. Målinger af u(10) og k(600) for Atlanterhavet (Peng et al, 1979; offentligtgjort i Hartman og Hammond (1985).

u(10) (m s-1) k(600) (m s-1)
7 2.52× 10⁻⁵

Table D-12.
Average u(10) and k(600) for the Antarctic Ocean (Peng et al., 1979) published in Hartman and Hammond (1985).
Tabel D-12.
Gennemsnitlige værdier af u(10) og k(600) for Atlanterhavet (Peng et al, 1979; offentligtgjort i Hartman og Hammond (1985).

u(10) (m s-1) k(600) (m s-1)
10.1 6.06× 10⁻⁵

Table D-13.
Measurements of u(10) and k(600) for the NE Atlantic Ocean (Kromer and Roether, 1983).
Tabel D-13.
Målinger af u(10) og k(600) for den nordøstlige del af Atlanterhavet (Kromer og Roether, 1983).

u(10) (m s-1) k(600) (m s-1)
6 2.97× 10⁻⁵
8 8.00× 10⁻⁵

Table D-14.
Measurements of u(10) and k(600) for the Equatorial Atlantic Ocean (Kromer and Roether, 1983; published in Hartman and Hammond, 1985).
Tabel D-14.
Målinger af u(10) og k(600) for den tropiske del af Atlanterhavet (Kromer og Roether, 1983; offentligtgjort i Hartman og Hammond, 1985).

u(10) (m s-1) k(600) (m s-1)
5 1.63× 10⁻⁵
7 1.18× 10⁻⁵
7 1.92× 10⁻⁵

Table D-15.
Measurements of u(10) and k(600) for the Equatorial Pacific Ocean (Nightingale et al., 2000).
Tabel D-15.
Målinger af u(10) og k(600) for den tropiske del af Stillehavet (Nightingale et al., 2000).

u(10) (m s-1) k(600) (m s-1)
6.05 3.69× 10⁻⁵
6.65 2.72 × 10⁻⁵
7.15 3.08× 10⁻⁵
7.15 3.17× 10⁻⁵

Table D-16.
Measurements of u(10) and k(600) for George Banks (Wanninkhof et al., 1993).
Tabel D-16.

Målinger af u(10) og k(600) for George Banks (Wanninkhof et al., 1993).

u(10) [ms-1] k(600) (m s-1)
4.54 1.69× 10⁻⁵
5.69 3.25× 10⁻⁵
8.80 6.54× 10⁻⁵
11.5 7.74× 10⁻⁵

Table D-17.
Measurements of u(10) and k(600) for the southern North Sea (Nightingale et al., 2000).
Tabel D-17.
Målinger af u(10) og k(600) for den sydlige del af Norsøen (Nightingale et al., 2000).

u(10) (m s-1) k(600) (m s-1)
5.9 1.99× 10⁻⁵
7.6 6.00× 10⁻⁵
8.2 4.00× 10⁻⁵
10.0 6.89× 10⁻⁵
10.1 5.25× 10⁻⁵
10.6 5.50× 10⁻⁵
11.4 1.16× 10⁻⁴
12.5 7.36× 10⁻⁵
14.7 1.72× 10⁻⁴

Figure 12 in the main part of this report gives the relation between k(600) and u(10) for all sea areas.

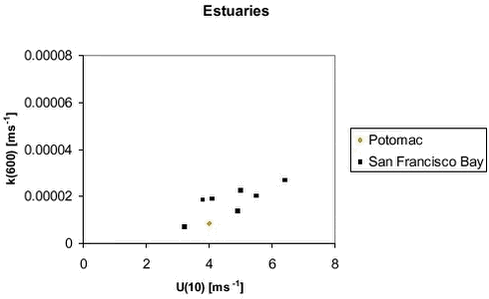
Estuaries

The following measurements are made in estuaries.

Table D-18.
Measurements of u(10) and k(600) for San Francisco Bay (Hartman and Hammond, 1984).
Tabel D-18.
Målinger af u(10) og k(600) for San Francisco Bay (Hartman og Hammond, 1984).

U(10) (m s-1) k(600) (m s-1)
3.2 6.94× 10⁻⁶
3.8 1.85× 10⁻⁵
4.1 1.88× 10⁻⁵
4.9 1.39× 10⁻⁵
5.0 2.26× 10⁻⁵
5.5 2.03× 10⁻⁵
6.4 2.66× 10⁻⁵

Table D-19.
Measurements of u(10) and k(600) for the Potomac (Hartman and Hammond, 1985).
Tabel D-19.

Målinger af u(10) og k(600) for Potomac (Hartman og Hammond, 1985).

u(10) (m s-1) k(600) (m s-1)
4 8.28× 10⁻⁶

Figure 8 gives an overview of the relation between k(600) and u(10) for estuaries.

Figure D-7. Relation between k(600) and u(10) for all estuaries.
Figur D-7. Forhold mellem k(600) og u(10) for alle flodmundinger.

Wind tank

Figure 9 gives the results of experiments in a wind-water tank (Wanninkhof et al., 1991b). The wind speed at 10 m (u(10)) was calculated using the following correlation betwen A(0) and u(10): log (u(10)) = (log(a) – log(c) + b A(0))/d, where a = 72.75, b= 0.0730 (Wanninkhof et al., 1991b), c=0.45 and d = 1.6 (MacIntyre et al., 1995).

Figure D-8. Relation mellem k(600) og u(10) for wind tank experiments (Wanninkhof et al., 1991b).

Figur D-8. Forhold mellem k(600) og u(10) for vindtankeksperimenter (Wanninkhof et al., 1991b). Table D-20.

Measurements of u(10) and k(600) in wind tanks. Tabel D-20.

Målinger af u(10) og k(600) i vindtanke.

u(10) (m s-1) k(600) (m s-1)
2.64 8.58× 10⁻⁶
3.65 1.75× 10⁻⁵
5.82 2.81× 10⁻⁵
8.26 4.11× 10⁻⁵
8.68 6.17× 10⁻⁵
10.3 6.17× 10⁻⁵
11.2 7.08× 10⁻⁵
11.2 7.78× 10⁻⁵
11.2 8.53× 10⁻⁵
13.3 1.32× 10⁻⁴
14.2 1.44× 10⁻⁴
14.2 1.51× 10⁻⁴
15.6 2.20× 10⁻⁴

References

Broecker, W.S., Peng, T.H. (1971) The vertical distribution of radon in the BOMEX area. Earth Planet. Sci. Lett. 11, 99-108

Crucius, J., Wanninkhof, R. (1990) A gas exchange- wind speed relationship measured on Lake 302N with SF6. EOS 71, 1234.

Hartman, B., Hammond, D.E. (1984) Gas exchange rates across the sediment-water and air-water interface in south San Francisco Bay. J. Geophys. Res. 89. 3593-3603.

Hartman, B., Hammond, D.E. (1985): Gas exchange in San Francisco Bay. Hydrobiologia 129, 59-68

Kromer, B., Roether W. (1983) Field measurements of air-sea gas exchange by the radon deficit method during JASIN 1978 and FGGE 1979. Meteor-Forsch. Ergebn. A24, 55-75.

Liss, P.S., Merlivat, L. (1986) Air-sea gas exchange rates: Introduction and synthesis. In: Buat-Ménard, P. (ed.) The role of air-sea exchange in geochemical cycling. Reidel, Dordrecht, The Netherlands, 113-127.

Macintyre, S., Wanninkhof, R., Chanton, J.P. (1995) Tracer gas exchange across the air-water interface in freshwater and coastal marine environments. In: Matson, P.A., Harriss, R.C. (eds.): Biogenic trace gases: measuring emissions from soil and water, Blackwell Science, Oxford, UK, 52-97.

Nightingale, P.D., Liss, P.S., Schlosser, P. (2000): Measurements of air-sea gas exchange during an open ocean algal bloom. Geoph. Res. Lett. 27, 2117-2120.

Nightingale, P.D, Malin, G., Law, C.S., Watson, A.J., Liss, P.S. Liddicoat, M.I., Boutin, J., Upstill-Goddard, R.C. (2000) In situ evaluation of air-sea gas exchange parameterizations using novel conservative and volatile tracers. Global Biogeochemical Cycles 14, 373-387.

Peng ,T.H., Takahashi, T., Broecker, W.S. (1974) Surface radon measurements in the north Pacific Ocean station PAPA. J. Geophys. Res. 79, 1772-1780

Peng, T.H., Broecker, W.S., Mathieu, G.G., Li ,Y.H. Bainbridge, A.E. (1979): Radon evasion rates in the Atlantic and Pacific Oceans as determined during the GEOSECS program. J. Geophys. Res. 79, 2471-2486

Peng, T.H., Broecker, W. (1980) Gas exchange rates for three closed basin lakes. Limnol. Ocean. 25, 789-796

Upstill-Goddard, R.C., Watson, A.J., Liss, P.S., Liddicoat, M.I. (1990) Gas transfer velocities in lakes measured with SF6, Tellus 42B, 364-377

Wanninkhof, R., Bliven, L.F., Glover, D.M. (1991b) Transfer velocities and radar backscatter. International symposium on gas transfer at water surfaces, p 294-308.

Wanninkhof, R., Ledwell, J.R., Broecker, W.S. (1985) Gas exchange-wind speed relation measured with sulfur hexfluoride on a Lake. Science, 227,1224-1226.

Wanninkhof, R., Ledwell, J.R., Crucius, J. (1991a): Gas exchange on Mono Lake and Crowley Lake,California. J. Geophys. Res., 92, 14567-14580

Wannikhof R., Asher W., Weppernig R., Chen H., Schlosser P., Langdon C., Sambrotto, R. (1993): Gas transfer experiment on George Banks using two volatile deliberate tracers. J. Geophys. Res. 98, 20237-20248.

Watson, A.J., Upstill-Goddard, R.C., Liss, P.S. (1991) Air-sea gas exchange in rough and stormy seas measured by a dual-tracer technique. Nature 349,145-147