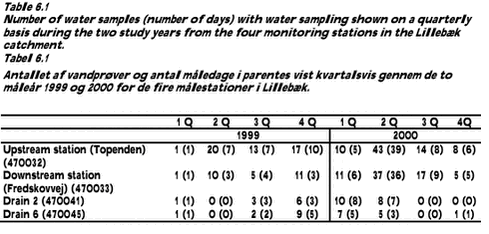
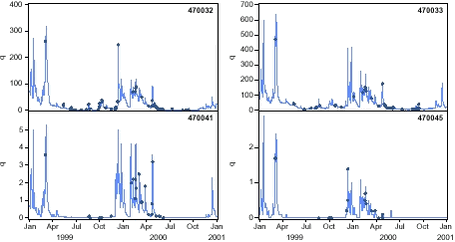
Pesticides in streams and subsurface drainage water within two arable catchments in Denmark: Pesticide application, concentration, transport and fate6 Pesticide occurrence and concentration in stream and drains in the Lillebæk catchment6.1 Water and sediment samples collected from the monitoring stations in the Lillebæk catchment6.2 Detection of pesticides in stream and sub-surface tile drainage water 6.3 Key pesticides detected in stream and drainage water 6.4 Pesticides in suspended sediment 6.5 Pesticides in streambed sediment 6.1 Water and sediment samples collected from the monitoring stations in the Lillebæk catchmentTable 6.1 shows the number of water samples analysed for pesticides in the Lillebæk catchment. Water samples were collected from the four monitoring stations during both sampling years on sampling dates shown in Figure 6.1.
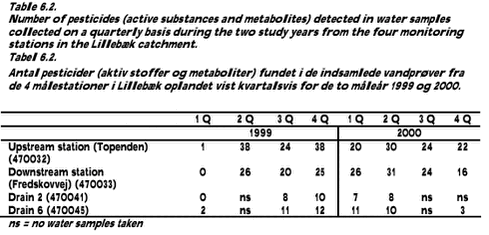
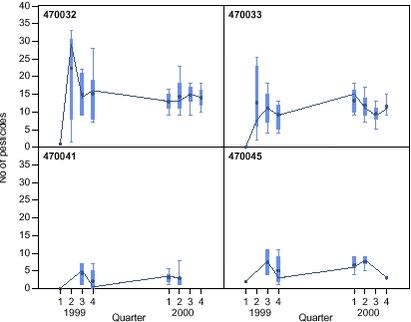
Figure 6.1. A total of 24 and 23 storm events, respectively, were sampled at the upstream and downstream monitoring stations in the Lillebæk catchment in 1999 and 2000, whereas 29 and 30 water samples, respectively, were collected during periods with steady or decreasing discharge conditions. Suspended sediment was collected with an in situ sediment sampler (SubMarie) from both stream stations during the second study year. A total of eight samples were collected from the upstream station (Topenden) and eight samples from the downstream station (Fredskovvej). Three streambed sediment samples were collected from both stream stations during surveys in the first study year (March, May and June 1999) and another three sediment samples were collected from the downstream and upstream station during surveys in the second study year (May and June 2000). 6.2 Detection of pesticides in stream and sub-surface tile drainage waterForty-nine different pesticides and metabolites were analysed in the water samples collected from stream and subsurface tile drainage water. The total number of different pesticides detected was 42 and 40, respectively, at the upstream and downstream sampling station in the Lillebæk during the 2- year study period. Much fewer pesticides were detected in the two tile drains: 17 pesticides in drain 2 and 16 pesticides in drain 6. The number of pesticides detected varied between the different seasons of the study years. Generally, more pesticides were detected during the main spraying season in the second quarter of 1999 and 2000 (Table 6.2). More pesticides were detected in stream water than in subsurface tile drainage water during the different seasons of 1999 and 2000 (Table 6.2). Figure 6.2 shows descriptive statistics for the number of pesticides detected per water sample in each quarter of the study period for the four sampling stations in Lillebæk. The median and average number of pesticides detected in stream water is 2-5 times higher than in tile drainage water. A seasonal trend in the number of pesticides detected per water samples was found for the two stream stations during the first study year, the number of pesticides per water samples being highest in the 2nd quarter of 1999 (Figure 6.2). A similar but less marked trend was also found for the upstream station in 2000. There was a large variation in the average number of pesticides detected in the water samples during the quarters of the first study year (1999). Less variation in the number of pesticides detected per water sample was found during the second study year (Fig. 6.2). The variation was presumably caused by a combination of sampling strategy, changes in hydrology between the two study years and changes in pesticide application factors that will all be discussed later in the report.
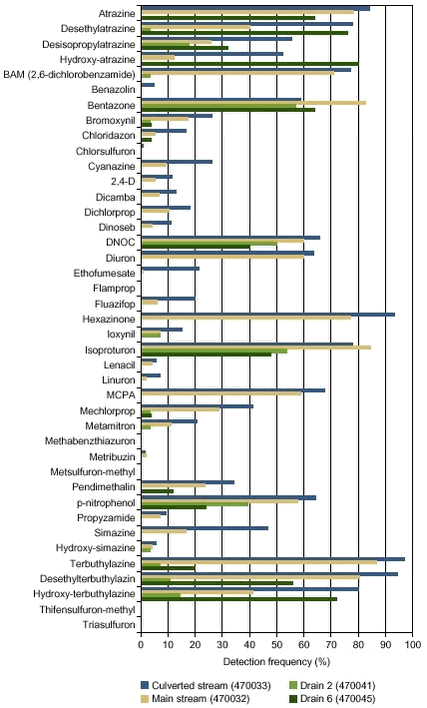
Figure 6.3 shows the detection frequency for herbicides recovered at the four stations in the Lillebæk catchment. The highest detection frequencies were generally found at the upstream monitoring station (culverted channel) as compared to the downstream monitoring station (open channel). Although generally experiencing the highest detection frequencies, the culverted stream receives no pesticides via wind drift, direct atmospheric deposition and surface runoff. The ten most commonly detected herbicides at the upstream station were terbuthylazine and its metabolites, hexazinon, atrazine and its metabolites, isoproturon, BAM, MCPA, DNOC, diuron, nitrophenol and bentazone all having detection frequencies above 50% (Fig. 6.3). The ten most commonly found herbicides detected at the main stream station were the same as for the upstream catchment, which is drained through a culverted channel. In nearly all cases (except for bentazone), the detection frequency was higher at the upstream station than the downstream station covering the entire Lillebæk catchment (Fig. 6.3). The detection frequency was generally lower in tile drainange water than in stream water (Fig. 6.3). However, the herbicides bentazone, isoproturon, atrazine and metabolites, metabolites of terbuthylazine and DNOC were all detected at rather high (>40%) frequencies in tile drainage water (Fig. 6.3). The most commonly detected herbicides in tile drainage water were bentazone, isoproturon and DNOC at drain 2 and metabolites from terbuthylazine, bentazone, isoroturon and metabolites from atrazine at drain 6.
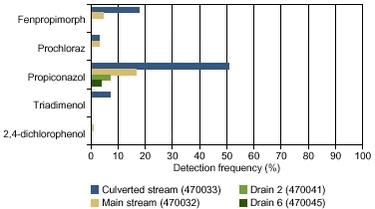
Fungicides were almost exclusively detected at the two stream stations, with the exception of propiconazole that was also detected at the two drain stations (Fig. 6.4).
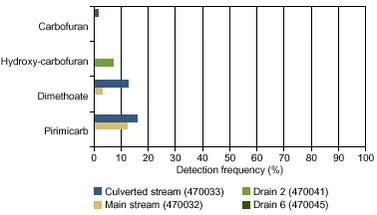
The detection frequency for fungicides was generally much lower than for herbicides, the only fungicide revealing a frequency above 20% being propiconazol (51%) for the upstream station draining the culverted catchment. The detection frequency for four of the five fungicides was highest at the stream station receiving water from the culverted catchment. Three insecticides and one metabolite were analysed in water samples from the Lillebæk catchment (Fig. 6.5). The detection frequency for insecticides was generally low, the highest being 13% in case of dimethoate and 16% for pirimicarb at the upstream culverted stream (Fig. 6.5). These two insecticides were detected at both stream stations, whereas only one metabolite was detected at one of the drain stations (Fig. 6.5).
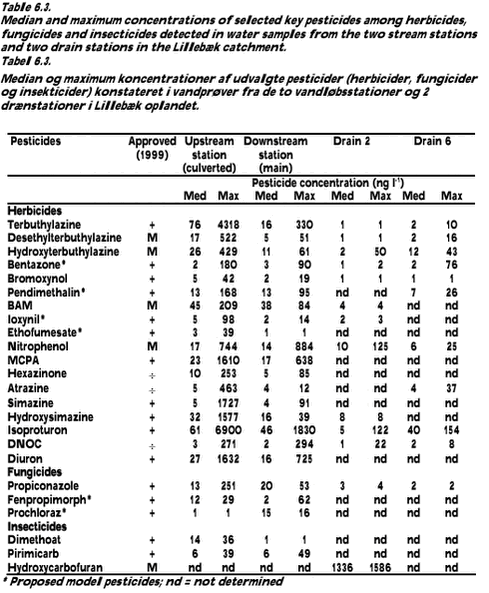
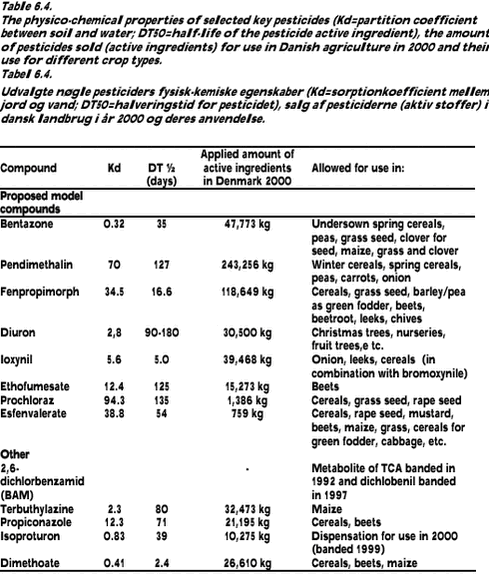
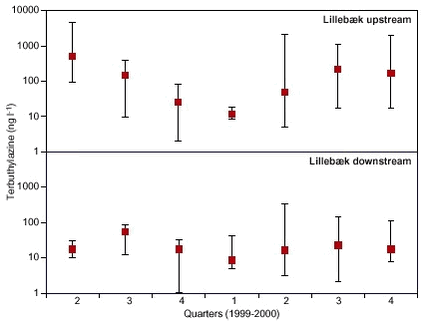
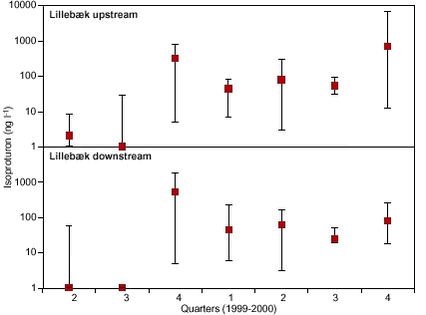
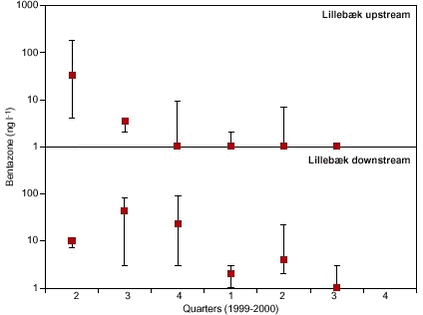
Nine pesticides were detected at all four monitoring stations (bentazone, propiconazole, terbuthylazine and metabolites, isoproturon, two metabolites from atrazine, DNOC, nitrophenol, mechlorprop and bromoxynil). Six of these pesticides were applied in the catchment during the two study years, whereas atrazine and metabolites, DNOC and the metabolite nitrophenol have been banned for agricultural use for several years. The somewhat high and widespread detection frequency of DNOC and nitrophenol at the four sampling stations in the Lillebæk catchments can, however, be explained by traffic emissions. The median and maximum pesticide concentrations measured at the four sampling stations in the Lillebæk catchment are shown in Table 6.3 for selected key pesticides from the three groups of herbicides, fungicides and insecticides. The median and maximum concentration of all analysed pesticides in water samples from stream and tile drains can be found in Appendix 6.1. More pesticides were measured in concentrations exceeding 100 ng l-1 at the upstream station in the Lillebæk catchment (16 pesticides and 4 metabolites) as compared to the downstream main station (8 pesticides), drain 2 (2 pesticides and 1 metabolite) and drain 6 (1 pesticide and 1 metabolite). The 10 pesticides and metabolites with the highest maximum concentrations detected at the upstream culverted station were isoproturon (6900 ng l-1), terbuthylazine (4318 ng l-1), simazine (1727 ng l-1), diuron (1632 ng l-1), MCPA (1610 ng l-1), hydroxysimazine (1577 ng l-1), chlorsulfuron (1422 ng l-1), nitrophenol (744 ng l-1), cyanazin (640 ng l-1) and desethylterbuthylazine (522 ng l-1). Similar findings for the downstream stations were isoproturon (1830 ng l-1), nitrophenol (884 ng l-1), diuron (725 ng l-1), MCPA (638 ng l-1), terbuthylazine (330 ng l-1), DNOC (294 ng l-1), cynanazin (218 ng l-1), lenacil (119 ng l-1), pendimethalin (95 ng l-1) and simazine (91 ng l-1). Seven of the pesticides detected in highest maximum concentrations were similar at the two stream stations, the maximum concentration being highest for all seven pesticides at the upstream culverted station. In tile drainage water at drain 2, the highest maximum concentrations were detected for hydroxycarbofuran (1586 ng l-1), nitrophenol (125 ng l-1) and isoproturon (122 ng l-1), whereas the similar findings at drain 6 were hydroxyatrazine (244 ng l-1), isoproturon (154 ng l-1) and bentazone (76 ng l-1). Twenty pesticides were detected in more than 25% of the water samples at the upstream station in the Lillebæk catchment (Appendix 6.1). Of these 20 pesticides the substances found most frequently at high concentrations as measured by the median concentration were terbuthylazine (76 ng l-1), isoproturon (61 ng l-1), BAM a metabolite from dichlobenile (45 ng l-1), diuron (27 ng l-1) and hydroxyterbuthylazine (26 ng l-1). Fifteen of the pesticides were detected in more than 25% of the water samples at the downstream station in the Lillebæk catchment (Appendix 6.1). Of these 15 pesticides, the substances found most often at high concentrations as measured by the median concentration were isoproturon (46 ng l-1), BAM (38 ng l-1), MCPA (17 ng l-1), diuron (16 ng l-1) and terbuthylazine (16 ng l-1). It therefore seems that there is a distinct similarity in the most frequently detected pesticides at high concentrations between the two stream stations in the Lillebæk catchment. This was of course also to be anticipated if the pesticides were only applied in the upstream catchment. However, diuron, terbythylazine, MCPA, and isoproturon were applied in both sub-catchments during at least one of the study years. The reason for finding similar pesticides at both stations may be a result of loss from both sub-catchments to the stream and/or a simple dilution of pesticides lost from only the upstream catchment. Four of the pesticides were detected in more than 25% of the water samples at drain two as compared to nine pesticides at drain six in the Lillebæk catchment (Appendix 6.1). The four pesticides found most frequently in drain two had all median concentrations below 10 ng l-1. In drain six, isoproturon (40 ng l-1) and the metabolites desethylsatrazine (36 ng l-1), hydroxyterbuthylazine (12 ng l-1) and hydroxyatrazine (14 ng l-1) experienced median concentrations higher than 10 ng l-1. Five of the pesticides detected in high concentrations in the Lillebæk catchment have been banned for agricultural use for several years in Denmark (Table 6.3). Of these five pesticides, the most commonly detected pestides were atrazine, BAM (a metabolite from dichlobenile), hexazinone, DNOC and nitrophenol, the latter two being emitted from traffic. 6.3 Key pesticides detected in stream and drainage waterA number of key pesticides are selected for a more thorough presentation of their occurrence and concentration in Lillebæk during the study period. The pesticides selected represent six model pesticides chosen at an early stage of the project and other pesticides representing a combination of various active substances (herbicides, fungicides and insecticides) with different physico-chemical properties. Table 6.4 shows the thirteen pesticides together with information about their physico-chemical properties and use in Danish agriculture. Figure 6.6 shows the median and the range in concentration of terbuthylazine in the different quarters of 1999 and 2000. The herbicide, terbuthylazine, was applied to different crop types within the upstream culverted catchment and within the open channel sub-catchment during the 2nd quarter of 1999 and only in the upstream sub-catchment in 2000. A clear seasonal pattern was detected for terbuthylazine at the upstream station, the concentration being lowest during the winter period (4th and 1st quarters) and highest during the 2nd quarter of 1999 and the 2nd and 3rd quarter of 2000 (Fig. 6.6). This seasonal pattern was measured for both the minimum, median and maximum concentration of terbuthylazine at the upstream station. A similar, but much less significant, seasonal pattern was also measured for terbuthylazine at the downstream station (Fig. 6.6). The application of terbuthylazine therefore seems to have an impact on the concentration pattern measured in the stream. The median and the range in the concentration of isoproturon in the different quarters of 1999 and 2000 are shown in Figure 6.7. The herbicide isoproturon was only applied to different crop types within the upstream culverted catchment and the open channel sub-catchment during the 4th quarter in 1998 and 1999. The largest quantity was however applied in the 4th quarter of 1999. The application of isoproturon in the 4th quarter of 1999 was followed by an immediate steep rise in the concentration in the same quarter at both stream stations (Fig. 6.7). The concentration of isoproturon increased in the subsequent quarters of 2000 at the upstream station, whereas a decline was measured at the downstream station (Fig. 6.7). The application of isoproturon therefore seems to have an impact on the concentration pattern measured in the stream. Figure 6.8 shows the median and the range in the concentration of bentazone in the different quarters of 1999 and 2000. The herbicide bentazone was only applied to different crop types within the upstream culverted catchment and the open channel sub-catchment during the 2nd quarter of 1999 and 2000. The application of bentazone was, however, only 18 g in the upstream culverted sub-catchment in the 2nd quarter of 1999 as compared to 2130 g in the open channel sub-catchment. Almost similar quantities were applied in the 2nd quarter of 2000. There was no clear relationship between the measured concentration and application time of bentazone (Fig. 6.8). The concentration of bentazone was highest in the 2nd quarter of 1999 at the upstream station although only a small amount of bentazone was applied. Moreover, the concentration of bentazone remained low during all 2000 regardless of the application during the 2nd quarter of 2000. The concentration of bentazone increased between the 2nd quarter and the 3rd and 4th quarter of 1999 at the downstream station following the application during the 2nd quarter of 1999 (Fig. 6.8). The concentration of bentazone was also slightly higher during the 2nd quarter of 2000 at the downstream station following the application during the same quarter. The concentration pattern for bentazone is therefore not well linked to the timing of bentazone application in the catchment.
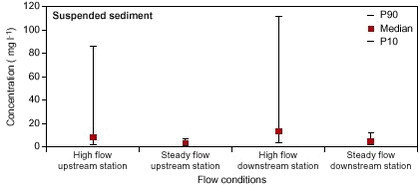
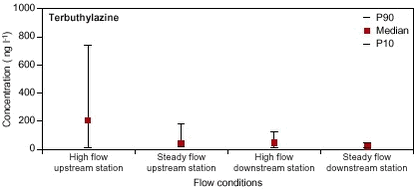
The median, 10 and 90 percentiles of the concentration of suspended sediment and key pesticides were calculated for days with more and less than 1 mm of precipitation. In this way the measured concentrations of pesticides were dubdivided into periods with high and steady flow conditions at the two stream stations in the Lillebæk catchment during 2000. The number of water samples in the high-flow and low-flow data sets were 20 and 29, respectively, at the upstream station and 18 and 30, respectively, at the downstream station. The concentration of suspended sediment on days with high-flow was exceedingly higher than on days with steady flow conditions at both the upstream and downstream station in the Lillebæk (Fig. 6.9). The difference in median concentration of suspended sediment between high-flow and steady-flow conditions was most significant at the upstream station although the maximum concentration (90 percentile) was nearly equally high at the two stream stations (Fig. 6.9). Suspended sediment delivered from the catchment is consequently transported downstream, especially during high-flow periods. The concentration of terbuthylazine was also higher during high-flow periods than during steady-flow periods at the upstream station in Lillebæk (Fig. 6.10). This was, however, not the case at the downstream station. Terbuthylazíne was applied in both the ustream culverted catchment and the downstream open catchment during the 2nd quarter of 1999, but only in the upstream culverted catchment during the 2nd quarter of 2000. The Kd value of 2.3 for terbuthylazine suggests that it can be transported from the upstream culverted sub-catchment both as dissolved and particulate matter. The small difference in the concentration of terbuthylazine measured during high-flow and steady-flow periods at the downstream station seems to imply that no major source areas deliver terbutylazine to the open stream channel between the upstream and downstream sampling station and hence dilution will occur. Terbuthylazine will also be subjected to sorption, decomposition and/or depositional processes in the open stream channel between the two sampling stations. Another explanation for the significant difference in measured terbuthylazine concentrations between the two sampling stations during rainy periods could be the existence of pesticide-polluted areas (contaminated areas) from where terbuthylazine is lost via tile drains during rainy periods to the culverted stream. Therefore, such contaminated areas linked to the open stream via tile drains do not exist in the downstream sub-catchment.
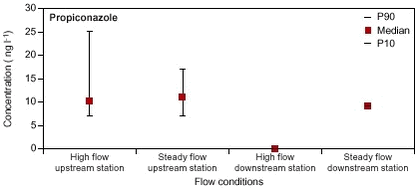
The concentration of propiconazole is also slightly higher at the upstream station during high flow-periods than during periods with steady flow, whereas propiconazole was not detected at the downstream station (Fig. 6.11).
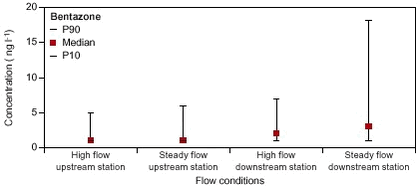
On the contrary, the concentration of bentazone was slightly higher during periods with steady flow than during high-flow periods (Fig. 6.12). Moreover, the median concentration of bentazone increases from the upstream to the downstream station, the latter being more influenced by discharging groundwater. The observed pattern suggests that bentazone is predominantly delivered to the stream via groundwater. Bentazone has also been detected in concentrations of less than 100 ng l-1 in the upper groundwater in the Lillebæk catchment during 1999 and 2000 (Funen County, 2001).
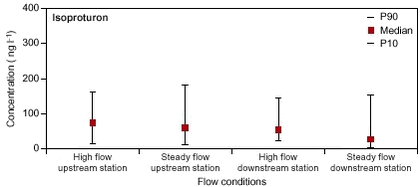
The median concentration of isoproturon is nearly at the same level at the two stations irrespectively of flow conditions (Fig. 6.13). Moreover, the 10 and 90 percentiles did not vary much during high and low-flow conditions at the stream stations. As no dilution or enrichment of the concentration of isoproturon seems to exist at any of the stream stations, isoproturon must be delivered to the stream from both the culverted and the open sub-catchments via groundwater and soil water. Isoproturon has also been detected in concentrations above 200 ng l-1 in the upper groundwater in the Lillebæk catchment during 1999 and 2000 (Funen County, 2001).
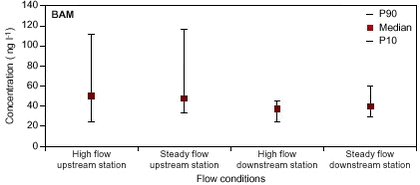
The median concentration of the metabolite BAM (from the banned pesticide dichlobenile) is higher at both stream stations during steady-flow conditions than during high-flow conditions (Fig. 6.14). The results show that BAM is delivered both from the sub-catchment via groundwater and soil water. BAM was also detected in upper groundwater in the Lillebæk catchment during 1999, but not in 2000 (Funen County, 2001).
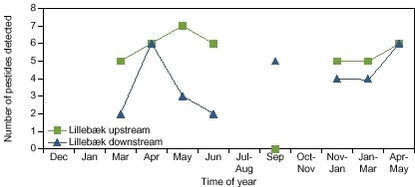
6.4 Pesticides in suspended sedimentComposite suspended sediment samples were collected on a near monthly basis at the two stream stations in Lillebæk with the in situ SubMarie suspended sediment sampler (see chapter 4). The number of pesticides detected in suspended sediment increases from March to May 2000 and again from winter to spring in 2001 at the upstream station in the Lillebæk catchment. Nearly the same pattern, but with fewer detected pesticides is found at the downstream station although a sharp decline was found from April to May/June 2000 (Fig. 6.15).
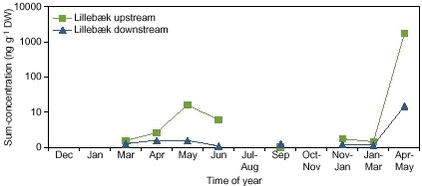
The most significant difference in the number of pesticides detected in suspended sediment between the two stations was in the sample from September 2000 where no pesticides were detected at the upstream station while five pesticides were found at the downstream station. The sum-concentration of pesticides in suspended sediment was consistently low at both stream stations during the sampled winter months (March 2000, November-January 2000/2001 and January-March 2001 (Fig. 6.16). During these periods the highest amount of suspended sediment is delivered to the streams from their catchments and transported downstream. The content of pesticides in suspended sediment during these periods can therefore be anticipated to be a reference level for the external delivery of pesticides in suspended sediment. The average sum-concentration of pesticides in suspended sediment was nearly three times higher at the upstream station (98 ng g-1 DW) than at the downstream station (38 ng g-1 DW) during the three sampled winter months.
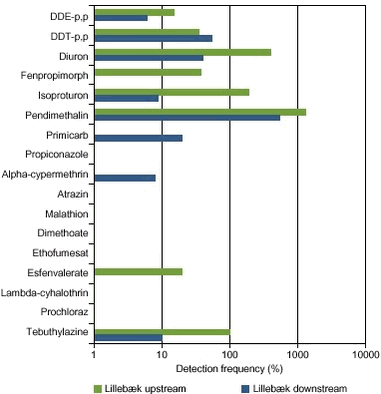
The sum-concentration of pesticides in suspended sediment increased at both stream stations during the spring application season (April and May 2000 and 2001) (Fig. 6.16). The enrichment of suspended sediment with pesticides was, however, much higher during the spring period at the upstream station than at the downstream station. The highest sum-concentration of pesticides in suspended sediment measured at the upstream station was 597 ng g-1 DW in May 2000 and 1617 ng g-1 DW during the period April-May 2001 (Fig. 6.16). This shows that pesticides from the water phase must be sorbed to the suspended sediment collected in the sampler during the spring period. Other factors that may influence the pesticide content of suspended sediment are differences in grain size distribution and organic carbon content factors that were not analysed for in the sediment samples. The maximum concentration of pesticides recovered above the detection limit in suspended sediment at the two stream stations is shown in Figure 6.17. The pesticides measured in the highest concentrations were diuron (400 ng g-1 DW) in the sample of May 2000 from the upstream station and pendimethalin (1300 ng g-1 DW) and isoproturon (190 ng g-1 DW) in the sample from April/May 2001 from the upstream station. Esfenvalerate was measured in the suspended sediment sample from May 2000 at the upstream station at a concentration of 20 ng g-1 DW.
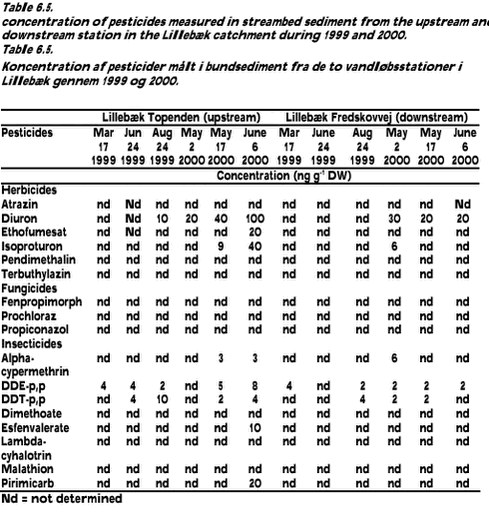
6.5 Pesticides in streambed sedimentThe number of pesticides detected in streambed sediment generally increased from early spring to autumn (1999) or from early May to June (2000). This was, however, most pronounched for the upstream station in the Lillebæk draining the culverted catchment. The highest number of pesticides detected at the upstream station was seven in June 2000, including DDT-p,p and the metabolite DDE-p,p, but also insecticides, such as esfenvalerate, alpha-cypermethrin and pirimicarb were found (Table 6.5). The highest concentration was detected for diuron at the upstream station in June 2000. The number of pesticides detected and the pesticide concentration were considerably lower at the downstream station than at the upstream station in the Lillebæk. Many of the same pesticides were, however, detected in the bed sediment at both stream stations (Table 6.5). |
