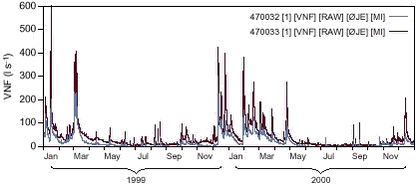
Pesticides in streams and subsurface drainage water within two arable catchments in Denmark: Pesticide application, concentration, transport and fate5 Catchment hydrology5.1 Lillebæk catchment5.2 Odderbæk catchment 5.1 Lillebæk catchmentThe instantaneous discharge at the upstream station and the downstream station is shown in Figure 5.1. Stream flow appears rather flashy during the two study years in Lillebæk, indicating quick hydrological response in the catchment. This seems especially to be the case at the downstream station. In summer, discharge gets very low at both stations.
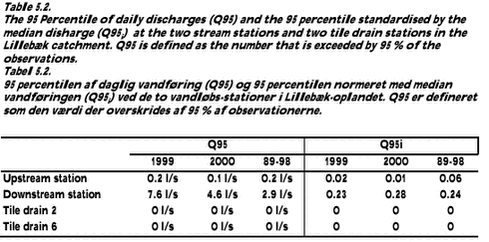
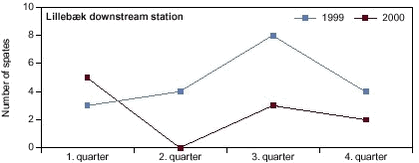
Table 5.1 shows the annual mean daily discharge and runoff from the two stream stations and two tile drain stations for the two study years and as average for the period 1989-1998. Mean daily discharge was considerably higher during the first study year (1999) than the second study year (2000). The discharge in 2000 reassembles average conditions in the previous ten years (1989-1998). The difference in mean daily runoff between the two study years was rather high at both stream stations, which means that the influence of groundwater in the Lillebæk catchment is generally weak. There is a remarkable difference in hydrological response between the tile drains, drain no. 2 having higher runoff and lower year–to-year variability than drain no. 6. 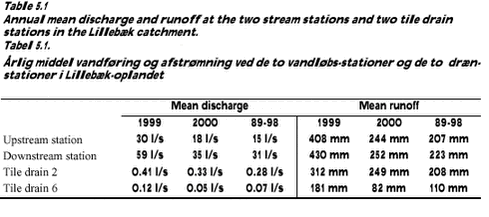 Click on the picture to see the html-version of: ‘‘Table 5.1‘‘ Table 5.2 shows low-flow characteristics at the two stream stations and two tile drain stations for the two study years and as average for the period 1989-1998. Q95 is the 95 percentile of daily discharges stated in litres per second and gives the size of the discharge in the low-flow situation recurring in the summer. Q95i in the right column of Table 5.2 is defined as the 95 percentile normalised by median discharge, and is a measure of the variability of the flow and also gives the proportion of steady and slowly responding water. It appears that the stream at the upstream station runs nearly dry every year and obviously there must be a source of steady contributing water from the lower sub-catchment to the downstream station. Given that the content of pesticides changes with runoff components, presumably the higher proportion of steady flow at the downstream station could be traced in the summer concentrations at this location. The frequency of spates higher than three times the quarterly median of daily discharge at the downstream station is shown in Figure 5.2. The greatest difference in peak flow between the two study years is that more spates were measured during the spring and summer period of 1999 than during the same period in 2000. This can be of importance for the detection of pesticides in drainage and surface water.
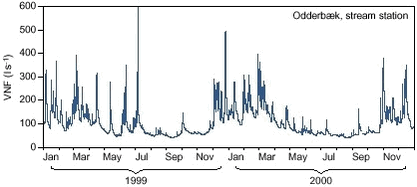
5.2 Odderbæk catchmentThe instantaneous discharge at the stream station in the Odderbæk is shown in Figure 5.3. Stream flow appears rather flashy during the two study years in Odderbæk, indicating quick hydrological response in the catchment. In summer there is still a substantial amount of water running in the stream.
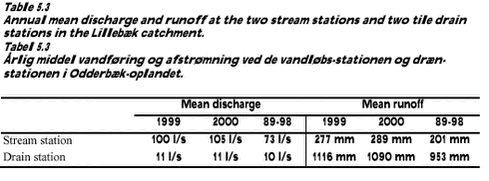
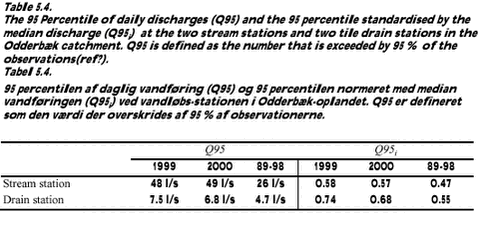
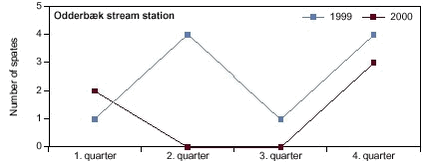
The annual mean daily discharge and runoff from the stream station and tile drain station is shown for the two study years and as average for the period 1989-1998 in Table 5.3. Mean daily discharge was similar during the two study years, but more wet than average conditions in the previous ten years (1989-1998). Mean runoff at the drainstation is higher than gross precipitation, presumably because the drain receives groundwater from neighbouring catchments. Table 5.4 shows low-flow characteristics at the stream station and tile drain station for the two study years and as average for the period 1989-1998. Q95 is the 95 percentile of daily discharges stated in litres per second and gives the size of the discharge in the low-flow situation recurring in summer. Q95i in the right column of Table 5.4, is defined as the 95 percentile normalised by median discharge, and is a measure of the variability of the flow and also gives the proportion of steady and slowly responding water. The rather high values of Q95i suggest that there is a permanent groundwater reservoir contributing to the discharge in the Odderbæk catchment. The content of pesticides in water draining this reservoir can be revealed by looking at summer concentrations. The frequency of spates higher than three times the quarterly median of daily discharge at the downstream station is shown in Figure 5.4. The greatest difference in peak-flow between the two study years is that five major spates appeared during the spring and summer period of 1999 compared to none in the same period in 2000. This could be important for the detection of pesticides in drainage and surface water.
|
